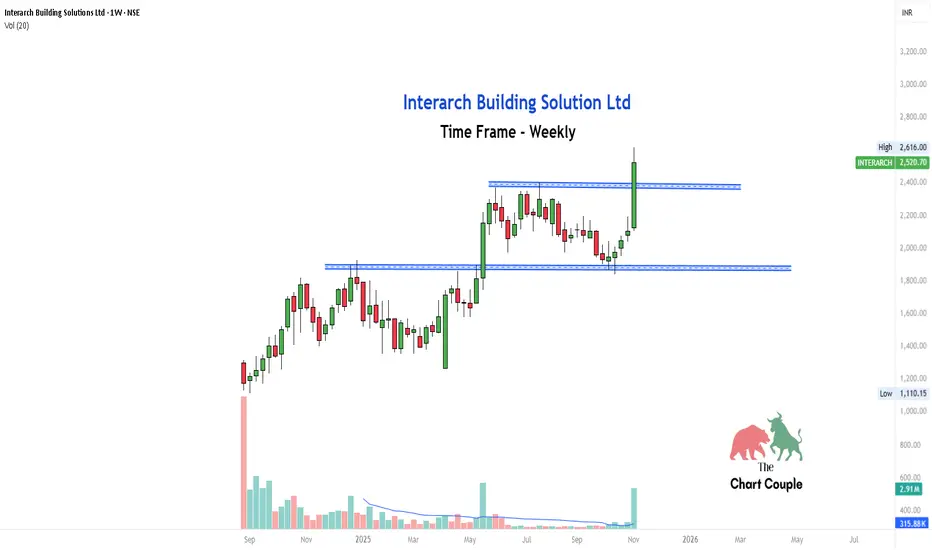
Interarch Building Solution Ltd — Weekly Chart AnalysisInterarch Building Solution Ltd recently broke above a well-defined resistance zone around ₹2,400 after consolidating for several weeks.
The breakout candle is supported by noticeable volume, which validates the move and makes it a strong case study for breakout learners.
What can we learn here:
Breakouts are more reliable on higher timeframes like weekly charts.
Volume expansion often precedes sustained momentum.
Patience during consolidation phases pays off when structure confirms breakout.
Braekout
Long term idea on Intellect designI daily make educational content videos for swing / positional trading

Intraday Navin Fluorine Trade !!!!Navin fluorine is breaking out above 3850 could soon see levels of 3935 and 3990.
Long near 3865-3875

Shib flag pattern#Shibainu
Bul flag pattern on shiba inu touch Life time high now with flag pattern breakout with high volume participate

ISEC : nice and clean momentum setup11 weeks base - cup n handle on weekly
perfect VCP on daily
also a ascending triangle continuation pattern
volume dry up
> 100% prior move
riped for BO
First entry above 770.
ILong

Ajanta pharma - Swing tradeAjanta pharma looks good for swing trade entry at 2340 CMP. SL of 2200 approx. Breakout of channel retest and continuation of trend can be seen on daily chart.

Crompton Breakout - Rounding BottomCrompton breakout after forming a rounding bottom pattern in the daily timeframe. Looks good for positional at this level. SL below the breakout area or previous swing.

UNIONBANK: BUY ABOVE 85 SL 81.40 TARGET 90.30UNIONBANK is a BUY ONLY ABOVE 85, with Stoploss at 81.40 and Target of 90.30.

Nifty : Will Butterfly Fly away ??Hi Guys... its been a while right ? yeah..long weekends n other commitments to fulfill with Nifty ranging in flag, there is nothing interesting for the last two trading days. Not anymore... Probably Nifty will decide its path in a day or two, Doji's indicate 2 things - Indecision & A Decision soon. So its time for Nifty to decide the direction, we have Bearish Butterfly n flag ranging. If Bearish Butterfly wins, flag breaks-down to south which is considered as failure of Bullish Flags. If Flag breaks out upside, Butterfly is unfortunate.
Decide based on your trading plan which side you are gonna take n when...Never trade in speculation or Hurry, Follow proper plan...
