CAD/JPY – 15 Min CADJPY is currently auctioning into a well-defined premium array, approaching clustered buy-side liquidity resting just beneath the 114.00 psychological handle. The recent impulsive expansion exhibits the characteristics of a liquidity engineering move, suggesting the objective may be stop collection rather than authentic bullish continuation.
Price is interacting with a refined bearish order block, aligned with the upper boundary of the active dealing range. The lack of efficient acceptance beyond this region implies potential institutional distribution, positioning the market for a rotational move back toward value.
Market Structure Assessment
Gradual expansion into equal highs signals buy-side liquidity buildup
Current test of premium favors distribution over accumulation
Any rejection here would likely confirm a lower timeframe market structure shift (MSS)
Downside delivery could accelerate as price seeks internal inefficiencies
Order flow at this elevation suggests vulnerability to a liquidity-driven retracement.
Current Dealing Range Logic
With price trading at the upper extreme of the range, the market sits firmly in premium territory, where risk-reward increasingly favors short positioning.
The highlighted zone should be interpreted as a distribution / mitigation area, not evidence of bullish acceptance. Unless price can reprice higher with displacement, this region remains tactically favorable for fade setups.
Scenario Framework
Primary Thesis | Rotation Toward Discount
Initial draw on liquidity rests near 113.55, the first internal support
A break lower exposes the fair value gap (FVG) around 113.20, aligning with equilibrium
Failure to stabilize there increases probability of continuation into 113.10, where deeper sell-side liquidity may reside
The projected move would represent a classic premium-to-discount rebalancing
Risk / Invalidation
Sustained acceptance above 114.05 would invalidate the distribution thesis
Such price behavior would signal successful buy-side continuation and a shift in order flow toward bullish expansion
📌 Bias: Short while price operates in premium after a probable buy-side sweep
📌 Context: Liquidity buildup → premium test → distribution potential
📌 Market Condition: Range-bound environment with elevated probability of rotational mean reversion
Breadth Indicators


Sector Rotation With Sector Relative Strength [Afnan]Most traders spend their time reading charts, drawing levels, waiting for breakouts, and searching for the perfect Demand Zone pattern. But very few ask the most important question:
“Is the sector supporting my trade?”
That single question often separates strong moves from failed setups. A breakout inside a weak sector usually fades. A demand zone inside an underperforming group often breaks. But a stock backed by a strong sector? Even a simple pattern can turn into a powerful trending move.
This is where the Sector Relative Strength indicator becomes a game-changer.
🧭 Why Sector Strength Matters 🧭
When institutional money rotates from one sector to another, prices shift in a way that pure price action cannot reveal on its own. This rotation is what fuels trends in some stocks while suppressing others.
A weak stock in a strong sector can still deliver solid moves.
A strong chart inside a weak sector often struggles.
Sector rotation is an early signal of where markets want to move next.
Following sector flow aligns your trades with market momentum rather than fighting it.
This indicator simplifies all of that.
📌 What This Indicator Brings to the Table 📌
Sector Relative Strength Afnan provides real-time sector rotation directly on TradingView, condensing complex institutional analysis into a clean and actionable structure.
Tracks 26 Indices at once.
Uses multi-timeframe relative strength — RS21, RS55, and RS123.
Automatically detects your stock’s related sector.
Compares each sector with your chosen benchmark.
Shows short-term and medium-term rank changes.
Uses EMA alignment to classify trends.
Displays heatmap colors for instant clarity.
Shows market sentiment as outperform, mixed, or underperform.
Fully customizable for traders outside India as well.
This transforms sector analysis from a tedious manual task into a smooth, visual workflow.
🛠️ How to Use It Like a Pro 🛠️
To unlock the full potential of this indicator, use it in a two-layer setup:
Add the first instance with the table ON — this is your sector scanner.
Add the second instance with the table OFF — this keeps your chart clean while still showing relative strength lines and sector mapping.
Once your setup is ready, focus on sectors that show:
High ranking positions.
Positive relative strength across periods.
Clear trend alignment.
Improving rank over 5 and 21 bars.
Avoid sectors that fall deep into the red zone or show consistent deterioration. These areas often trap traders and reduce momentum.
Following this simple rule — trade in strong sectors and avoid weak ones — instantly improves trade selection.
🚀 What Makes This Tool Truly Unique 🚀
To manually replicate everything this indicator does, you would need to calculate:
Relative strength for every sector.
Sector-to-benchmark comparisons.
Multi-period RS changes.
Trend checks through EMA alignment.
Rank history for multiple lookbacks.
Heatmap scoring.
Sentiment classification.
This is the type of work traders either avoid or pay subscription fees for on premium websites.
Having it automated inside a TradingView indicator saves hours and removes guesswork, allowing you to focus on the highest-probability opportunities.
📌 “The market rewards those who follow strength, not those who chase noise.”
Lastly, Thank you for your support, your likes & comments.
✨ Keep learning, stay disciplined, and let the trend be your guide. ✨
This analysis is purely for educational purposes and is not a trading or investment recommendation. I am not a SEBI-registered analyst.

OBV + MACD Confirmed FVG📉 Bitcoin – Bearish FVG Retracement With EMA200, OBV & MACD Momentum Confluence
This chart highlights a clean bearish structure on BTC, defined by a consistent sequence of Lower Highs (LH) and Lower Lows (LL). Throughout this downtrend, multiple Fair Value Gaps (FVGs) have formed — each created by sharp institutional displacement that leaves behind inefficiencies in price.
As price continues trending below the EMA200, bearish order flow remains firmly intact. Each time BTC retraces into an unmitigated FVG, the market efficiently rebalances the imbalance before resuming downward continuation.
In this setup, the integration of FVGs + EMA200 + OBV + MACD Histogram builds a high-probability roadmap for identifying premium retracement zones and anticipating continuation moves.
The major FVG above current price sits directly under the EMA200 and aligns with weakening OBV momentum. This makes it the most structurally significant bearish reaction zone. A secondary FVG exists below it, but carries less importance due to weaker displacement and reduced confluence.
⸻⸻⸻⸻⸻⸻⸻⸻⸻⸻
📊 Key Observations
1️⃣ Prior Bearish FVG Reaction
A previously formed bearish FVG was cleanly mitigated, followed by immediate downside continuation.
This confirms that institutional order flow remains bearish and that FVG zones are functioning as efficient retracement magnets in the current trend.
2️⃣ High-Priority FVG Under EMA200 (Primary Zone)
This upper FVG has the strongest confluence:
Formed by strong bearish displacement
Sits directly below the EMA200, reinforcing trend direction
Aligns with market structure (LH → LL sequence)
OBV shows weakening buying pressure as price approaches the zone
MACD histogram is decreasing into FVG, signaling bearish momentum shift
This makes it the most likely level for a significant rejection if price retraces into it.
3️⃣ Secondary FVG Reaction Zone
A lower FVG also exists, but:
Formed during a smaller displacement
Does not align with EMA200 rejection
Carries weaker structural significance
It may still produce a minor reaction, but is lower probability compared to the primary FVG above.
4️⃣ OBV Momentum Context
OBV declines as price approaches the FVG, which is a critical confirmation.
When OBV decreases during a retracement, it signals absorption of buy-side pressure → strengthening the bearish continuation case.
5️⃣ MACD Histogram Confirmation
MACD histogram is rolling over and turning negative as price pushes toward the FVG.
This confirms bearish momentum returning, increasing the probability of a strong rejection from imbalance.
6️⃣ Structural Context
BTC maintains a clean LH–LL bearish sequence.
As long as price remains under the EMA200 and below the unmitigated FVGs, retracements are more likely to act as rebalancing moves rather than true reversal attempts.
⸻⸻⸻⸻⸻⸻⸻⸻⸻⸻
📊 Chart Explanation
Symbol → BITSTAMP:BTCUSD
Timeframe → 1D
This visualization demonstrates how Smart Money Concepts and momentum indicators align within a trending environment:
Clear LH → LL market structure
Multiple historical FVGs acting as premium retracement zones
A previously mitigated FVG confirming downside continuation
A high-confluence bearish FVG below the EMA200
OBV weakness during retracement phases
MACD histogram declining into FVG retest
Together, these elements create a textbook sequence:
displacement → inefficiency → retracement → mitigation → continuation
Price remains bearish unless BTC can break and close above the upper FVG with strong momentum and volume.
⸻⸻⸻⸻⸻⸻⸻⸻⸻⸻
📘 How EMA200, OBV & MACD Strengthen FVG Setups (Bullish + Bearish)
🔹 1. Trend Filter: EMA200
Below EMA200 → look for bearish FVG rejections
Above EMA200 → look for bullish FVG reactions
EMA200 acts as a dynamic mean-reversion anchor during trending markets.
🔹 2. OBV + FVG
OBV declining on FVG retest → bearish continuation
OBV rising into bullish FVG → bullish continuation
Volume trend strengthens or invalidates FVG reactions.
🔹 3. MACD Histogram + FVG
Falling histogram → bearish FVG confirmation
Rising histogram → bullish FVG confirmation
MACD shows whether momentum aligns with the imbalance.
🔹 Combined Logic (Works Both Ways)
Displacement creates an FVG
Price retraces into the FVG
Trend filter (EMA200) agrees
OBV + MACD confirm volume + momentum direction
Price rejects and continues trend.
⸻⸻⸻⸻⸻⸻⸻⸻⸻⸻
✅ Summary
Market structure remains bearish with LH → LL continuity
A previously filled FVG validated downside continuation
The upper FVG is the highest-probability zone (EMA200 + OBV + MACD alignment)
The secondary imbalance carries lower significance
OBV and MACD both confirm weakening buyer pressure into FVG
As long as BTC stays below EMA200, retracements into FVG are likely continuation setups
⸻⸻⸻⸻⸻⸻⸻⸻⸻⸻
⚠️ Disclaimer
📘 For educational purposes only
🙅 Not SEBI registered
❌ Not financial or investment advice
🧠 Smart-Money-Concepts explanation only

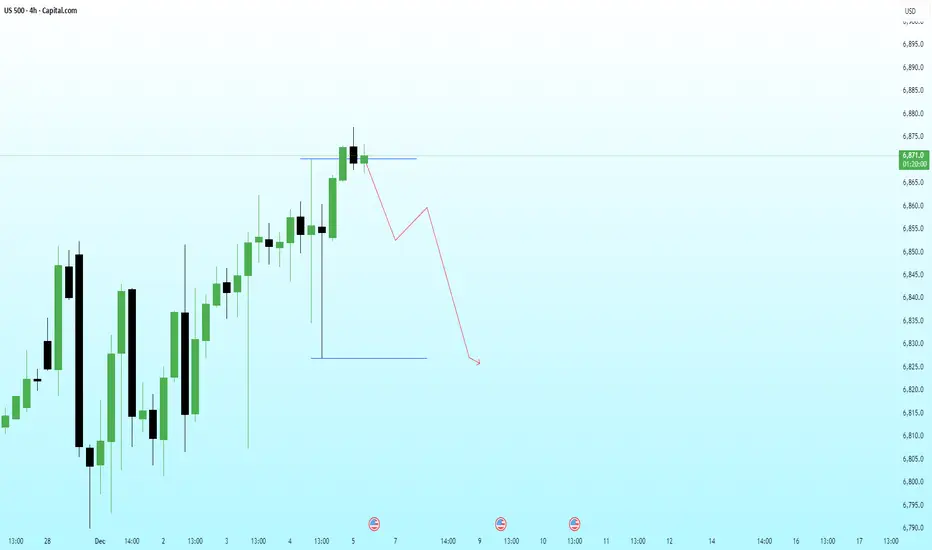
US500 – Liquidity Sweep at the Highs With Bearish Continuation PPrice has swept the immediate buy-side liquidity sitting above the recent high and is already showing signs of exhaustion. The reaction suggests a possible distribution phase forming near the top, aligning with the broader HTF narrative for a corrective leg.
If price fails to reclaim the swept high, the next logical target becomes the sell-side liquidity resting at the lower blue line.
Bearish Path:
• Sweep of the highs
• Failure to sustain above the level
• LTF shift into bearish structure
• Continuation toward downside liquidity + imbalance fill
⚠️ ENTRY CONDITION (IMPORTANT):
I will execute this trade only if the LTF replicates the structural behavior I expect from the HTF.
No LTF confirmation = No trade.
EURUSD – Retesting Demand Zone for Potential Upside ReversalPrice has tapped into a well-defined HTF demand zone after a controlled selloff. The latest wick into the zone suggests absorption and potential willingness to push higher.
If the zone continues to hold, I’m expecting bullish orderflow to kick in, leading to a structure shift and an upward continuation toward the next liquidity pool.
Bullish Path:
• Sweep into HTF demand
• Hold above the blue line (micro support)
• Shift in structure
• Continuation toward upside inefficiencies
⚠️ ENTRY CONDITION (IMPORTANT):
I will take the trade only if the LTF replicates the same structure and confirmations I’m anticipating on the HTF. No LTF alignment = No trade.
The idea remains valid as long as price respects the demand zone and doesn’t close decisively below it.

Part 7 Trading Master Class Why Traders Use Options
Hedging – Protect portfolio against price swings.
Speculation – Bet on future price movements with smaller capital.
Income Generation – Sell options and earn premiums.
Arbitrage – Exploit mispricing between spot and derivatives.
Options Pricing Models
Two main models:
Black-Scholes Model: Uses volatility, strike, expiry, and interest rates to price options.
Binomial Model: Breaks time into steps, considering probability of price moves.
Factors affecting option prices:
Spot price of underlying
Strike price
Time to expiry
Volatility
Interest rates
Dividends
Strategies in Option Trading
Options allow creation of custom payoff structures. Strategies are classified as:
A. Protective Strategies
Protective Put – Holding stock + buying put (like insurance).
Covered Call – Holding stock + selling call.
B. Income Strategies
Iron Condor – Selling OTM call & put, buying further OTM options.
Strangle/Straddle Selling – Profit from time decay when market is range-bound.
C. Speculative Strategies
Long Straddle – Buy ATM call + put, profit from big moves.
Bull Call Spread – Buy lower strike call, sell higher strike call.
Bear Put Spread – Buy higher strike put, sell lower strike put.
📊 Each strategy has its risk/reward profile. Professional traders combine them depending on market conditions.

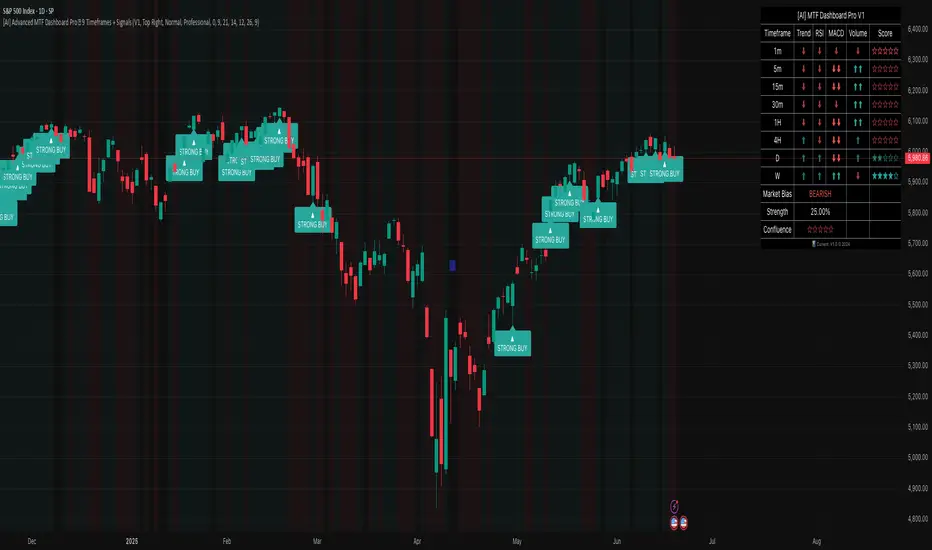
[AI] Advanced MTF Dashboard Pro █ 9 Timeframes + Signals# 🚀 Advanced MTF Dashboard Pro █ 9 Timeframes + Signals
## The Ultimate Multi-Timeframe Analysis Dashboard - See Everything at a Glance!
Transform your trading with the most comprehensive MTF dashboard on TradingView. This professional-grade tool analyzes 9 timeframes simultaneously, giving you instant market insights that would normally require multiple charts and hours of analysis.
---
## ⚡ KEY FEATURES
### 📊 **9-Timeframe Analysis**
✅ **Complete Coverage** - 1m, 5m, 15m, 30m, 1H, 4H, Daily, Weekly, Monthly
✅ **Toggle Control** - Show only the timeframes you need
✅ **Real-Time Updates** - All data refreshes automatically
✅ **Clean Organization** - Professional table layout
✅ **Smart Positioning** - Place dashboard anywhere on chart
### 🎯 **Multi-Indicator Analysis Per Timeframe**
✅ **Trend Direction** - EMA cross-based trend detection
✅ **RSI Momentum** - Overbought/oversold conditions
✅ **MACD Signals** - Histogram direction and strength
✅ **Volume Analysis** - Above/below average volume
✅ **Confluence Score** - Combined signal strength rating
### 💎 **Advanced Signal System**
✅ **Visual Status Indicators**
- ⬆⬆ Strong Bullish
- ⬆ Bullish
- ➡ Neutral
- ⬇ Bearish
- ⬇⬇ Strong Bearish
✅ **Confluence Ratings**
- ★★★★★ Excellent Setup
- ★★★★☆ Strong Setup
- ★★★☆☆ Good Setup
- ★★☆☆☆ Fair Setup
- ★☆☆☆☆ Weak Setup
### 📈 **Market Analysis Dashboard**
✅ **Overall Market Bias** - Instant bullish/bearish/neutral assessment
✅ **Bias Strength %** - Quantified market direction strength
✅ **Confluence Score** - Overall setup quality rating
✅ **Trend Alignment** - See when multiple timeframes agree
✅ **Smart Filtering** - Focus on high-probability setups
### 🔔 **Professional Alert System**
✅ **Strong Signal Alerts** - When confluence is extremely high
✅ **Bias Change Alerts** - Market direction shifts
✅ **Custom Messages** - Detailed alert descriptions
✅ **Multi-Timeframe Alerts** - Know which timeframes triggered
✅ **Smart Frequency** - No alert spam
### 🎨 **Customization Options**
✅ **4 Color Schemes** - Professional, Classic, Vibrant, Dark
✅ **6 Table Positions** - Top/Bottom/Middle + Left/Right
✅ **4 Text Sizes** - Tiny to Large
✅ **Toggle Features** - Show/hide any component
✅ **Visual Preferences** - Background colors, signals, etc.
---
## 🎯 PERFECT FOR
• **Multi-Timeframe Traders** - See all timeframes without switching
• **Confluence Traders** - Find high-probability aligned setups
• **Day Traders** - Quick market assessment for entries
• **Swing Traders** - Identify major trend alignments
• **Scalpers** - Spot micro-trends within larger trends
---
## 📱 WORKS ON ALL MARKETS
✅ **Forex** - All currency pairs
✅ **Crypto** - Bitcoin, Ethereum, all altcoins
✅ **Stocks** - Individual stocks and ETFs
✅ **Indices** - S&P 500, NASDAQ, etc.
✅ **Commodities** - Gold, Oil, Silver
✅ **Futures** - All futures contracts
---
## ⚙️ QUICK START GUIDE
### 1️⃣ **Add to Chart**
Click "Add to Favorites" and apply to any chart
### 2️⃣ **Configure Timeframes**
- Toggle ON the timeframes you trade
- Toggle OFF timeframes you don't need
### 3️⃣ **Customize Appearance**
- Choose your color scheme
- Select table position
- Adjust text size for your screen
### 4️⃣ **Interpret Signals**
- **Green rows** = Bullish timeframes
- **Red rows** = Bearish timeframes
- **More arrows** = Stronger signals
- **More stars** = Better confluence
### 5️⃣ **Set Alerts**
Right-click indicator → "Add Alert" → Choose conditions
---
## 📚 TRADING STRATEGIES
### **Strategy 1: Confluence Trading**
1. Wait for 70%+ timeframes to align (same direction)
2. Enter when confluence score shows ★★★★ or better
3. Use lower timeframe for precise entry
4. Higher timeframes for trend direction
### **Strategy 2: Timeframe Divergence**
1. Look for lower TFs turning while higher TFs trend
2. Potential reversal when multiple TFs flip
3. Confirm with volume increase
4. Best at major support/resistance
### **Strategy 3: Momentum Alignment**
1. All momentum indicators (RSI/MACD) align
2. Volume confirms direction
3. Enter on pullback to moving average
4. Exit when momentum diverges
---
## 🛠️ INDICATOR SETTINGS EXPLAINED
### **Timeframe Selection**
Each timeframe can be toggled on/off. Only active timeframes:
- Appear in the dashboard
- Count toward confluence
- Trigger alerts
### **Indicator Parameters**
- **Fast/Slow EMA**: Trend detection sensitivity (9/21 default)
- **RSI Length**: Momentum period (14 default)
- **MACD Settings**: Signal generation (12/26/9 default)
### **Visual Settings**
- **Table Position**: Where dashboard appears
- **Text Size**: Readability adjustment
- **Color Scheme**: Match your chart theme
### **Signal Settings**
- **Show Trend Strength**: Display trend indicators
- **Show Momentum**: RSI/MACD columns
- **Show Volume**: Volume analysis column
- **Show Confluence**: Star rating column
---
## 🌟 WHY CHOOSE ADVANCED MTF DASHBOARD PRO?
### **🤖 AI-Enhanced Analysis**
Our algorithms intelligently weight signals based on timeframe importance and market conditions, providing more accurate confluence scores than simple averaging.
### **⚡ Lightning Fast**
Optimized code ensures smooth performance even with all 9 timeframes active. No lag, no delays, just instant insights.
### **👁️ See Everything**
Stop switching between charts. One glance shows you everything you need to make informed trading decisions.
### **🎯 Precision Timing**
Identify the exact moment when multiple timeframes align for the highest probability trades.
### **📈 Proven Results**
Based on professional trading techniques used by institutional traders, now accessible to everyone.
---
## 💡 PRO TIPS
1. **Higher Timeframes = Stronger Trends** - Give more weight to 4H/Daily/Weekly
2. **Confluence is Key** - Best trades have 80%+ timeframe agreement
3. **Volume Confirms** - Look for volume spikes with signal alignment
4. **Patience Pays** - Wait for ★★★★★ setups for best results
5. **Risk Management** - Even perfect setups can fail, always use stops
---
## 🎯 ADVANCED USAGE
### **For Scalpers**
- Focus on 1m, 5m, 15m
- Quick confluence checks
- Rapid signal changes
### **For Day Traders**
- Use 5m to 1H primarily
- 4H for overall bias
- Balance speed with reliability
### **For Swing Traders**
- Emphasize 4H, Daily, Weekly
- Monthly for major trend
- Slower but more reliable signals
---
## 📞 SUPPORT & COMMUNITY
- 💬 **Comments Section** - Ask questions below
---
## ⚠️ RISK DISCLAIMER
Trading involves substantial risk of loss. Past performance does not guarantee future results. This indicator is for educational purposes and should not be considered financial advice. Always do your own research and use proper risk management.
---
## 🔄 VERSION HISTORY
**v1.0** (Current)
- Initial release
- 9 timeframe analysis
- 4 indicators per timeframe
- Confluence scoring system
- Full alert integration
- 4 color schemes
---
## 🙏 CREDITS
Inspired by institutional multi-timeframe analysis techniques
---
**🏷️ TAGS**
#MTF #MultiTimeframe #Dashboard #Confluence #TrendAnalysis #Momentum #RSI #MACD #Volume #DayTrading #SwingTrading #Scalping #Forex #Crypto #Stocks #TechnicalAnalysis #TradingDashboard #MarketAnalysis #AI #Signals
---
### ⭐ If this dashboard helps your trading, please leave a like and share your experience in the comments!
### 🚀 Click "Add to Favorites" to start seeing the market like never before!
Smallcap 100: No trades yetNIFTY SMALLCAP
➡️My customised indicator telling me to wait. This is one of the tools I use to decide the market breadth.
➡️When the index is above the channel, the chances of getting trades right and extremely rewarding are higher.
➡️Below it, it’s not the most conducive trading environment especially in smallcap.
➡️Not jumping onto new positional trades as of now.

Negative divergence for S&P 500 and No of stocks >50dmaThe breadth measured based on the number of stocks above or below the 50dma can be a good sentiment indicator. Weakness shows lower market participation at new highs and should set it up for a correction. Diffusion indicators like this are sometimes useful, especially while gauging the short-term trend.

NIFTY IT Retesting its 50 EMA levels IT is retesting its 50 EMA area
wil it sustain is the question
Majority of counters like TECHM, PERSISTENT, HCLTECH, NAUKRI etc witnessed a downmove in the week gine by
with result on the way, woul be fun to watch what IT has in store

ZOMATO DUAL BOTTOM ON HIGHER FRAME The counter formed a dual bottom on month frame
the dual bottom in major food delivery giant suggest bad days a thing of the past
lets see what's in store

TATA POWER - BREAKOUTTATA POWER has given a clear breakout
All the other power stock has already rallied and now this is time for tata power
could give 10-20% up move easily if market doesn't fall much
P.S. Only for analysis and not a buy/sell recommendation

MAXHEALTHCARE - Symmetrical triangle breakoutSymmetrical triangle breakout with huge volume
Q1 result is great and this breakout has proven that market has liked the result
has been consolidating for long and it is time to move up to at least recent high

today Pro Scalper indictor caught 200 nifty pointwe should combine this indicator with ADX indicator.
example of Sell
SELL signal
VWAP: Price trading below VWAP
Price is trading below Super trend (21,1)
Price is trading below Super trend (14,2)
Price is trading below Super trend (10,3)
ADX -DMI should be above 25


DABURFib Retracement 0% -> Take support 539
Avwap hlc/3 -> take support -520.20
Buying Range - 521 to 544
Target - 618
S.l - 508 day closing

Bullish on AlibabaThere's an RSI Divergence at the oversold zone in this scrip and it had bounced back from the support recently. So I'm bullish on this scrip in coming months.

Matic looks bullishMatic had brokeout from the symmetrical triangle pattern yesterday with massive volume and today I guess it consolidates a bit. If it sustains above the trend line today, we may expect a good upside move in this coin in coming days. There were other signals too
1. Closed above the Upper BB,
2. Closed well above the Pivot and may bounce back from the pivot,
So do have an eye on it.

Hold in AMBUJA CEMENTSThis scrip is in an uptrend for a while and it had retested the major resistance after the breakout. Now this is in a downfall after making fresh swing high and i see this a small consolidation. RSI is showing a divergence as well as last 2 days volume rising with fall in price, so i guess the downfall may continue for days to week but key levels according to me where this scrip might reverse is 410 & 392 (Monthly Pivot & Resistance).
Look for buying opportunity when there is a green candle with strong volume near those key levels

HOTHolo is HOT & CHEAP, it gave a triangke breakout, looking bullish, can give good investment returns, buy buy buy

Dixon Bullish, reversing to the mean line in the channel.Dixon has taken support around the baseline of a long term channel.
MACD has already indicated a reversal and the price is headed to the meanline which is atleast 5000.
Target- 5000
SL- 3900.
The view is supported by observation of move on Q4FY21 results day. This exhibited Long-Building behaviour on that day and since then maintaining uptrend.

Sugar: Bearish Bias.MACD has already given a sell signal at 17.
Signal confirmed if price breaks the support below 16.70 to 16.50
Hence the sugar rally is likely to take a breather under corrective wave C.
