Health sector in trouble and Aurobindo one of the victims?Health sector is not performing good recently and we cxan clearly see its effect on Aurobindo pharma which gave a clear breakdown from the trendlines.
Breakdown

Breakout expected in Indusind bank?A breakout is expected in Indusind Bank, it is taking support in 24 ema and a triangle pattern is also formed in the chart, there can be a breakdown or a breakout, can take entry after breakout and retest to be sure and avoid false breakout.

PRAKASH INDUSTRIES IN A DOWNTREND.Self explanatory chart.
A breakdown with volumes below 73 will make room for more fall till its next support of 63.
Should short after retest of breakdown.

At Crucial levels- Make or BreakIt is about to give breakout or breakdown.
In this pattern for almost 4 and half month.
Let's see how it goes further.
This post is for information purpose only.

RBL bank - Bearish Head & Shoulder RBL bank has formed a Bearish H&S pattern. Neckline breakdown would confirm further fall from here.

Havells - false Breakout ?? - Intraday - 6th AugustHavells Should trade below today's low 1212 for an intraday entry on 6th August. False breakouts tend to move faster than usual. Let's wait and watch in the live market.

TCS: Rising wedge breakdown?A decently medium term upward trendline originating from November 2020 has recently been broken by TCS. In fact, it seems to have started respecting recently formed downward trendline. After the recent pullback to the trendline and the averages, it is seeing the beginning of another bearish leg downwards.
_____________________________________________________________________________________________________________________________________________________
The pattern which has formed resembles a rising wedge and price seems to be breaking down from it. The bearish volume on the latest bar is also above average. It is possible that the downward momentum may continue further for some time.
The 20 and the 50 EMA which act as support during an uptrend also seem to be reversing their roles. They are exactly from where price is reacting to the downside, so they may be turning into resistance.
_____________________________________________________________________________________________________________________________________________________
Price could see a correction to the round figure level of about 3000. A positional short could be initiated if price sustains below the "SHORT BELOW" level for 15 minutes.
SHORT BELOW: 3162
STOP LOSS: 3223
TARGET 1: 3106
TARGET 2: 3045
_____________________________________________________________________________________________________________________________________________________
Plan your trade and manage risk properly.
Like and follow for more. :)

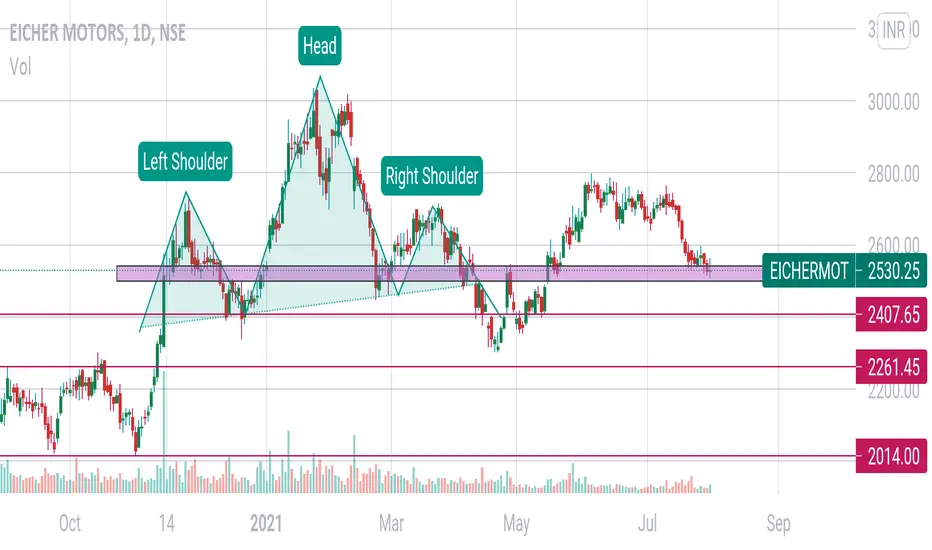
Eicher Motors in a very crucial levelEicher motors is taking support at very crucial point and if it goes down from here a breakdown can be expected with the levels mentioned, 2407, 2261, 2014.
P.S : Ignore that head and shoulder, its effect has already be done.
KABRA EXTRUSION | STILL STUCK IN THE RANGE | NSE:KABRAEXTRU
STILL STUCK IN THE RANGE. NEED TO WAIT FOR THE EITHER SIDE OF THE BREAK. If it gives the breakout on the upper side on daily candle with volume then we will see upside movement and same for breakdown on the lower side.
In positional trade, there will be easy 5% that one can get from this trade. Keep this on Radar.
But only take the trade once it have a cross the the level on daily candle with volume on either side.
Do comment if you have any doubt or suggestion.

IS GOLD STILL SHINING?GOLD is consolidating in a very important level and is expected to breakout/breakdown from this level, watch your positions carefully!!!

#hdfcbank heading further south?#hdfcbank heading south. it slid from the year long trendline channel post q1 results and then
M pattern neckline broke off earlier to set loose the slide and now lost the Fibonacci 50 retracement level 61%
also along with a below 40 rsi bearish momentum. Twice of double bottom could take the FII darling till 1360?

MARUTI - Breaking DownIf you ask me, it looks bearish as it broke resistance and failed retest, then retested new resistance and now validated it and remains below 7330.
Earnings are also in and the emotion is bearish.
All levels in the chart.
High OI at 7000. Once that is broken, we could see price drop fast.
MFI pointing down.
I would target 6850, and trail below.
Would definitely stop above 7335
Lets see.

Mentorship InstaView 27 July’21: So it decided to Break Down
Nifty View: A disappointing close from the benchmark Nifty index in today’s session - down 85 points to post a close at 15,734. This fall reverses the short term trend of the index DOWN and back to the support zone close to 15,650 which has so far worked well to hold up most sell-offs. Now, will it be able to hold up the index this time? My guess is as good as yours, but considering the higher time frames and the manner in which average prices have slowly tilted down, the possibility of some more weakness is very likely. As suggested before, this is not the best of times to go bullish aggressively, let’s wait out for a better price and opportunity.
Thank you for following my work and please feel free to share your thoughts and suggestions.
Trade Well. Trade Wise.


Auto Sector M pattern neckline brokenAuto Sector M pattern neckline broken. is it heading to break the weekly one.?

Multiple Breakouts in UptrendIn this Birla Corp. stock we have witnessed multiple breakouts in bullish trend for almost now a year.
This trend line is now a major support.
These are the multiple points where an investor or trader can take entry
and can efficiently plan a strategy and do money management.
And price action makes analysis simple and easy to understand and is least complicated.
The more simplistic the analysis is for yourself and more effectively and efficiently one can take actions in entry point for investment decision or trading position.
And the money flow index helps me to understand the strength in breakouts and breakdowns and volumes too.
This post is for to show you how without making things complicated you can analyze and earn money.
But remember just seeing breakouts/breakdowns one should not enter.
Multiple confirmation are must, like candlestick patterns, fibo retracement, price action patterns, etc.
This post is for information purpose only.

WATCH THIS BOUNCE BACK !Cochin Shipyard is clearly forming a parallel channel pattern as you can see in the chart. Stock is now very much near its support line and can bounce back at any moment.
Note :- If stock gives breakdown of support line , don't make a long call here. If a proper reversal candlestick pattern like morning star, doji , bullish engulfing etc is seen near the support line only then make a long call.
Target will be near the resistance line , i will advise you all to book profit before the stock touches the resistance line as it can reverse before too.
Only for education , feel free to share your views/feedback.

BANKNIFTY #BANKNIFTY FUT (D):- CMP 34670, if BNF sustain above 34500/34555 then we can see a good short covering in BNF FUT in 2nd half :)
Otherwise breakdown happened, & more fall further continue...
#Disclaimer:-I just shared view for only educational purpose.

PENNANT & POLE PATTERN BREAKOUT AHEAD !SAIL : As you all can see that SAIL is forming pennant pattern from around 07 may 2021 , it took around 70 days to make this pattern. Now pattern is almost about to give a breakout / breakdown.
If it gives breakout , it will also break the 50 simple moving average (green line in the chart ) , Which is a strong bullish sign. Pole height is around 60% this implies the stock has more room ahead to move. If not 60% , 20% to 30% is also a good target for short term.
Lets keep Entry above 130 and very short term swing target of 148 .
Mid and long term holders can keep high targets.
This was my personal analysis on the stock and it was only for educational purpose. Feel free to share your views/ feedback.

HCLTECH HCLTECH (4HR):- CMP 987.9, KEEP EYE ON BREAKOUT OR BREAKDOWN
1) Symmetrical Triangle Pattern
2) Wait for Volume :)

USDJPY Overview Trend line break & Retest wait for Confirmation , It's a Continuation down trend either Fake breakdown

ACC awaiting bounce or breakdownWatch ACC for an trade oppurtunity.
Wait for bounce or breakdown, check the volume for confirmation.
Retrace would be a good entry.
Disclaimer : Sharing my ideas only for knowledge, please don't interpret as buy/sell/hold call. Do your analysis before any action !!

Hindalco Bearish ascending channelThe stock has formed a ascending channel and breakdown from the channel expecting down side and also formation of head and shoulder pattern
Disclaimer: Please consult your financial advisor,
Investment/Trading in the securities market is subject to market risk, We are not responsible for your profit or loss
