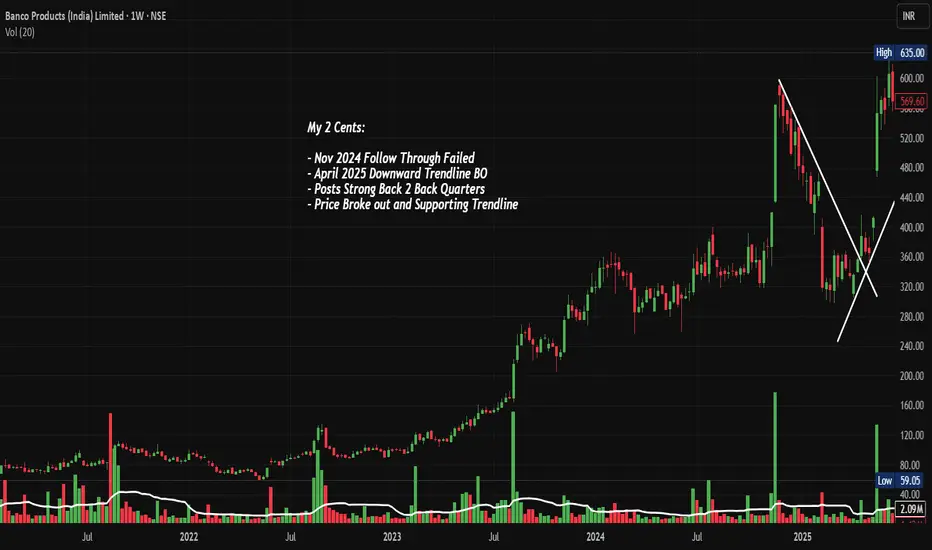
BANCOINDIA: BO after Consolidation, Chart of the WeekBanco Products Broke Out From a Consolidation, Continuing Its Massive Bull Run. Let's analyse in "Chart of the Week"
As per the Latest SEBI Mandate, this isn't a Trading/Investment RECOMMENDATION nor for Educational Purposes; it is just for Informational purposes only. The chart data used is 3 Months old, as Showing Live Chart Data is not allowed according to the New SEBI Mandate.
Disclaimer: "I am not a SEBI REGISTERED RESEARCH ANALYST AND INVESTMENT ADVISER."
This analysis is intended solely for informational purposes and should not be interpreted as financial advice. It is advisable to consult a qualified financial advisor or conduct thorough research before making investment decisions.
Price Action Analysis:
- Banco Products has completed a consolidation phase
- The stock has demonstrated exceptional momentum with a breakout above the ₹400 levels in April 2024
- Current trading price of ₹835.60 represents a gain of over 100% from the breakout point
- Price action shows strong institutional accumulation with increasing volumes during upward moves
Volume Spread Analysis
- Volume spikes are clearly visible during key breakout moments, particularly in Q2 2024
- The highest volume bars (green) coincide with price advances, indicating genuine buying interest
- Recent volume of 36.75M shares traded shows sustained institutional participation
- Volume patterns suggest smart money accumulation rather than retail speculation
Key Technical Levels:
Base Formation:
- Multi-year base formed between ₹100-400 levels from 2022 to early 2024
- This represents a classic cup and handle pattern on the weekly timeframe
- The base provided strong support and allowed for institutional accumulation
- Depth of base (approximately 18 months) suggests a strong foundation for future moves
Support Levels:
- Primary Support: ₹650-680 (previous resistance turned support)
- Secondary Support: ₹550-580 (50% retracement of recent rally)
- Major Support: ₹400-420 (breakout zone)
- Ultimate Support: ₹300 (top of multi-year base)
Resistance Levels:
- Immediate Resistance: ₹850-870 (current highs)
- Next Resistance: ₹950-1000 (psychological round number)
- Extended Resistance: ₹1200-1250 (measured move from base)
Position Sizing:
- Allocate a maximum of 3-5% of the portfolio to a single stock
- Use the pyramiding approach: 50% on initial entry, 25% on confirmation, 25% on extension
- Risk per trade should not exceed 2% of total capital
Risk Management Rules:
- Honour stop-losses strictly without emotional interference
- Book partial profits at predetermined levels
- Reduce position size if the stock shows signs of distribution
- Monitor sector rotation and overall market conditions
Sectoral and Fundamental Backdrop:
Auto Components Sector Overview:
- India's auto component industry is driving macroeconomic growth, with the market estimated to grow by USD 259.03 billion from 2025 to 2029 at a CAGR of 37%
- The auto components sector achieved 32.8% growth in FY24, with optimism for continued strong performance
- Export revenues could soar to $100 billion by 2030 from $21 billion in 2024, at a 30% CAGR
Fundamental Strengths of Banco Products:
- Market Cap of ₹11,952 crores with revenue of ₹3,379 crores and profit of ₹433 crores
- Leading manufacturer and exporter of automotive and industrial gaskets, heat shields, and sealing solutions since 1961
- Promoter holding at 67.88% shows strong management confidence
Growth Catalysts:
- Expanding electric vehicle segment creating new opportunities
- Sector attracted ₹2,45,771 crore FDI between April 2000 and December 2024
- Export potential with global OEM partnerships
- Various Indian auto component manufacturers are entering joint ventures with foreign companies for domestic production
Risks and Challenges:
- Commodity price fluctuations affecting margins
- Global economic slowdown impacting export demand
- Competition from Chinese manufacturers
- Trading at 9.17 times book value indicates a premium valuation
Market Outlook:
Short-term Outlook (1-3 months):
- Expect consolidation in the ₹750-870 range
- Watch any dip below ₹700
- Watch for a breakout above ₹870 for the next leg up
Medium-term Outlook (3-12 months):
- Sustained institutional interest expected
- Earnings growth should support price appreciation
Long-term Outlook (1-3 years):
- Export opportunities provide additional upside
- EV transition could create new revenue streams
- Sector leadership position makes it a preferred play in the auto components space
Full Coverage on my Newsletter this Week
Keep in the Watchlist and DOYR.
NO RECO. For Buy/Sell.
📌Thank you for exploring my idea! I hope you found it valuable.
🙏FOLLOW for more
👍BOOST if you found it useful.
✍️COMMENT below with your views.
Meanwhile, check out my other stock ideas on the right side until this trade is activated. I would love your feedback.
As per the Latest SEBI Mandate, this isn't a Trading/Investment RECOMMENDATION nor for Educational Purposes; it is just for Informational purposes only. The chart data used is 3 Months old, as Showing Live Chart Data is not allowed according to the New SEBI Mandate.
Disclaimer: "I am not a SEBI REGISTERED RESEARCH ANALYST AND INVESTMENT ADVISER."
This analysis is intended solely for informational purposes and should not be interpreted as financial advice. It is advisable to consult a qualified financial advisor or conduct thorough research before making investment decisions.
Breakout!
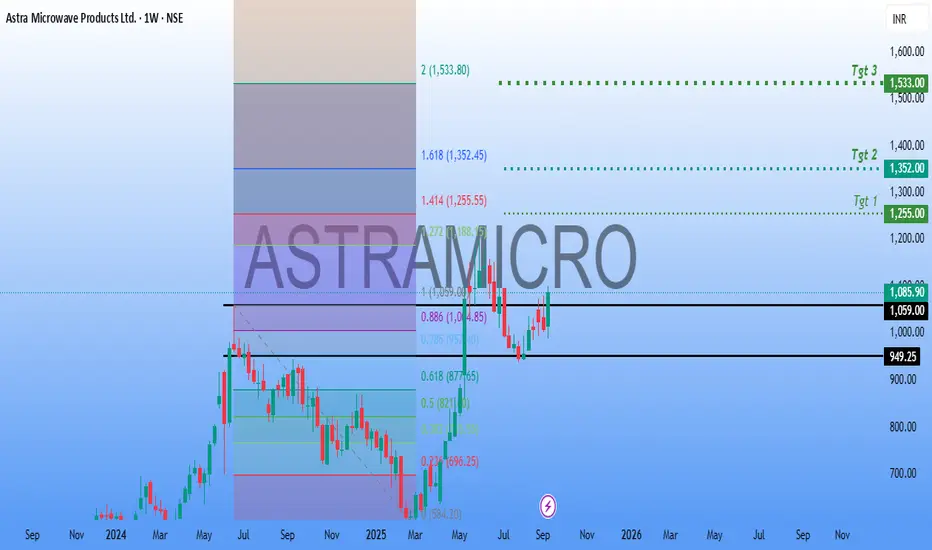
ASTRAMICROAnother #Defense #Stock in focus.
#ASTRAMICRO has a strong Technical Structure. Made a neat #breakout and consolidating at the Breakout levels.
Neat #Buyondips stock for #Short to #Longterm #Investment.
Targets in Chart.
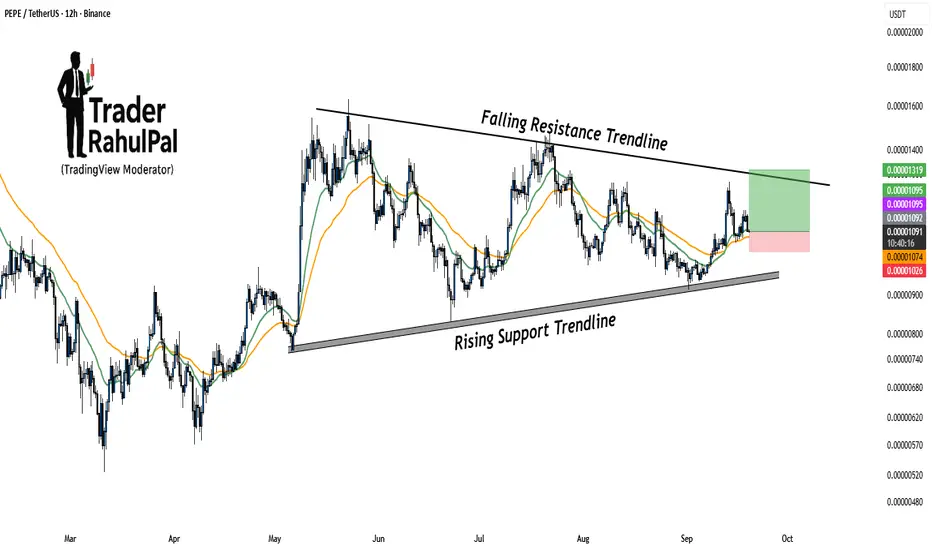
PEPE Getting Ready for a Big Move – Breakout Loading!PEPE is trading within a well-structured range, bounded by a rising support trendline and a falling resistance trendline . This setup indicates that the price is getting squeezed, and a decisive breakout move may be coming soon.
Currently, the price is holding above key moving averages, which adds strength to the bullish bias. As long as the rising support trendline remains intact, buyers will continue to defend dips. A breakout above the falling resistance could trigger a sharp move higher, targeting the next resistance levels near 0.00001319 .
On the downside, if price fails to hold above the rising support, we may see a deeper pullback toward 0.00001074–0.00001026 levels. Traders should closely watch how PEPE reacts near the falling resistance line in the coming sessions.
Disclaimer: This analysis is for educational purposes only and should not be taken as financial advice. Please do your own research or consult your financial advisor before investing.
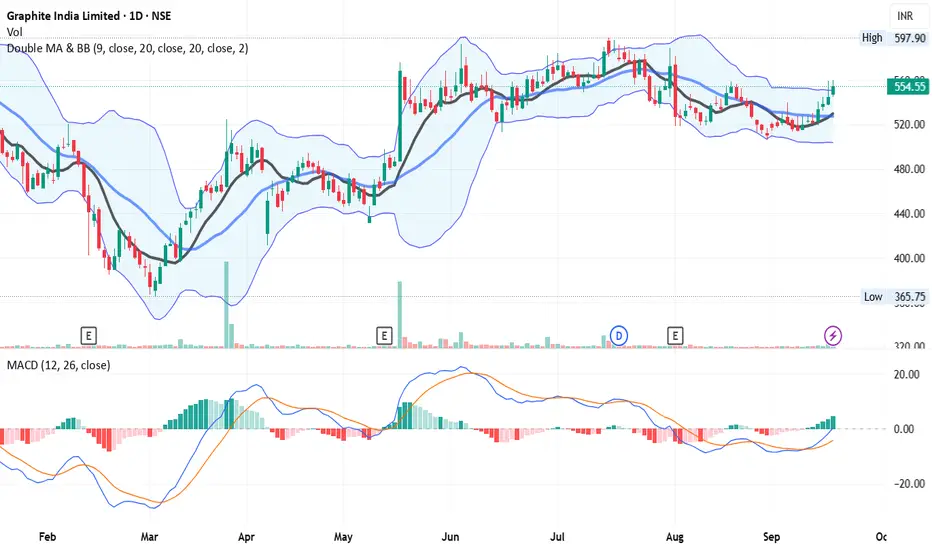
Breakout - Looks Good On Chart - GRAPHITE📊 Script: GRAPHITE
📊 Industry: Industrial Products (Electrodes & Refractories)
Key highlights: 💡⚡
📈 Script is trading at upper band of BB.
📈 MACD is giving crossover .
📈 Crossover in Double Moving Averages.
📈 Right now RSI is around 63.
📈 One can go for Swing Trade.
📈 In Monthly Chart It Script is forming Symmetrical triangle and about to give breakout, we can see good rally in future.
⏱️ C.M.P 📑💰- 555
🟢 Target 🎯🏆 - 578 / 597
⚠️ Stoploss ☠️🚫 - 539
⚠️ Important: Always maintain your Risk & Reward Ratio.
✅Like and follow to never miss a new idea!✅
Disclaimer: I am not SEBI Registered Advisor. My posts are purely for training and educational purposes.
Eat🍜 Sleep😴 TradingView📈 Repeat 🔁
Happy learning with trading. Cheers!🥂
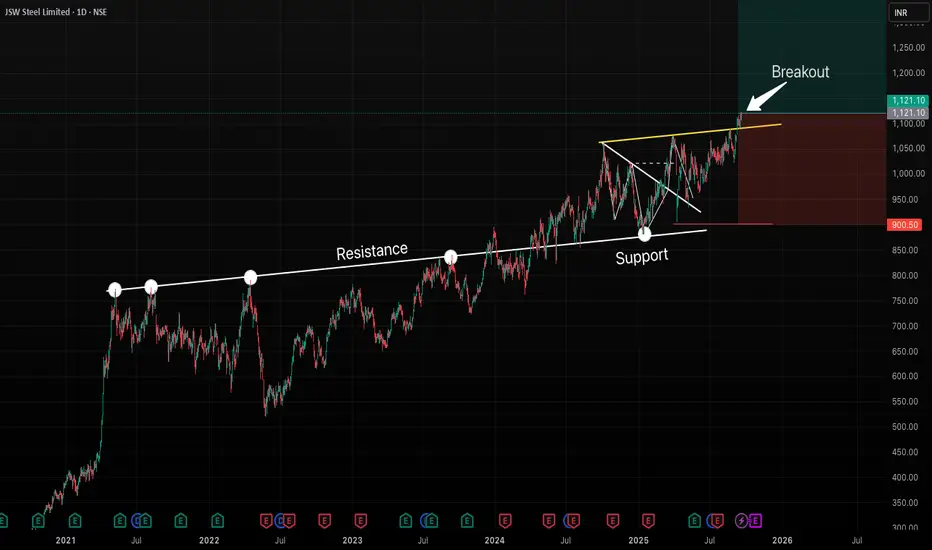
JSWSTEEL - Major Breakout After Long ConsolidationFrom May 2021 to April 2024, JSW Steel consistently faced resistance from the same trendline, rejecting multiple times.
In April 2024, price finally broke out above this resistance zone. After the breakout, the stock came down for a pullback and perfectly respected the same line, which has now flipped into support.
During this pullback, a minor downtrend was visible, but that too has been broken to the upside, showing a clear shift in momentum.
Now, the stock has given a strong breakout again (as shown in the chart). This indicates that the consolidation phase is over and it's going to give a very good rally in coming weeks/months.
Conclusion:
This looks like a good buying opportunity, both for swing trading and long-term investment, as the price action suggests strength and continuation on the upside.
BUY TODAY SELL TOMORROW for 5%DON’T HAVE TIME TO MANAGE YOUR TRADES?
- Take BTST trades at 3:25 pm every day
- Try to exit by taking 4-7% profit of each trade
- SL can also be maintained as closing below the low of the breakout candle
Now, why do I prefer BTST over swing trades? The primary reason is that I have observed that 90% of the stocks give most of the movement in just 1-2 days and the rest of the time they either consolidate or fall
Resistance Breakout in HERITGFOOD
BUY TODAY SELL TOMORROW for 5%

BUY TODAY SELL TOMORROW for 5%DON’T HAVE TIME TO MANAGE YOUR TRADES?
- Take BTST trades at 3:25 pm every day
- Try to exit by taking 4-7% profit of each trade
- SL can also be maintained as closing below the low of the breakout candle
Now, why do I prefer BTST over swing trades? The primary reason is that I have observed that 90% of the stocks give most of the movement in just 1-2 days and the rest of the time they either consolidate or fall
Resistance Breakout in WELENT
BUY TODAY SELL TOMORROW for 5%

Buy, Sell or Skip? Read Breakouts and VolumesExplore how to judge breakouts using TradingView's bar replay, leveraging 3-month-old charts and price action principles that apply from 5-min to monthly timeframes. Sharpen your technical edge—educational insights only.
Disclaimer: This content is for educational purposes and not financial advice. Always do your own research before making trading decisions.

LT - Technical & Trade Analysis📊 Larsen & Toubro (L&T) – Technical & Trade Analysis
________________________________________
1️. Price Action
L&T has displayed a powerful bullish move, closing at ₹3,667.80 (+2.28%) with a strong green candle on the daily chart. The price has broken above the neckline at 3,649, which coincides with the 0.786 Fibonacci retracement level, confirming a bullish reversal from recent lows. With this breakout, the stock is now well-placed to test higher levels at ₹3,731, ₹3,802, and eventually ₹3,931, while key support zones remain intact near ₹3,615 – ₹3,535. This price action clearly indicates a shift in momentum from weakness to strength.
Key Levels:
🔴 Resistance: 3696.83 | 3725.87 | 3777.73
🟢 Support: 3615.93 | 3564.07 | 3535.03
________________________________________
2️. Volume Analysis
The bullish breakout is strongly validated by volume data. On the breakout day, L&T recorded a traded volume of 2,928,060 shares, which is more than 2.38 times its 20-day average volume (1,376,896 shares). Such a significant spike in activity signals institutional buying and strong market participation, a hallmark of reliable breakouts. A VolX reading of 2.38 highlights that the move is not a random uptick but a surge backed by heavy accumulation, adding conviction to the ongoing rally.
________________________________________
3️. Technical Indicators
The technical setup offers multiple confirmations for the bullish bias. The yellow-tagged highlights show that the stock has given an RSI breakout, MACD crossover, Bollinger Band breakout, bullish VWAP signal, and a BB squeeze release, all pointing towards the start of a momentum expansion phase. Additionally, the multi-timeframe indicator table on the top right reinforces this view: Stochastic and CCI are bullish across daily and weekly timeframes, while the MACD is bullish on daily and weekly but still bearish on the monthly, hinting at some caution for long-term investors. Meanwhile, RSI at 61 signals healthy strength without yet entering overbought territory. Together, these indicators align to support the short-term bullish momentum in L&T.
________________________________________
4. Latest Update
Larsen & Toubro (L&T) has been in the spotlight recently with a series of significant developments. The company’s Heavy Civil Infrastructure vertical secured a “significant” order worth ₹1,000–2,500 crore from NPCIL for the Kudankulam Nuclear Power Project (Units 5 & 6) in Tamil Nadu, while it also bagged a major contract from NHSRCL to construct 156 km of ballastless track for the Mumbai–Ahmedabad bullet train corridor. On the flip side, L&T has expressed its intent to exit the Hyderabad Metro Phase I operations citing financial and operational challenges and confirmed it will not participate in the Phase II expansion. Financially, the company posted nearly 30% YoY profit growth in Q1FY26, supported by strong execution and a robust order book, further boosted by these fresh wins. Meanwhile, Chairman S. N. Subrahmanyan highlighted long-term succession planning and clarified remarks on work culture that recently drew public debate.
________________________________________5. Investment Outlook
📈 Bullish Case – Why L&T could go up
Breakout above neckline with volume confirmation
RSI & MACD both turning positive on Daily
Strong support zone at 3615–3560 ensures limited downside
Sectoral rotation into infra/engineering plays could fuel upside
📉 Bearish Case – Potential downside risks
Heavy resistance around ₹3,731–₹3,777 (previous supply zone)
If it fails to hold above ₹3,649, profit booking may drag it back to ₹3,585 / ₹3,535
Macro headwinds (interest rate or project delays) could stall the momentum
⚡ Momentum Case – Short-term Trading Edge
Current move shows "Buy Today – Sell Tomorrow" setup
Entry @ ₹3,674, SL @ ₹3,590.44, Target 1: ₹3,757.56, Target 2: ₹3,841.12
Risk Reward is favorable, supported by strong bullish volume
________________________________________
📅 Short-term vs Long-term Perspective
Short-Term (Swing Trade): Strong bullish case, momentum intact, low risk with clear entry/SL/targets.
Medium-Term (1–3 months): Stock can test ₹3,900–₹4,000 zone if momentum sustains.
Long-Term: Monthly MACD still bearish; investors should add gradually only above ₹3,800+ confirmation.
________________________________________
📝 STWP Trade Analysis
📊 Daily Closing Basis Trade
Entry 3,674, SL 3,590.44, T1 3,757.56 (R:R 1:1), T2 3,841.12 (R:R 1:2).
📊 Swing Trade Setup
Entry 3,674, SL 3,545.40, T1 3,802.60 (R:R 1:1), T2 3,931.20 (R:R 1:2).
Pullback level for Intraday Traders: 3643
Pullback level for swing Traders: 3585
________________________________________
Final Outlook
Momentum: Strong | Trend: Bullish | Risk: Low | Volume: High
________________________________________
💡 Learning Note
This setup demonstrates the power of combining price action, Fibonacci levels, and volume confirmation. A bullish breakout above the neckline with heavy volume plus indicator alignment is one of the most reliable swing trade setups. Double Bottom breakouts with neckline retests + volume confirmation are among the highest probability setups in technical trading
________________________________________
📈 Chart Pattern Analysis
L&T on the daily timeframe has given a Double Bottom Pattern breakout, a classic bullish reversal setup. The two bottoms were formed near the 3,535–3,560 zone, showing strong demand absorption at that level. The neckline breakout came at 3,649, confirmed with a big green candle and 2.38× average volume, which validates institutional participation. This pattern indicates that sellers failed to push the stock lower twice, and buyers have now taken control, opening the path for higher targets. Based on the pattern projection, the upside potential extends towards 3,802 → 3,931, aligning with the Fibonacci extension levels.
⚠️ Disclaimer – Please Read Carefully
The information shared here is meant purely for learning and awareness. It is not a buy or sell recommendation and should not be taken as investment advice. I am not a SEBI-registered investment advisor, and all views expressed are based on personal study, chart patterns, and publicly available market data.
Trading — whether in stocks or options — carries risk. Markets can move unexpectedly, and losses can sometimes exceed the money you have invested. Past performance or past setups do not guarantee future results.
If you are a beginner, treat this as a guide to understand how the market works — practice on paper trades before risking real money. If you are experienced, always assess your own risk, position sizing, and strategy suitability before entering trades.
Consult a SEBI-registered financial advisor before making any real trading decision. By engaging with this content, you acknowledge full responsibility for your trades and investments.
💬 Found this useful?
🔼 Give this post a Boost to help more traders discover clean, structured learning.
✍️ Drop your thoughts, questions, or setups in the comments — let’s grow together!
🔁 Share with fellow traders and beginners to spread awareness.
👉 “If you liked this breakdown, follow for more clean, structured setups with discipline at the core.”
🚀 Stay Calm. Stay Clean. Trade With Patience.
Trade Smart | Learn Zones | Be Self-Reliant 📊

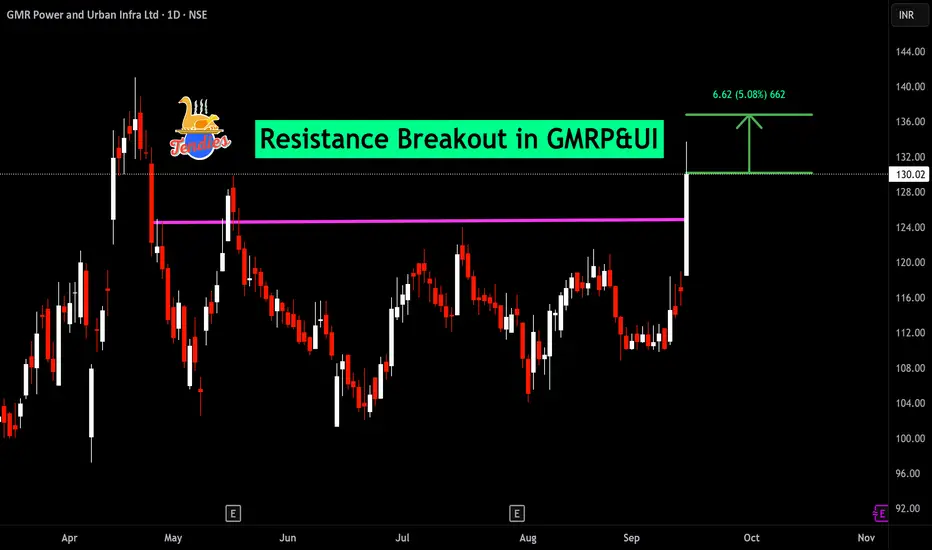
BUY TODAY SELL TOMORROW for 5%DON’T HAVE TIME TO MANAGE YOUR TRADES?
- Take BTST trades at 3:25 pm every day
- Try to exit by taking 4-7% profit of each trade
- SL can also be maintained as closing below the low of the breakout candle
Now, why do I prefer BTST over swing trades? The primary reason is that I have observed that 90% of the stocks give most of the movement in just 1-2 days and the rest of the time they either consolidate or fall
Resistance Breakout in GMRP&UI
BUY TODAY SELL TOMORROW for 5%
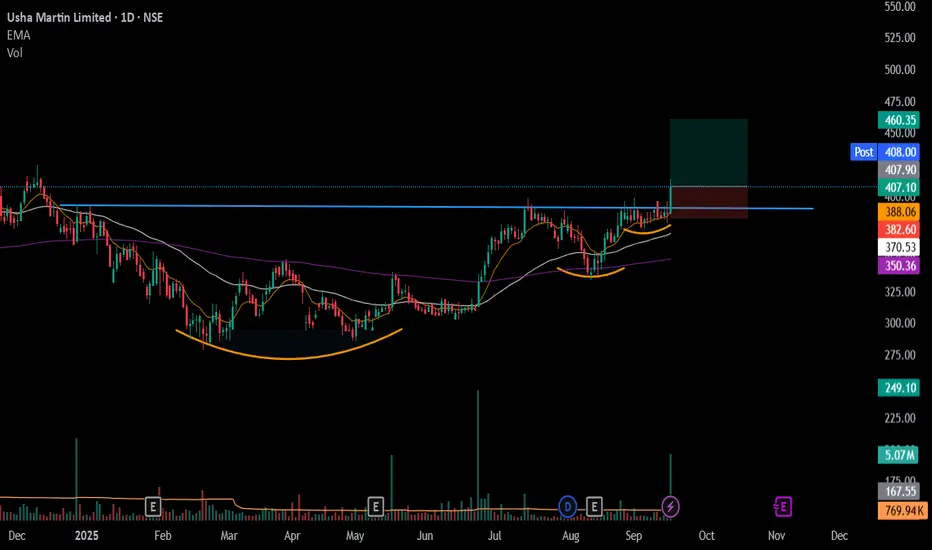
#USHAMART - VCP BreakOut in Daily Time Frame Script: USHAMART
Key highlights: 💡⚡
📈 VCP BreakOut in Daily Time Frame
📈 Price consolidated near Resistance before BO
📈 Volume spike during Breakout
📈 MACD Crossover
📈 Stock is near ATH
📈 Can go for a swing trade
BUY ONLY ABOVE 410 DCB
⏱️ C.M.P 📑💰- 407
🟢 Target 🎯🏆 – 12.90%
⚠️ Stoploss ☠️🚫 – 6.20%
⚠️ Important: Market conditions are Okish, Position size 50% per Trade. Protect Capital Always
⚠️ Important: Always Exit the trade before any Event.
⚠️ Important: Always maintain your Risk:Reward Ratio as 1:2, with this RR, you only need a 33% win rate to Breakeven.
✅Like and follow to never miss a new idea!✅
Disclaimer: I am not SEBI Registered Advisor. My posts are purely for training and educational purposes.
Eat🍜 Sleep😴 TradingView📈 Repeat 🔁
Happy learning with MMT. Cheers!🥂
Bajaj Housing finance trendline breakout soonBajaj Housing fin, gonna give a breakout soon, it is around it’s support and is suppose to give a long trend line breakout with 10% upside in short term
Buy around - 115-117
Target - 128
Duration - 1-2 months

Ravindra energy stage 1 breakoutRavindra energy stage 1 breakout
Entry 166-173
SL 153
Only for journaling, not for a trading/investing.
This post is for my personal use.
Note : only for learning, not a trading recommendation. i am posting as a trading journal before and after breakout.

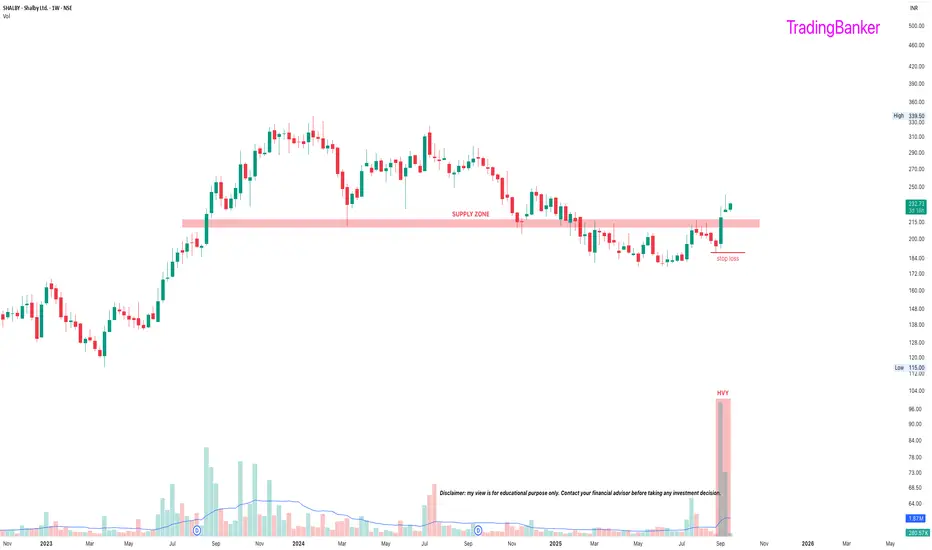
SHALBY: a probable longPros
-hospitals are a money minting machine attracting institutions (FII stake ⬆️)
-ARPOB (average revenue per occupied bed, one of the core metrics in hospitals)⬆️
-positive management commentary. for eg, aiming to improve profitability by reducing low margin schemes and focusssing on profitable schemes
-highest ever sales
-expanding through acquisitions, would eventually bring in the highest ever profits
-highest volumes of the year (week)
Cons
-SL needs risk management
-receivables > 6M = 20% of quarterly turnover (although some are from the government, they are still overdue)
Disc: Invested
BUY TODAY SELL TOMORROW for 5%DON’T HAVE TIME TO MANAGE YOUR TRADES?
- Take BTST trades at 3:25 pm every day
- Try to exit by taking 4-7% profit of each trade
- SL can also be maintained as closing below the low of the breakout candle
Now, why do I prefer BTST over swing trades? The primary reason is that I have observed that 90% of the stocks give most of the movement in just 1-2 days and the rest of the time they either consolidate or fall
Round Bottom Breakout in GPIL
BUY TODAY SELL TOMORROW for 5%

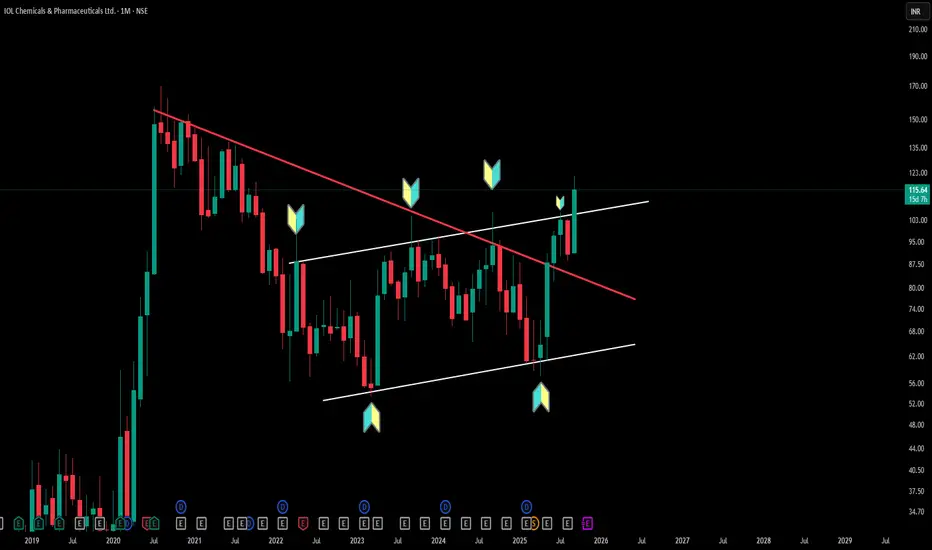
Multi-Pattern Insights: Triangle & Channel Structures (Timeframe: Monthly)
IOLCP's monthly chart perfectly demonstrates how triangle patterns (converging trendlines creating compression) can coexist with parallel channel patterns (equidistant support/resistance lines). Triangle formations indicate price consolidation with diminishing volatility, while parallel channels show consistent bounce zones between defined boundaries.
This multi-timeframe view reveals how experienced chartists identify multiple technical structures within a single timeframe—enhancing pattern recognition skills. Understanding these foundational concepts helps distinguish between different consolidation types and their structural characteristics.
Disclaimer: This analysis is for educational purposes only and does not constitute investment advice. Always conduct your own research before making any trading decisions.
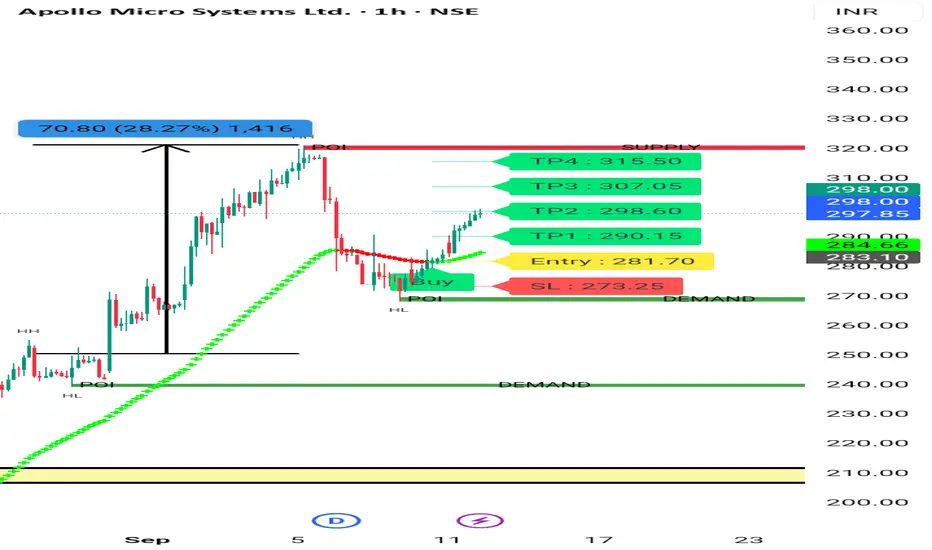
Apollo Micro System Again Upmove Apollo Micro Systems Earlier given near 250. Now Gain it's going Up after Taking Retracement. It's good sign. We can Enter at Cmp With 3 -5 % Stoploss.
It's in High Momentum.
Want to Learn more - how to Catch Such Stocks. Visit my Tradingview Profile .
Entry near 300 tgt 320 - 330 - 350 .
SL 5%
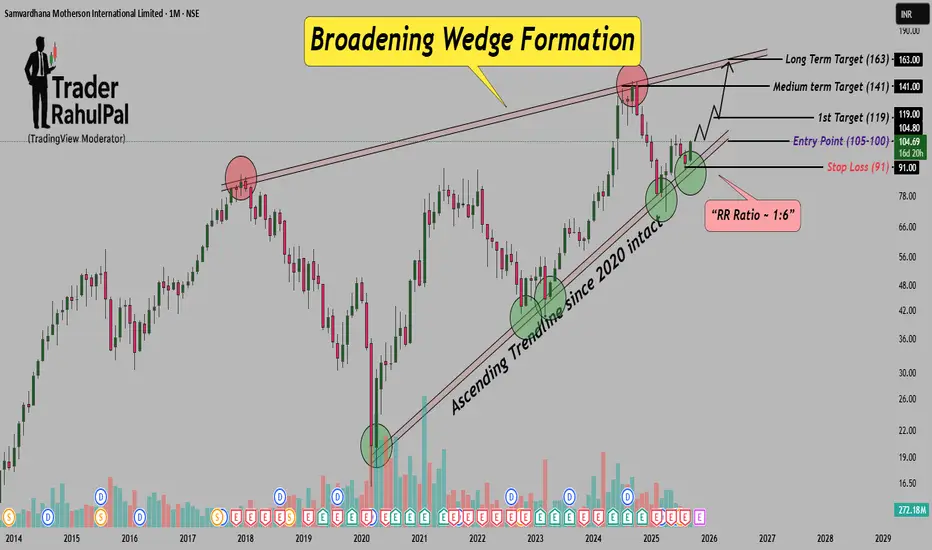
Motherson forming Broadening Wedge, Trendline support since 2020Hello Traders! Samvardhana Motherson – Broadening Wedge Breakout with Ascending Trendline Support
I hope you all are doing good in life and in your trading journey as well. Today I have brought a stock which is showing a dhamaka setup on the monthly chart – Samvardhana Motherson International . The stock is trading inside a Broadening Wedge Formation and respecting a strong ascending trendline since 2020 . Recently, it again bounced from the support zone near ₹91, which clearly shows demand and buyers’ confidence at lower levels.
The ideal entry zone lies between ₹100–₹105 with a protective Stop Loss at ₹91 . On the upside, the first hurdle is at ₹119, and once that is crossed, the stock may head towards medium-term target of ₹141 and long-term target of ₹163 . Rising volumes also indicate accumulation, and a sustained breakout above ₹119 could trigger a fresh multi-month rally.
Disclaimer: This analysis is for educational purposes only and should not be taken as financial advice. Please do your own research or consult your financial advisor before investing.
Analysis By @TraderRahulPal (TradingView Moderator) | More analysis & educational content on my profile
👉 If you found this helpful, don’t forget to like and follow for regular updates.
Indian Metals & Ferro Alloys Ltd - Breakout Setup, Move is ON...#IMFA trading above Resistance of 640
Next Resistance is at 1008
Support is at 463
Here are previous charts:
Chart is self explanatory. Levels of breakout, possible up-moves (where stock may find resistances) and support (close below which, setup will be invalidated) are clearly defined.
Disclaimer: This is for demonstration and educational purpose only. This is not buying or selling recommendations. I am not SEBI registered. Please consult your financial advisor before taking any trade.

Zota Healthcare Higher High Pattern Zota healthcare moving Up in a pattern . It's bullish Since many Months. You can Study Chart of last 2 Year. It's moving up in Pattern with Retracement. So it's very good.
You can make 5 -10% Easily in this Stocks. Keep SL 5%
It may be in Consolidation before moving up as u see same happened in last some days.
But it may move up with volume.
Visit my Tradingview Profile for more information.
Consult your financial advisor before making any position in stock market.

Buy,Retest or Wait? Backtesting Charts with Bar Replay!Using TradingView’s Bar Replay, I break down an old chart and reveal the exact logic behind whether it was a buy, sell,retest or skip trade. Perfect for traders who want to sharpen entry-decisions with real market context.

BUY TODAY SELL TOMORROW for 5%DON’T HAVE TIME TO MANAGE YOUR TRADES?
- Take BTST trades at 3:25 pm every day
- Try to exit by taking 4-7% profit of each trade
- SL can also be maintained as closing below the low of the breakout candle
Now, why do I prefer BTST over swing trades? The primary reason is that I have observed that 90% of the stocks give most of the movement in just 1-2 days and the rest of the time they either consolidate or fall
Trendline Breakout in SMSPHARMA
BUY TODAY SELL TOMORROW for 5%

BUY TODAY SELL TOMORROW for 5%DON’T HAVE TIME TO MANAGE YOUR TRADES?
- Take BTST trades at 3:25 pm every day
- Try to exit by taking 4-7% profit of each trade
- SL can also be maintained as closing below the low of the breakout candle
Now, why do I prefer BTST over swing trades? The primary reason is that I have observed that 90% of the stocks give most of the movement in just 1-2 days and the rest of the time they either consolidate or fall
Round Bottom Breakout in INDRAMEDCO
BUY TODAY SELL TOMORROW for 5%
