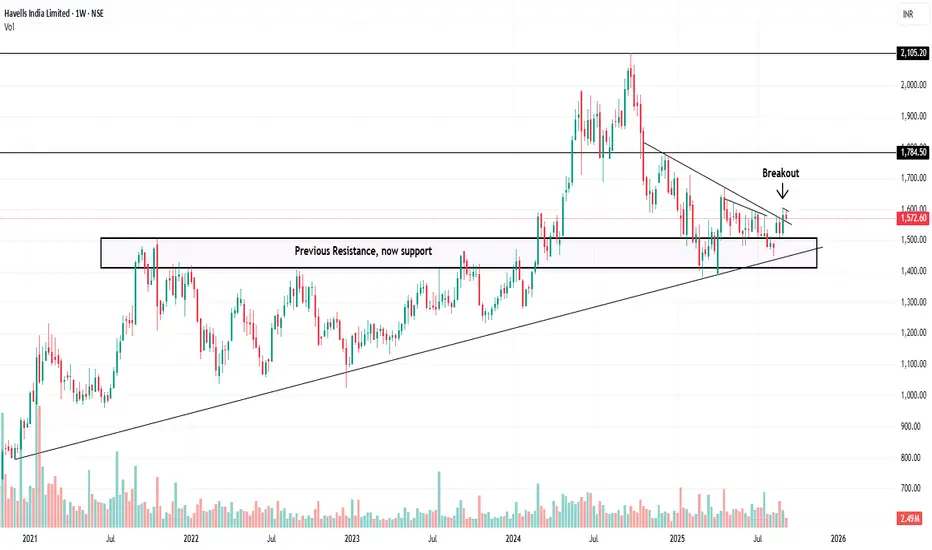
BUY TODAY SELL TOMORROW for 5%DON’T HAVE TIME TO MANAGE YOUR TRADES?
- Take BTST trades at 3:25 pm every day
- Try to exit by taking 4-7% profit of each trade
- SL can also be maintained as closing below the low of the breakout candle
Now, why do I prefer BTST over swing trades? The primary reason is that I have observed that 90% of the stocks give most of the movement in just 1-2 days and the rest of the time they either consolidate or fall
Trendline Breakout in LATENTVIEW
BUY TODAY SELL TOMORROW for 5%
Breakout!

XAUUSD: The Bullish Pennant That Could Trigger the Next RallyHello everyone, what is your take on XAUUSD right now?
The 2 hour chart is becoming quite interesting. Price action is shaping a clean bullish pennant, a pattern that often suggests the market is building pressure for its next major move. After completing its corrective pullback, XAUUSD is beginning to show signs that buyers may be preparing to re-enter and push the trend higher again.
If momentum returns, my outlook targets a break above 4265, followed by an extension toward 4430. This zone aligns perfectly with the Fibonacci 1.618 projection, which adds strong confluence to the bullish scenario.
Share your thoughts and your targets in the comments. I would love to hear how you are interpreting this setup.

Simple Trend Analysis with BreakoutDisclaimer: This is just an a price action analysis of stock Tata Motors. Don't consider this as an stock tip or advice. Invest/Trade at your own risk.
How to Add and Select Weekly time frame stocks on Trading view I make educational content videos for swing / positional trading

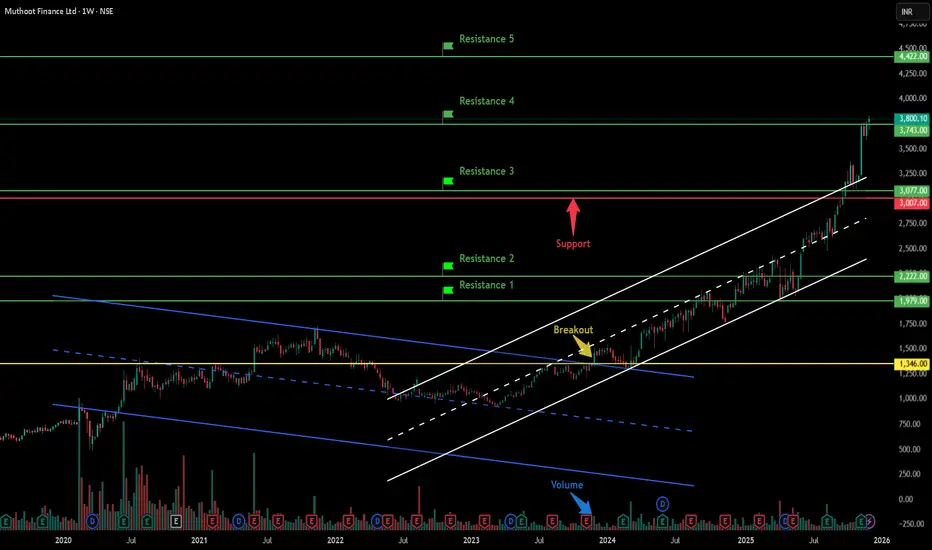
Muthoot Finance Limited - Breakout Setup, Move is ON...#MUTHOOTFIN trading above Resistance of 3743
Next Resistance is at 4422
Support is at 3007
Here are previous charts:
Chart is self explanatory. Levels of breakout, possible up-moves (where stock may find resistances) and support (close below which, setup will be invalidated) are clearly defined.
Disclaimer: This is for demonstration and educational purpose only. This is not buying or selling recommendations. I am not SEBI registered. Please consult your financial advisor before taking any trade.
BTC Breakdown Confirmed – Here’s Where BTC Could Surge NextBTC Breakdown Confirmed – Here’s Where BTC Could Surge Next
1️⃣ Long-Term Trendline Breakdown Confirmed
🔹 BTC has decisively broken the multi-year ascending trendline supporting price since Nov 2022.
🔹 The Breakdown + Retest at ~$104k-$108k confirms bearish structure ✅.
🔹 Retest failed in Oct 2025, confirming sellers are in control.
2️⃣ Fibonacci Levels Highlight Strong Demand
🔹 Price is now hovering between 0 Fib ($125,647) and 0.382 Fib ($56,494).
🔹 Measured move Targets: Strong Demand Zone $34,477 - $56,494 (0.618 - 0.382 Fib)
🔹 This is the accumulation zone for long-term positions, historically providing strong bounce potential.
3️⃣ Critical Support / Resistance Zones
🔹 Immediate Support: $85k-$87k (psychological)
Major Support:
🔹 $56,494 (0.382 Fib, upper demand)
🔹 $44,133 (0.5 Fib, middle demand)
🔹 $34,477 (0.618 Fib, “Golden Pocket”, lower demand)
Resistance: Broken trendline now acting as key supply
4️⃣ Potential Scenarios
Bearish (High Probability)
🔹 Continuation down to Strong Demand Zone ($34k-$56k)
🔹 Represents 38-61% retracement from ATH, typical after trendline breakdown + retest
Bullish (Needs Reclaim)
🔹 Reclaim broken trendline (~$95k-$100k)
🔹 Close above $104k = false breakdown, continuation to new highs
Why I’m Watching $56,500 - $34,500 for Longs
🔹 Historical accumulation zone with high probability of a strong bounce
🔹 After breakdown + retest, price often retraces to 0.5 or 0.618 Fib before resuming bull trend
🔹 Perfect long-term entry for those aiming for multi-year BTC upside
BTC may test the $56k-$34k demand zone soon. For long-term holders, this is a prime accumulation area before the next bull cycle. Stay patient and strategic – $1M BTC dreams require discipline, not FOMO.
Guys, don’t judge me: I’m a Bitcoin lover too. I’m just reading what the chart is showing. Even if the short-term looks bearish, I see the setup for a massive long-term move toward $1M 🚀
NFA & DYOR

BUY TODAY SELL TOMORROW for 5%DON’T HAVE TIME TO MANAGE YOUR TRADES?
- Take BTST trades at 3:25 pm every day
- Try to exit by taking 4-7% profit of each trade
- SL can also be maintained as closing below the low of the breakout candle
Now, why do I prefer BTST over swing trades? The primary reason is that I have observed that 90% of the stocks give most of the movement in just 1-2 days and the rest of the time they either consolidate or fall
Cup & Handle Breakout in INFOBEAN
BUY TODAY SELL TOMORROW for 5%

DRAGONFLY LTDDRAGONFLY INC, as per chart view it formed FALLING WEDGE PATTERN and made breakout with entry level $6.88 with EMA crossover. We can expect the Final target to $13.

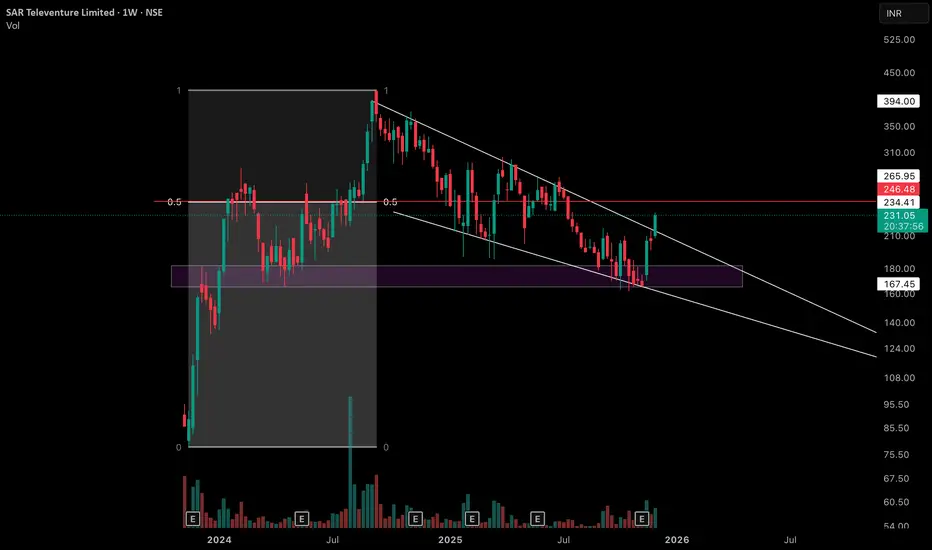
Weekly Equilibrium at Former Supply Zone with 4 observationsObservation 1 - On this weekly chart of SAR Televenture Limited, price has created an interesting equilibrium between the major swing low and the all‑time high swing high, with the 0.5 level highlighted by the red horizontal line as a key mid‑point reference.
Observation 2 - The purple zone marked on the chart was earlier a clear supply / resistance area but has now flipped into a support zone, getting respected multiple times over the past several weeks.
Observation 3 - After printing its all‑time high, price has moved into a sequence of lower highs and lower lows, but each leg has remained relatively controlled instead of showing any one‑sided, sharp liquidation move. This creates a broader consolidation structure where volatility is present yet contained.
Observation 4 - The white lines on the chart represent the upper and lower rejection boundaries of this consolidation channel, and most of the recent candles are developing within these two lines.
Disclaimer: This post is purely for educational and informational purposes, intended to study price structure and market behavior on the weekly timeframe. It is not investment advice or a recommendation to buy or sell any security; traders and investors should do their own research and consult a registered financial professional before making any decisions.
BUY TODAY SELL TOMORROW for 5%DON’T HAVE TIME TO MANAGE YOUR TRADES?
- Take BTST trades at 3:25 pm every day
- Try to exit by taking 4-7% profit of each trade
- SL can also be maintained as closing below the low of the breakout candle
Now, why do I prefer BTST over swing trades? The primary reason is that I have observed that 90% of the stocks give most of the movement in just 1-2 days and the rest of the time they either consolidate or fall
Trendline Breakout in JPOLYINVST
BUY TODAY SELL TOMORROW for 5%

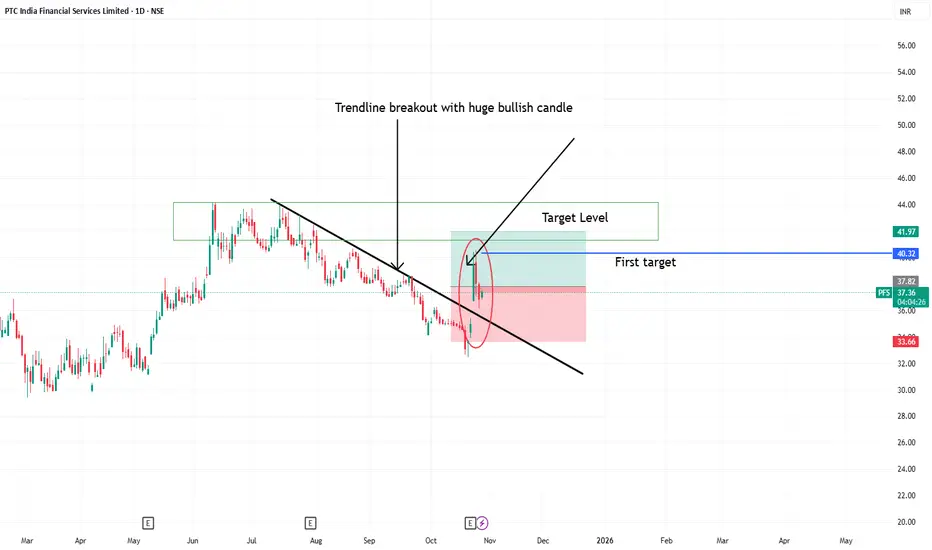
Trendline breakout in PFS 1. Trendline breakout seen in PFS
2. Huge bullish candle broke trendline shows buyers strength
3. stock may give rally and show upward movement upcoming few weeks
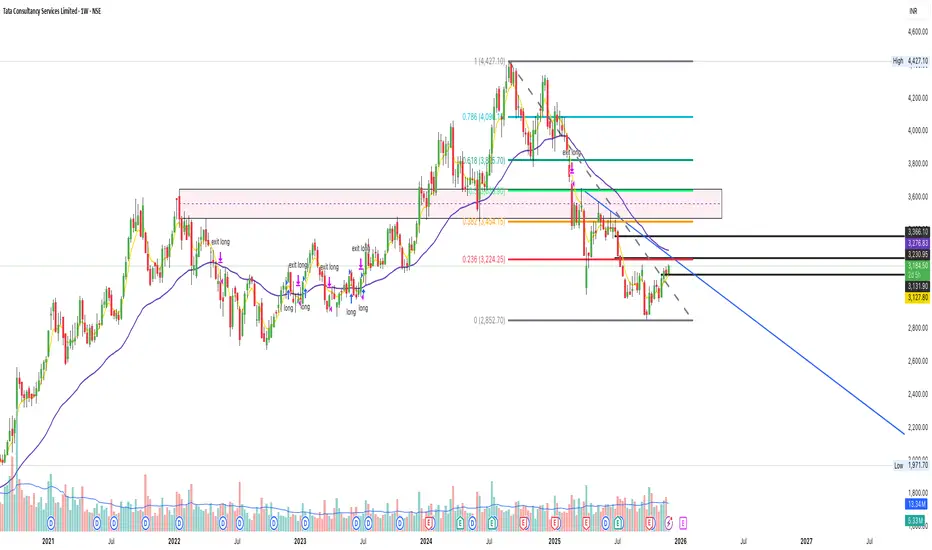
TCS Chart Update – Fibonacci + Breakout LevelsTCS – Retest Breakout Trading Setup with Price Action + Fibonacci Strategy
TCS is approaching a key breakout zone around ₹3,280. A retest entry can offer a high-probability trade setup.
How to Trade This Setup
1️⃣ Breakout Level
₹3,280 is the major resistance zone
Wait for strong breakout candle closing above ₹3,280
2️⃣ Retest Entry
📍 After breakout, price may pull back to ₹3,280–₹3,260
📍 Look for bullish rejection candle (Pin bar / Hammer / Engulfing)
👉 Entry on bullish close after retest
3️⃣ Stop-Loss (Price Action Based)
🛑 SL below ₹3,085 (strong support level)
4️⃣ Targets using Fibonacci
🎯 T1: ₹3,350
🎯 T2: ₹3,400
🎯 T3: ₹3,456 (Fib 38.2%)
Strategy Summary
Element Value
Breakout zone ₹3,280
Retest entry ₹3,280–₹3,260
SL ₹3,085
Targets ₹3,350 / ₹3,400 / ₹3,456
Direction Bullish above breakout
View
Bullish bias if price sustains above ₹3,280.
Retest entry gives the safest low-risk setup. 🚀
BUY TODAY SELL TOMORROW for 5%DON’T HAVE TIME TO MANAGE YOUR TRADES?
- Take BTST trades at 3:25 pm every day
- Try to exit by taking 4-7% profit of each trade
- SL can also be maintained as closing below the low of the breakout candle
Now, why do I prefer BTST over swing trades? The primary reason is that I have observed that 90% of the stocks give most of the movement in just 1-2 days and the rest of the time they either consolidate or fall
Round Bottom Breakout in JSWHL
BUY TODAY SELL TOMORROW for 5%

BUY TODAY SELL TOMORROW for 5%DON’T HAVE TIME TO MANAGE YOUR TRADES?
- Take BTST trades at 3:25 pm every day
- Try to exit by taking 4-7% profit of each trade
- SL can also be maintained as closing below the low of the breakout candle
Now, why do I prefer BTST over swing trades? The primary reason is that I have observed that 90% of the stocks give most of the movement in just 1-2 days and the rest of the time they either consolidate or fall
Resistance Breakout in AUTOAXLES
BUY TODAY SELL TOMORROW for 5%

Lets Create and Backtest a Simple Strategy from literally ZeroI make educational content videos for swing / positional trading .
In this video I will be using 3 months old chart along with one example of how to approach any trade or price action with literally zero lines and zones on screen .

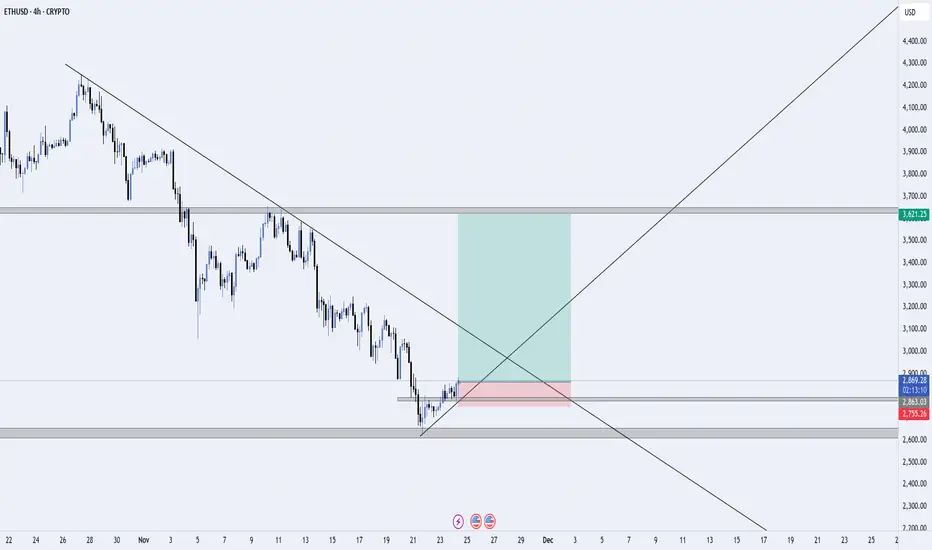
ETH/USD – Trendline Breakout Attempt from Higher-Timeframe DemanETH/USD is reacting strongly from a major 4H demand zone after an extended downtrend. Price has tapped into a high-volume area between $2,760–$2,800, showing the first signs of bullish strength with a clean internal structure shift.
📌 Setup Overview
Price respected a long-term descending trendline, but buyers stepped in strongly at the higher-timeframe demand zone.
A short-term structure break (BOS) suggests a potential reversal beginning to form.
Market is now retesting the broken structure + mini demand zone, where buyers are likely to defend.
🎯 Trade Plan
Entry: After the retest confirmation of the minor demand zone.
Stop-loss: Below the demand area to protect against liquidity sweeps.
Target: The next major supply zone around $3,600, aligning with the larger structure and trendline interaction.
📈 Bias
Bullish short-term — expecting continuation to the upside if price holds above the retest zone.
Structure suggests a potential mid-term trend reversal if buyers maintain control.
❌ Invalidation
Idea becomes invalid if price closes below the demand zone and breaks structure to the downside.
Tight Bullish Coil Above 50% EQ Means what ? Points to be Noted :
-Clear monthly swing low and swing high marked, defining the impulsive leg and its equilibrium zone. ( S1 and S2 )
-Price is consolidating in the upper half of this leg, holding above the 0.5 equilibrium level, showing sustained strength in the higher value area. ( also know as EQ )
-A clean ascending trendline (green) is guiding price from the swing low, with candles respecting it as dynamic support during the pause.
-Within this broader bullish structure, price has formed a tight parallel channel consolidation, indicating controlled pullback rather than distribution. ( white lines marked )
-Nearest major supply aligns with the all-time high, and the highlighted supply box marks the key decision zone where breakout or rejection is most likely.( orange box )
This post is for educational purposes only and is not investment, trading, or financial advice. Always do your own research, assess your risk tolerance, and consult a qualified financial advisor before making any trading decisions.

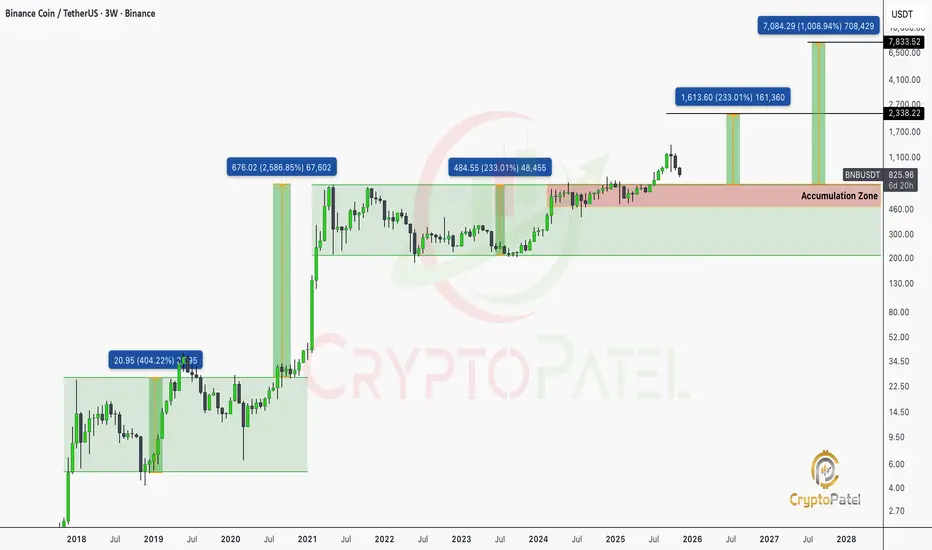
BNB/USDT 3-Week Chart Analysis: Is a Massive Breakout Coming?BNB/USDT 3-Week Chart Analysis: Is a Massive Breakout Coming?
Current Price: $827.05 (down 10.74%)
BNB is currently consolidating in a key Accumulation Zone between $700-$800, signaling institutional accumulation and balance.
Key Levels to Watch
Support Zones:
🔹 $484.55 – Critical demand from 2023 lows
🔹 $676.02 – Former ATH turned support
🔹 $700-$750 – Bottom of current accumulation
Resistance Targets:
🔹 $1,613 – First major upside
🔹 $2,338 – Next intermediate target
🔹 $7,084 – Long-term “moonshot” scenario
Volume & Structure Insights
🔹 2019 Breakout: Started the long-term uptrend
🔹 2021 Bull Run: Peak at $676, classic blow-off top
🔹 2024-2025 Accumulation: Renewed institutional interest
Bearish Risk
🔹 Failure to hold $700 → Retest $484 (-41%)
🔹 Breakdown below $484 → Bullish thesis invalid
NFA & DYOR
BUY TODAY SELL TOMORROW for 5%DON’T HAVE TIME TO MANAGE YOUR TRADES?
- Take BTST trades at 3:25 pm every day
- Try to exit by taking 4-7% profit of each trade
- SL can also be maintained as closing below the low of the breakout candle
Now, why do I prefer BTST over swing trades? The primary reason is that I have observed that 90% of the stocks give most of the movement in just 1-2 days and the rest of the time they either consolidate or fall
Resistance Breakout in EUREKAFORB
BUY TODAY SELL TOMORROW for 5%

HDFC BANK LTD PARALLEL CHANNEL BREAKOUTHDFC BANK was traded in channel from past few years and made a breakout with good volume. Entry price at ₹990, with a STOPLOSS ₹940 and TARGET ₹1,190

XAUUSD is skyrocketing after the Adam & Eve pattern!OANDA:XAUUSD is really interesting right now. The price seems likely to rise further after the formation of the Adam & Eve pattern. With such an easy-to-remember name, the Adam & Eve pattern is one of the most memorable. Below, I’ll explain the reasons and how to easily recognize it.
The Adam pattern is characterized by a sharp drop, followed by a quick recovery, forming a "V" on the chart. High, sharp, and aggressive! You could say it's more "masculine."
On the other hand, the Eve pattern develops more slowly. The price becomes more rounded, forming a wider and smoother base before rising again, creating a shape similar to the letter "U." Softer, more curved, and more "feminine."
Combining these two elements gives us the Adam & Eve pattern, which often signals a potential trend reversal. Especially when accompanied by fundamental analysis or other strong technical indicators.
This pattern will stick in your mind when you connect its shapes to the male and female aspects. A pattern that's truly hard to forget.


Vimta Labs Limited - Breakout Setup, Move is ON...#VIMTALABS trading above Resistance of 607
Next Resistance is at 1113
Support is at 498
Here are previous charts:
Chart is self explanatory. Levels of breakout, possible up-moves (where stock may find resistances) and support (close below which, setup will be invalidated) are clearly defined.
Disclaimer: This is for demonstration and educational purpose only. This is not buying or selling recommendations. I am not SEBI registered. Please consult your financial advisor before taking any trade.
