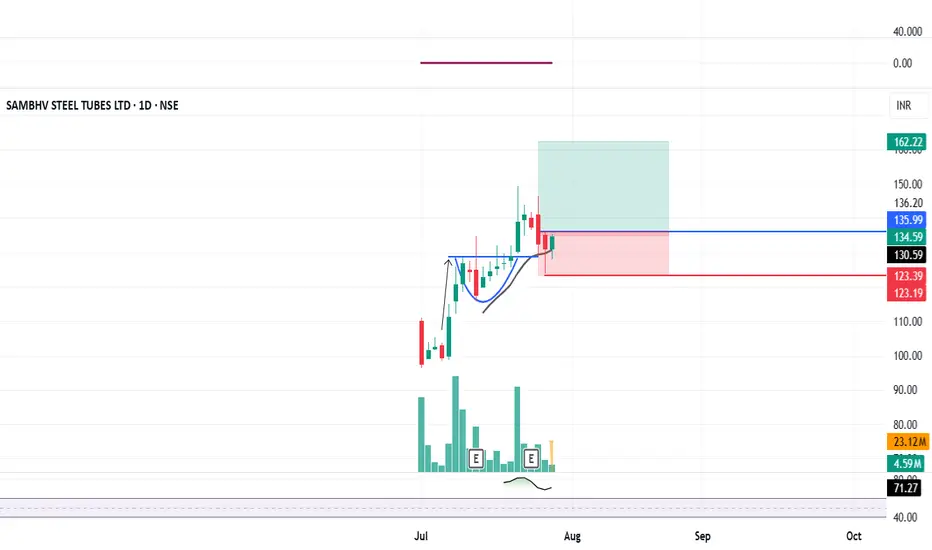
SAMBHV: IPO Base Breakout + Retest done#SAMBHV #ipostock #breakoutstock #trendingstock #swingtrading
SAMBHV : Swing Trading
>> Breakout & Retest done
>> Trending stock
>> Good Strength & Volumes
>> Low Risk High Reward Trade
Swing Traders can lock profits at 10% & Keep Trailing
Pls Comment , Boost and Follow for more such Analysis
Disc : Charts shared are for Learning Purpose and not a Trade recommendation, Consult your Financial advisor or a SEBI Registered Advisor before taking position in it.
Breakout!
PAYTM, BIG BULLISH BREAKOUT HAPPENINGPaytm, one9 communication 1065, has given highest weekly closing in last 30 months. Stock ready for 1250/1320/1450/1600.
Good horizontal trendline resistance taken out at 1020 levels. Volumes are supportive
Trade negates if closed below 940 levels on weekly closing basis. Bigger Stop at 860 levels.

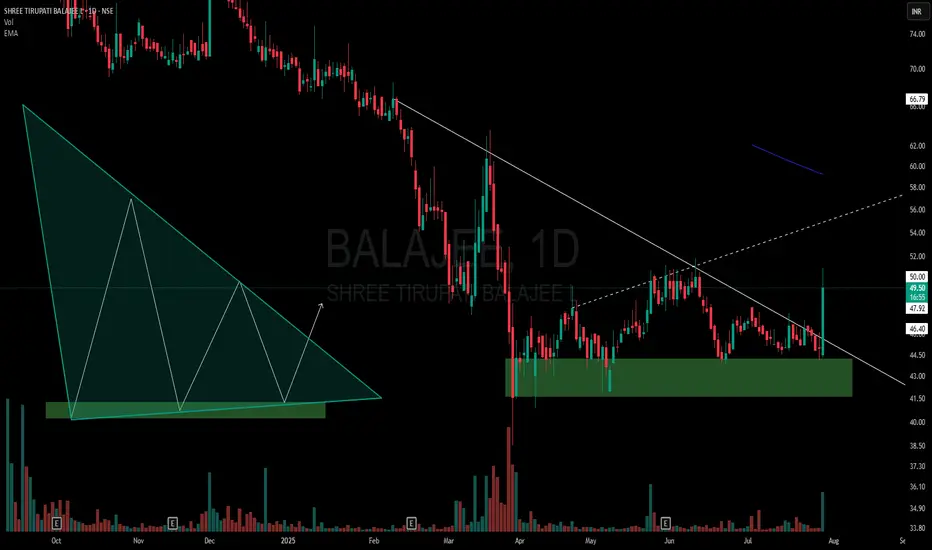
BALAJEE - Descending Triangle Meets Multi-Pattern ConfluenceOn the daily chart of Balajee, price action has formed a descending triangle right at the lower end of the trend:
🔻 Lower highs consistently pressuring horizontal support.
🟩 Price sitting within a clear demand zone, adding significance to the structure.
📊 Volume tapering off through consolidation, a classic triangle trait.
📐 Presence of a hidden counter-trend line (dotted) hinting at a potential broadening formation — showing a rare multi-pattern overlap.
Such setups are important not for predicting price, but for understanding how multiple structures can interact.
⚠️ Purely educational observation — no buy/sell advice.
Gold dives toward 3,320 as Fed decision loomsHello everyone, what are your thoughts on gold prices?
Gold's decline is accelerating, dragging the precious metal down toward the 3,320 USD mark. A stronger U.S. dollar and further developments on the trade front following the U.S.-EU agreement have significantly impacted demand for safe-haven assets.
From a technical perspective, the break below the rising price channel could mark the beginning of a deeper correction. Oscillators on the chart have just started turning negative, suggesting that the path of least resistance for gold is now downward.
Looking ahead, Wednesday’s key FOMC decision—along with the accompanying policy statement and Powell’s press conference—will be closely scrutinized for clues on the Fed’s interest rate cut roadmap.
Additionally, investors will face several important U.S. macroeconomic data releases this week, which will play a vital role in shaping the USD’s trajectory and provide new momentum for XAUUSD.
What do you think about the precious metal? Share your thoughts below!

EUR/USD Under Pressure : Sell or Buy ? The EUR/USD pair remains under mild bearish pressure, hovering around the 1.1700 mark and extending its Thursday downtrend. Meanwhile, the US Dollar (USD) stays firm despite growing optimism over improving US-China relations. However, the ongoing tension between Trump and Powell continues to capture market attention.
In response to these developments, EUR/USD has stalled its previous rally. On the chart, the pair is forming a series of lower highs, moving within a narrowing wedge pattern. The 1.1600 level now emerges as the critical battleground between bulls and bears.
Do you think EUR/USD can successfully defend this support zone? Let us know your thoughts!

Bitcoin rebounds with strength after whale dumpAfter a surprising sell-off triggered by whale pressure, Bitcoin (BTCUSD) has shown impressive internal strength, bouncing quickly from the Fibonacci support zone between 114,488 and 116,571 USD (0.618 – 0.5 levels).
The D1 chart reveals that the bullish structure remains intact, with EMA 34 and EMA 89 acting as solid support levels. The recent "dump" did not alter the overall trend; on the contrary, it created an opportunity for reaccumulation within the price box—serving as a vital base for the next breakout.
A likely scenario is that BTCUSD will continue to move sideways for a few more sessions before targeting the 1.272 Fibonacci extension near the 128,000 USD area. If this plays out, it would be a strong confirmation of the next growth phase for Bitcoin.
Do you believe Bitcoin is ready to break all-time highs and set a new record? Share your thoughts below!

Dual Counter-Trend Zone and Market Structure Shift- This chart highlights a dual counter-trend resistance zone formed by two overlapping CT trendlines (marked in the shaded purple region).
🟡 Yellow Cup – Marks the origin base of the structure (assumed starting shift).
🔴 Red Cup – Establishes a Lower Low Base, still within bearish control.
🟢 Green Cup – Forms a Higher Low Base, showing a market structure change supported by a noticeable volume surge.
- The dotted trendline drawn through the zone acts as a hidden resistance confluence
⚠️ Disclaimer:
This post is non-forecasting in nature. It is not a buy/sell recommendation or financial advice. The chart is shared purely for educational and structural analysis purposes.
Deepak Fertilizers - Cup and Handle ContinuationAs you all can see there is a beautiful cup followed by a handle on the Weekly timeframe.
After the pattern broke out, the stock managed the market sell off pretty well by retesting its previous supply zone (now demand zone) and maintained the sideways trend without spoiling the pattern.
This sudden surge implies that the stock is ready to continue its uptrend.
Talking about fundamentals:
- High Management Efficiency with a high ROCE of 17.10%
- The company has a high Debt to EBITDA ratio of 1.88 times
- Healthy long term growth as Operating profit has grown by an annual rate 40.09%
- Positive results in Dec 24
- OPERATING PROFIT TO INTEREST(Q) Highest at 4.94 times
- NET SALES(HY) At Rs 5,325.74 cr has Grown at 24.53 %
- DEBT-EQUITY RATIO(HY) Lowest at 0.67 times
- With ROCE of 14.4, it has a Fair valuation with a 1.9 Enterprise value to Capital Employed
- The stock is trading at a discount compared to its average historical valuations
- Over the past year, while the stock has generated a return of 106.57%, its profits have risen by 0.5%
- High Institutional Holdings at 20.38%. Their stake has increased by 0.7% over the previous quarter.

Latest Gold Price Update TodayIn the most recent trading session, global gold prices dropped over 31 USD per ounce, closing at 3,337 USD. This sharp decline follows a three-day rally and reflects profit-taking by investors and a shift in capital flow.
Newly released economic indicators show that the U.S. labor market remains strong, with jobless claims falling for the sixth consecutive week — the longest streak since 2022. This helped the U.S. dollar rebound slightly, putting pressure on gold, a non-yielding asset.
At the same time, investor sentiment has tilted toward riskier assets like equities, as trade talks between the U.S., EU, and Japan show positive progress. Stock markets in the U.S. and Europe surged, drawing capital away from gold.
Although expectations remain for a potential Fed rate cut in September, gold faces short-term headwinds. The 3,300 USD zone is now a key level to watch. Traders should look for reversal signals and volume confirmation before considering long entries.
Personal view: USD strength, rising stock markets, and profit-taking are creating a short-term correction for gold. However, in the longer term, there is still upside potential if the Fed signals a policy shift in the coming months.
And you — what’s your take on gold prices today?

GLOBUS SPIRITS, POTENTIAL BIG BREAKOUT STOCKGlobus spirits (W), Buy Globus spirit above 1390 levels, add more above 1440 levels.
Stock has been consolidating from the last 24 months in range of 650 points and looking for breakout.
Potential target is 1800 to 2100
Trade negates if it falls below 1340 levels on weekly closing basis after breakout trade opens. Avoid bigger stops
PAYTM READY FOR BIG BULL RUNPaytm, one9 communication 1065, has given highest weekly closing in last 30 months. Stock ready for 1250/1320/1450/1600/1800
Good horizontal trendline resistance taken out at 1020 levels. Volumes are supportive
Trade negates if closed below 940 levels on weekly closing basis. Bigger stop at 860 levels.

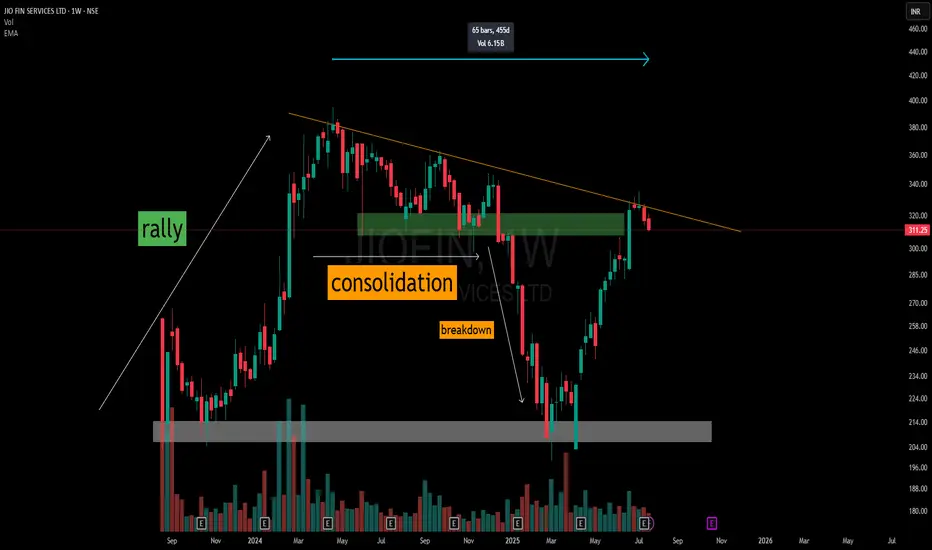
455-Day Counter Trendline | From Breakdown to V-RecoveryThis weekly chart of Jio Fin Services Ltd illustrates a multi-phase price structure over 455 days:
🔹 Initial Rally — Kicks off from a defined accumulation base (grey zone), marking the start of a strong impulse leg.
🔹 Consolidation Phase — Price enters a descending triangle formation just below a historical resistance band.
🔹 Breakdown — Clean breakdown from the triangle pattern sends price sharply downward.
🔹 V-Shaped Recovery — A strong reaction off the original base zone leads to a sharp reversal.
🔹 Back to the 455-Day Counter Trendline — Price now tests the long-standing counter trendline, which has remained intact throughout.
📌 This chart demonstrates how historical price structures—especially well-defined base formations and trendline resistances—continue to act as critical reference points for future price action.
🛠️ No predictions here. Just a structured breakdown of price behavior and major decision zones traders are often drawn to.
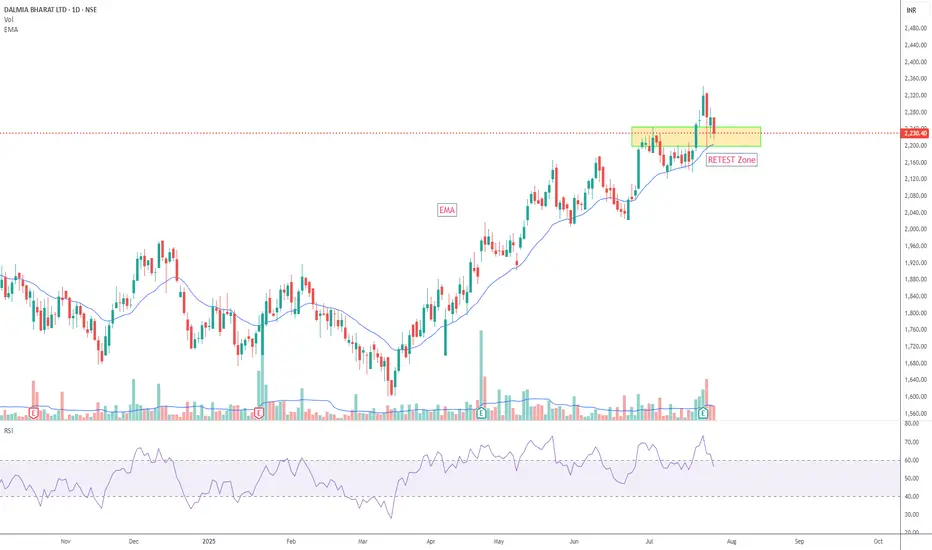
DALBHARAT Retesting Breakout Zone Near 21 EMAThe stock DALBHARAT is currently testing the breakout region between ₹2200–₹2250, which aligns with the 21 EMA — a potential confluence zone.
Traders may observe price action near this level for signs of a bounce. If the retest holds, there could be scope for upward movement toward previous highs.
Note: The risk-reward setup appears favorable based on current chart structure.
Disclaimer
This is a personal technical analysis and not a recommendation to buy or sell any securities. Please do your own research or consult a SEBI-registered investment advisor before making any investment decisions. Trading in financial markets involves risk.
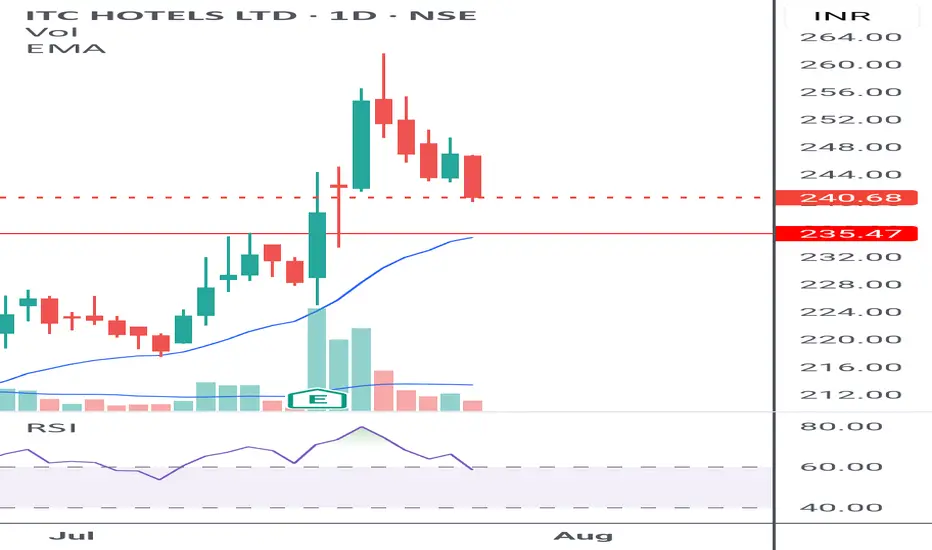
ITCHOTELS at attractive levels, retest ITCHOTELS is retesting the break out level. The results are over and hence no volatility expected.
Currently at attractive risk reward level. View invalid if it closes below 230
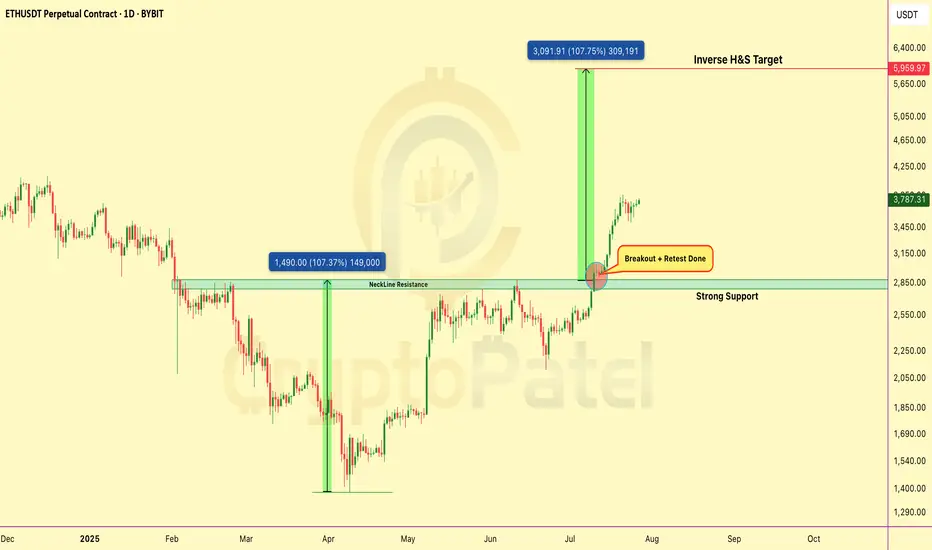
Ethereum Breakout Confirmed – Retest CompletedCRYPTOCAP:ETH has broken out Inverse Head & Shoulders on daily chart.
✅ Neckline breakout above $2,850
✅ Retest successful – strong support confirmed
✅ Targeting full move toward $6,000
Structure is bullish, momentum building. As long as #Ethereum holds above the neckline, continuation is likely.
Note: NFA & DYOR
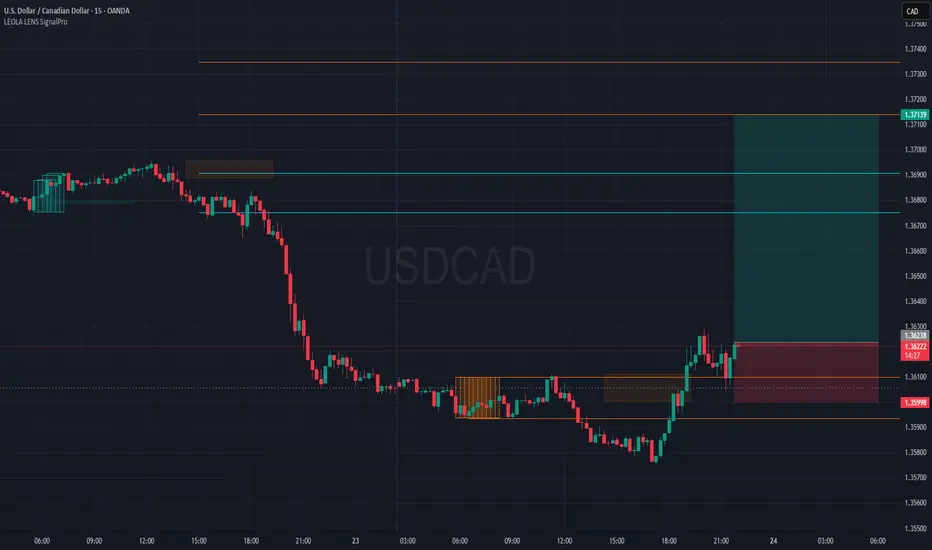
USDCAD Bullish Setup-Shift from Accumulation to ExpansionPrice has broken above recent accumulation range marked by Liquidity Control Boxes.
SignalPro long setup activated with:
🔶 Smart accumulation zone breakout
🔁 Minor retest at 1.361 area holding
🎯 Targeting upper liquidity levels around 1.37139
Price structure shows a bullish microtrend reversal with risk capped below last demand block.
Key Elements on Chart:
📦 Leola Lens SignalPro's control zones provided context for consolidation and breakout
📈 Breakout aims toward untested supply zones above
⏳ Timeframe: 15-min
🧠 Educational Use Only – No financial advice.
Tool used: Leola Lens SignalPro
EURUSD: Bearish Breakdown in SightEURUSD is currently holding above the 1.173 support zone, but the bearish structure is becoming more evident. The downward trendline and nearby resistance have repeatedly rejected price rebounds.
If the support at 1.173 breaks, a sharp move toward the 1.168 target is likely — a key previous low.
Trend: Prefer SELL if a breakdown confirms – low risk, high potential.

Gold holds steady—Is a breakout above $3,400 next?Gold prices have corrected exactly as we anticipated yesterday. At the time of writing, gold is hovering around $3,370 USD, showing little volatility since the start of the session.
Although the market is undergoing a short-term pullback, I still believe gold remains in a medium- to long-term uptrend. One key reason is the global shift away from the US dollar, with many countries increasing their gold reserves. Meanwhile, the USD is projected to weaken further in the long run. On top of that, if the Federal Reserve indeed begins to ease monetary policy, gold could break above the $3,400 level and potentially set a new record.
In addition, trendline support remains intact—if momentum picks up from here, the bullish trend may soon resume.
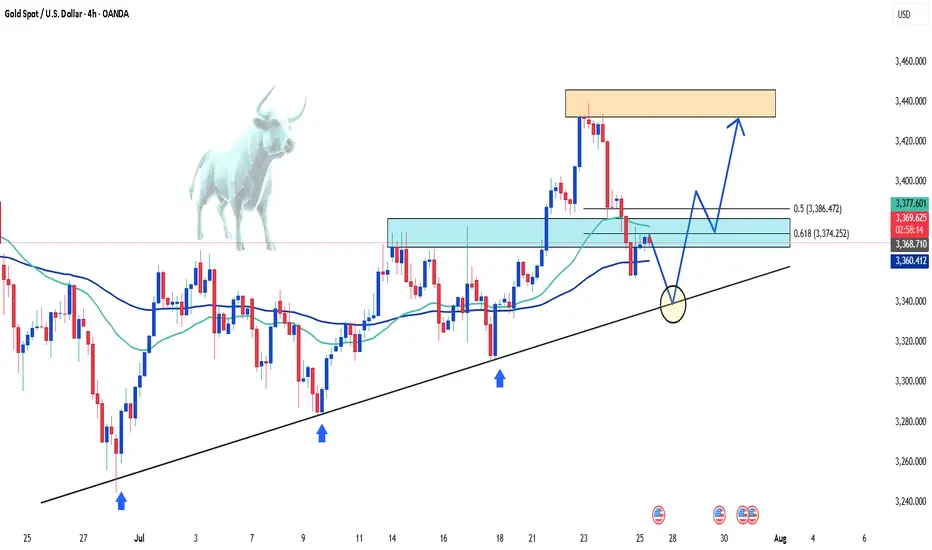
Gold takes a break – what's next?After Tuesday’s strong breakout, XAUUSD is now consolidating just as we expected yesterday. The price is hovering around 3,385 USD and is forming a head and shoulders pattern.
Technically speaking: If gold continues to hold the 3,350 USD support zone and the trendline, the bullish outlook remains intact. At this stage, gold is simply "taking a break" before its next move.
I'm still optimistic about gold’s potential — how about you?

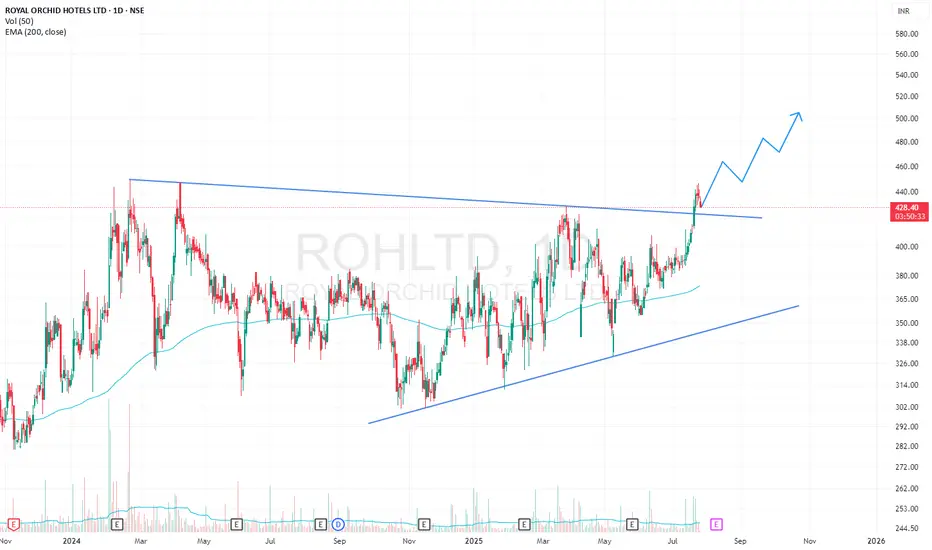
ROHLTD Triangle BreakOut 1DRoyal Orchid Hotels has given a breakout from triangle pattern on 1D timeframe. It has given a breakout with high volumes. It is currently trying to retest its breakout resistance.
TATA CHEMICALS LTD – Cup & Handle BreakoutTata Chemicals has formed a classic “Cup and Handle” formation on the daily chart – a bullish continuation pattern indicating accumulation followed by breakout potential. This is a well-respected setup among technical traders and often leads to sharp upside momentum once the neckline resistance is broken.
Key Observations:
* Cup & Handle Formation
The stock has completed a large rounded bottom (the cup) from February to June, followed by a healthy pullback (the handle) in July. This indicates strong base building and investor interest.
* Breakout Level: ₹976–978
The price is now testing the neckline resistance zone around ₹976. A breakout and close above this level would confirm the pattern and open room for further upside.
* Bullish Momentum Building
The recent rally toward resistance has been with rising candles, and a breakout could invite fresh buying interest. Momentum indicators are supportive, and MACD (not shown in chart) is likely to cross bullish on confirmation.
* Volume Confirmation Important
Traders should look for above-average volume on the breakout day to validate the strength of the move.
Final View:
Tata Chemicals is at a crucial technical level. A confirmed breakout above ₹978 could trigger a bullish continuation supported by the strong base. Traders looking for swing opportunities should keep this stock on their radar.

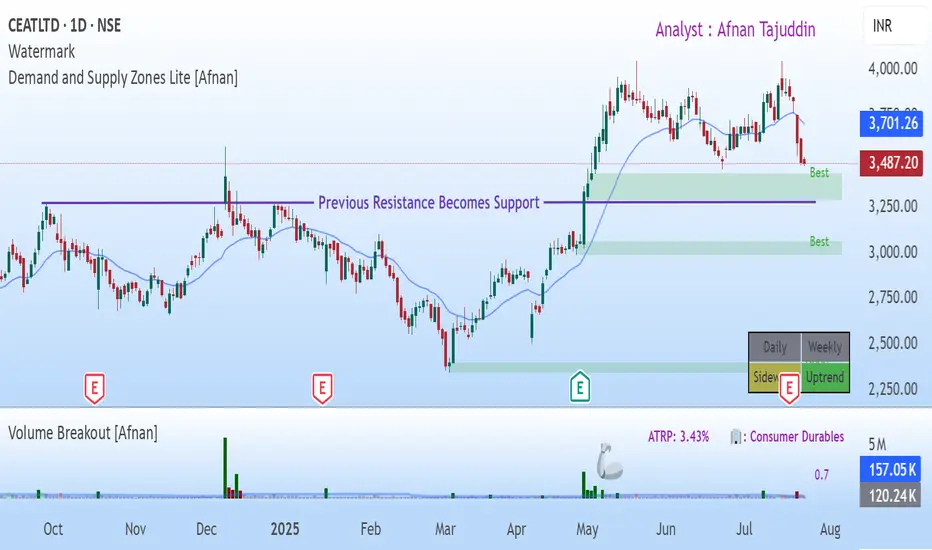
CEAT Ltd: Is a Rebound on the Horizon? A Confluence of TechnicalTraders — let’s dig into CEAT Ltd NSE:CEATLTD . where both demand-supply dynamics and classic technical signals are flashing something worth watching. What’s setting up here isn’t just noise — there’s real structure underneath the surface.
Demand Zone & Institutional Footprints
Let’s start with the core of this setup: the Demand Zone. CEAT’s price is inching toward a daily timeframe Rally-Base-Rally zone — and not just any zone, but one that stands out in terms of quality.
Why does this matter? Because these aren’t retail-driven bounces. These are often the hidden footprints of institutions quietly building positions.
On June 23rd, price came close to this very demand zone — and without even touching it, we saw a sharp bounce. That’s a strong tell. There’s clear demand waiting just below.
Institutions don’t throw their entire order book at the market in one go. They scale in. So when price comes back to this area, it’s likely to trigger those leftover buy orders — potentially leading to another move higher.
Zooming out to the broader view : Both weekly and monthly charts are still in an uptrend. There are no obvious supply zones on the higher timeframes That clears the runway for bullish continuation.
💡 Traditional Technical Analysis Perspective 💡
Now let’s switch gears for a moment and take a look through the lens of classic technical analysis. What’s the chart telling us in plain sight?
CEAT spent months coiling within a consolidation range — nothing impulsive, just sideways chop.
But that changed on April 30th with a decisive breakout. And this wasn’t on light volume — it came with strong participation, a real sign of conviction.
Post-breakout, we’ve seen consistent volume buildup alongside price progression. This isn’t a one-day wonder — it’s been developing.
Act of Polarity at Work: The breakout level had previously acted as firm resistance multiple times. Now that price is retesting it from above, it’s doing exactly what we expect — flipping that resistance into potential support.
Interestingly, this retracement is happening on declining volume. That’s key. It often suggests a healthy retest rather than a breakdown — a potential “buy the dip” scenario, if you will.
🤝 The Confluence: Where Two Worlds Meet 🤝
Here’s where things get really compelling — that demand zone we highlighted? It aligns perfectly with the same level that’s being retested post-breakout. That overlap — this confluence — is no coincidence.
It dramatically increases the odds of a strong bounce, because we’re getting validation from two independent analytical frameworks. When price, psychology, and institutional footprints all point to the same zone — you pay attention.
We could consider a tactical Stop Loss just below the demand zone. And in terms of upside? The previous swing high near ₹4000 stands out as a logical first target.
"Success in trading is a marathon, not a sprint. Consistency, discipline, and effective risk management are your true North Stars."
Stay sharp. Even the cleanest setup can fail — and that’s why managing risk isn’t optional. If price violates the zone and closes below your SL, step out without hesitation.
Thanks for reading — your support, feedback, and questions always help drive this community forward. Let’s keep sharpening our edge together.
🚀 Trade smart, stay disciplined, and let your journey be one of continuous learning! 🚀
Disclaimer: This analysis is intended purely for educational purposes. It does not constitute investment advice or a trading recommendation. I am not a SEBI-registered advisor.
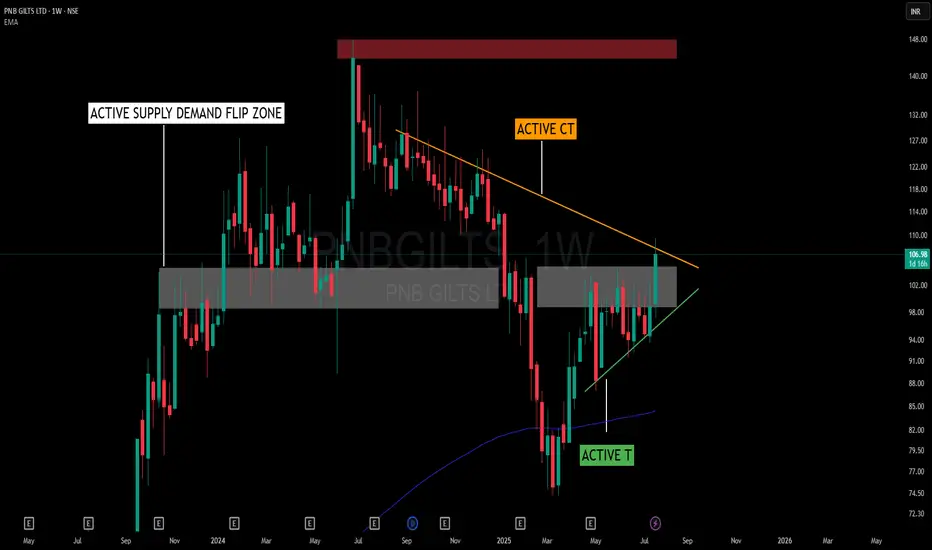
Squeezed by Structure – When Trendlines and Flip Zones CollideThis chart presents an interesting interaction between structure and zone dynamics without adhering to a textbook pattern name. The price is being squeezed within a random, yet well-defined structural form, shaped by the forces of support and resistance.
📌 Key Structural Notes:
🟠 Active Counter Trendline (CT) – Acting as overhead resistance, capping price for several weeks.
🟢 Rising Trendline (T) – Offering a base of support, encouraging higher lows and structural tightening.
🟫 Supply-Demand Flip Zone – A previously reactive supply zone now serving a dual role, showing consistent relevance to price behavior.
🟥 Major Supply Overhead – Remains untested, yet significant from a broader structure perspective.
Rather than labeling this as a triangle or cup-handle, it’s more about how CT and T are working together to compress price into a decision area. The presence of the flip zone adds to the friction, making this a valuable case to observe from a structural and behavioral standpoint.
🧠 Not a prediction or setup – just a visual study of how structure evolves when opposing pressures meet within a contextual zone.