SARDAEN - Breakout WatchlistWhy This Stock?
✅ Base Breakout – Breaking above ₹526.2 with strong volume confirmation (4-5x past trading sessions).
✅ Trading Above Key DMAs – Strong price structure with good RSI.
✅ No Left-Side Resistance – Clean chart structure with potential for an uptrend.
✅ Formation of W Pattern + VCP – Classic bullish continuation setup.
✅ Resisted Market Fall – Showcasing relative strength despite overall weakness.
Safe traders wait for a weekly close above the break-out level ₹526.2.
Key Levels
📌 Entry: ₹538.50
📌 SL (Closing Basis): ₹423.10
📌 Breakout Level: ₹526.2
Fundamentals (Key Metrics)
Market Cap: ₹18,979 Cr.
Stock P/E: 27.9
ROCE: 15.3%
ROE: 14.1%
Sales Growth (YoY): Improving
OPM % YoY Improving
EPS YoY: Improving.
What Could Go Wrong?
⚠️ Overall Market Trend is Bearish – Any weakness in broader indices can drag the stock down.
⚠️ Sectoral Index is Weak – Lack of sectoral strength may limit upside potential.
⚠️ High SL Probability – Strong pullbacks can invalidate the breakout; hence, buy test quantities only.
⚠️ Deep SL
Why This is Worth Watching?
📈 Stocks that Fell Less in Correction – Often become early movers when the market stabilizes.
📈 Volume Picking Up – A good sign that institutional interest might be present.
🚨 Disclaimer: This is not a trade recommendation but a watchlist alert. Do your own research before making any trading decisions. 🚨
Breakout!

Apno Ka BankRBL BANK -
Incorporated in 1943,RBL Bank is a banking company engaged in providing specialized services under five business verticals namely: Corporate Banking, Commercial Banking, Branch & Business Banking, Retail Assets and Treasury & Financial Markets Operations.
CMP 209
This is just to boost my confidence. No Suggestions for buying.
Disclosure: I am not SEBI registered. The information provided here is for educational purposes only. I will not be responsible for any of your profit/loss with these suggestions. Consult your financial advisor before making any decisions.

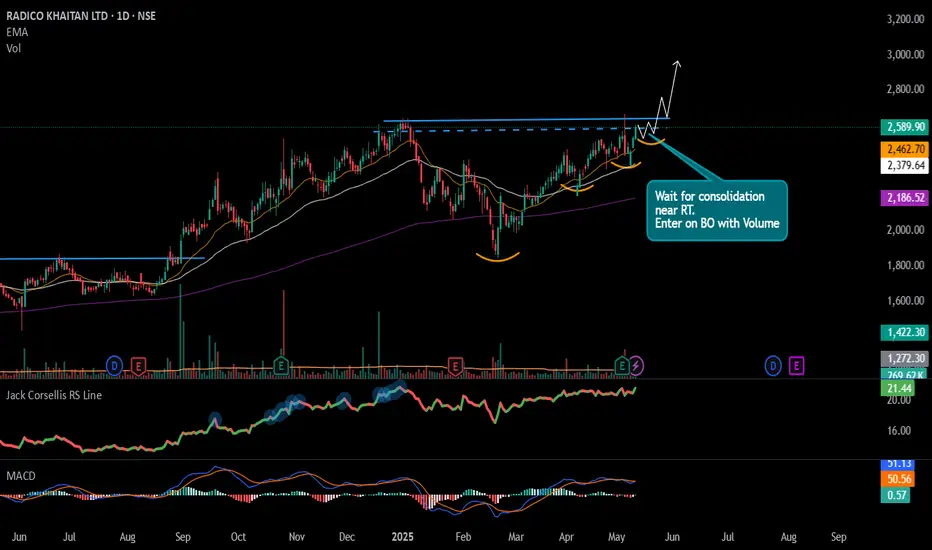
#RADICO - Potential Breakout Keep in WL📊 Script: RADICO
Key highlights: 💡⚡
📈 Roiunding Bottom Pattern / VCP Set up in Daily Time Frame.
📈 Wait for price consolidating near Resistance.
📈 Can Enter on BO with Volume spike or Wait for Pullback
📈 MACD Nutral
📈 One can go for Swing Trade.
BUY ONLY ABOVE NA DCB
⏱️ C.M.P 📑💰- 2589
🟢 Target 🎯🏆 – NA%
⚠️ Stoploss ☠️🚫 – NA%
️⚠️ Important: Market conditions are Okish, Position size 50% per Trade. Protect Capital Always
⚠️ Important: Always Exit the trade before any Event.
⚠️ Important: Always maintain your Risk:Reward Ratio as 1:2, with this RR, you only need a 33% win rate to Breakeven.
✅Like and follow to never miss a new idea!✅
Disclaimer: I am not SEBI Registered Advisor. My posts are purely for training and educational purposes.
Eat🍜 Sleep😴 TradingView📈 Repeat 🔁
Happy learning with MMT. Cheers!🥂
MAN INDUSTRIES – Explosive CT Breakout with Volume Cluster Surge🔴 CT Breakout: The red trendline marks a major weekly CT, now decisively breached by a strong bullish candle.
📈 Volume Cluster Breakout: This is not a one-week spike — it's a cluster of multiple high-volume weeks, indicating consistent accumulation before the breakout. Current volume stands tall at 2.23M+, validating this move.
🟢 Demand Zones Respected: Price respected key demand zones (green boxes) on multiple occasions, forming a strong base with higher lows.
⚪ Hidden Resistances Cleared: Two dotted white hidden resistance lines have been cleanly taken out, suggesting deeper supply has been absorbed.
🟥 Supply Zone Ahead: The next visible hurdle, giving the current move significant open air to run.

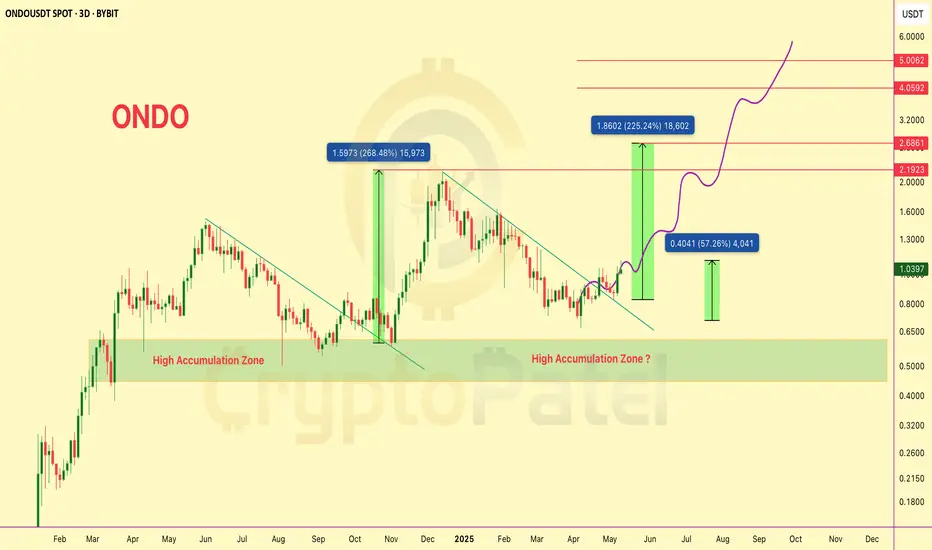
$ONDO/USDT Technical Analysis – Next Move Loading?$ONDO/USDT Technical Analysis – Next Move Loading?
#ONDO just broke out of a long-term descending trendline resistance and is now preparing for its next major wave.
We already shared the dip-entry below $0.80 — and it’s now up 57% from that zone!
Hope you're enjoying the ride.
Chart Highlights:
▶️ Clear breakout from multi-month downtrend.
▶️ Price bounced strongly from the High Accumulation Zone ($0.80-$0.50).
▶️ Previous breakouts resulted in +268% and +225% rallies.
▶️ Short-term move toward $1.30–$1.40 possible if support holds.
▶️ Targets: $2.19 → $2.68 → $4.05 → $5.00+
A healthy pullback or consolidation above $1 could offer the next breakout leg toward $2+.
Stay alert. Accumulation looks complete, and momentum is shifting bullish fast.
Long consolidation may be breakoutLong consolidation stock
Good volume in previous week
EMAs are close
Potential breakout chances are high
PE is oscillating for ages

TATA MOTORS – Textbook CT Breakout on Weekly Chart🔍 Key Technical Highlights:
✅ CT Breakout: Clean break above a long-standing counter-trendline drawn from the November 2024 highs. The breakout is decisive, with the latest weekly candle closing convincingly above the CT.
✅ Volume Confirmation: Weekly volume surged to ~9M, confirming strong participation behind the breakout — a critical condition for higher timeframe setups.
✅ Simple Base at 200 EMA: Price formed a simple base right at the 200-week EMA, absorbing selling pressure and building strength before the breakout. This acts as a reliable launchpad, often seen in high-quality setups.
✅ EMA Recovery: The breakout candle reclaims the 200 EMA, a strong sign of trend reversal and institutional interest.

Big Money is Moving In—This Chart Screams BREAKOUT!A deep technical revisit on PREMEXPLN reveals a textbook example of structure, confluence, and timing:
✅ Previous Cup & Handle Breakout Zone (Yellow)
The stock gave a massive breakout in mid-2023 from a well-formed Cup and Handle base.
This zone, once a strong resistance, now acts as a long-term structural support (highlighted in yellow).
✅ Fibonacci Retracement from ATH to CMP
A Fibonacci retracement from the all-time high of ₹906.4 to current levels shows a 61.8% retracement near ₹399, aligning perfectly with the current bounce zone.
✅ Red-to-Green Flip Zone
The stock previously struggled around ₹420–₹480 (red resistance block), but now this zone is flipping into support with price reclaiming it—textbook polarity flip.
✅ WTF Counter-Trendline Breakout
A clean weekly CT breakout is visible with strong bullish conviction.
The breakout candle engulfs the previous sell-off wick, signaling wick fill + rejection absorption—a bullish candle combination.
The breakout is supported by a noticeable volume spike (7.78M).

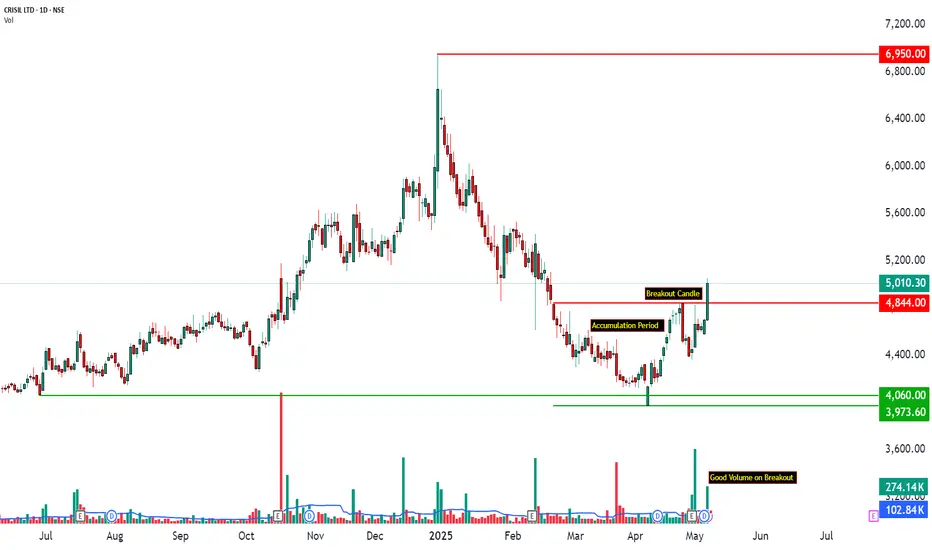
Bullish Momentum with EMA200 and Volume Confirmation📈 CRISIL Technical Analysis | Bullish Momentum with EMA200 and Volume Confirmation
📅 Date: May 08, 2025
📈 Timeframe: Daily
🔍 Stock: CRISIL(NSE)
📊 Price Action Update (Today):
CRISIL surged by +6.59%, closing at 5,010.30, after trading in a range between 4,690.20 and 5,050.00. The stock formed a strong bullish candle, resembling a Marubozu, with a close near the day’s high — a clear sign of aggressive buying. This breakout comes after a tight consolidation phase, and is supported by heavy volume, indicating strong participation and conviction in the move.
🧠 Technical Overview:
CRISIL has shown a decisive shift in structure with today’s breakout above its 200-day EMA, signaling a potential trend reversal. The stock had been consolidating in a narrow range for several sessions, building energy for a directional move. Today's breakout is validated by a surge in volume (2.5x the 20-day average), along with supportive indicators like RSI crossing 60, Bollinger Band expansion, and the TTM Squeeze turning OFF. These combined signals suggest that the stock is entering a momentum phase, where further upside is likely if follow-through buying continues. Immediate attention should be on price behavior around the next resistance at 5,143.
🧩 Chart Pattern Insight:
The price action on the daily chart reveals a rectangle consolidation breakout. CRISIL had been trading within a well-defined horizontal range, forming a base between 4,600 and 4,800 for several sessions. This pattern represents a period of accumulation. Today’s strong breakout candle marks a range breakout with volume confirmation, turning the previous resistance zone into potential support. The structure resembles a base breakout pattern, often seen before the start of a new uptrend. A sustained move above the breakout zone may lead to a measured move towards the next resistance levels.
🧱 Support & Resistance Analysis:
Post-breakout, CRISIL has established a new support base around 4,784, which was previously a resistance level during consolidation. Below this, the next key supports lie at 4,557 and 4,423, providing a cushion in case of any pullbacks. On the upside, the immediate resistance to watch is 5,143, a level where price previously reacted. If the momentum continues, CRISIL may test 5,276 and 5,503 in the coming sessions. These levels will be crucial in determining whether the breakout evolves into a sustained trend or faces short-term profit booking.
🔍 Volume Analysis:
The recent price movement in CRISIL shows a noticeable increase in volume, with traded volume at 2.5 times the 20-day average, suggesting heightened market activity. The breakout candle, paired with this significant volume, indicates a potential shift in the market trend. Prior to this, volume was relatively lower during the consolidation phase, indicating a period of accumulation or base-building. This typical volume pattern — lower during consolidation and higher during a breakout — strengthens the case for a potential trend change.
The volume profile suggests a shift in market sentiment, with buying interest becoming more prominent in the 4,700–4,800 range. The breakout candle shows a notable volume exceeded 270K, indicating increased buyer participation. Additionally, selling pressure observed in the 4,500–4,700 zone seems to have been absorbed, which may indicate a potential for further price movement.
📌 Educational Insight:
The recent breakout in CRISIL Ltd is a strong example of a trend reversal confirmed by volume, offering valuable insights for those studying price action, trend shifts, and volume dynamics. This setup illustrates how multiple indicators — including trend, volume, and volatility — align to suggest the potential for a trend continuation. Traders often look for such setups to make risk-defined entries during pullbacks. The breakout is characterized by significant volume and a full-bodied green candle on the daily chart, supported by several technical factors, such as volume and delta support, an EMA 200 crossover, and volatility expansion after a squeeze.
The outlook for CRISIL Ltd remains bullish, driven by multiple technical confirmations. However, caution is advised as the price approaches Resistance Levels 1 and 2 (R1–R2), where profit booking may occur. Additionally, if the price falls below 4,783 with volume confirmation, traders should consider reevaluating their positions.
⚠️ Disclaimer:
This analysis is purely educational and not a buy/sell recommendation. Please consult your financial advisor before making investment decisions. This content complies with SEBI guidelines and is intended to promote learning and market awareness.
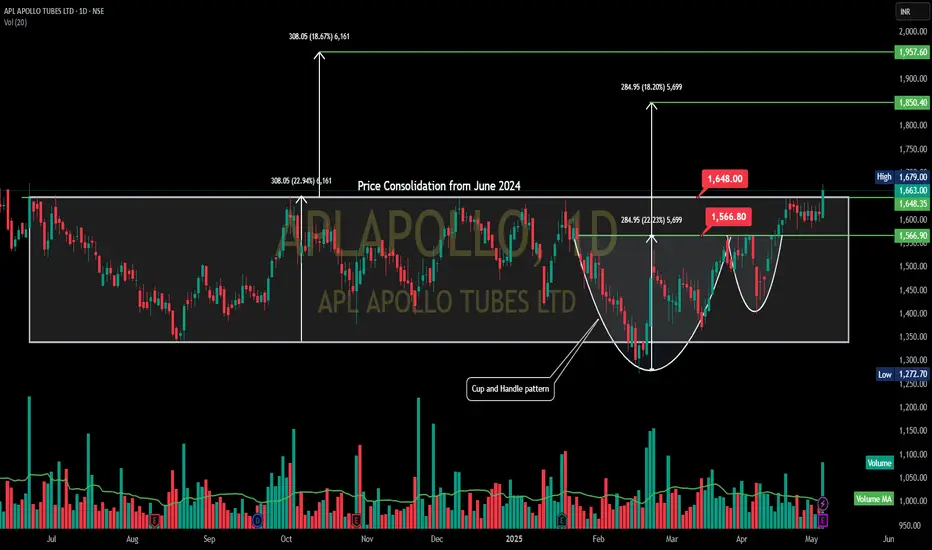
APL APOLLO TUBES LTD - Consilidation- Cup and HandleAPL APOLLO TUBES LTD - Daily Chart
Pattern: The chart shows a period of Price Consolidation from June 2024 within a broad range, roughly between 1,300 and 1,640. Within this larger consolidation, a "Cup and Handle" pattern has formed more recently.
Cup: Formed from approximately mid-February 2025 to mid-April 2025, with the low around 1,272.70.
Handle: A smaller consolidation (handle) formed in late April/early May 2025.
Neckline/Breakout Level: The price is attempting to break out above the neckline of this Cup and Handle, which also coincides with the upper resistance of the broader consolidation range, around 1,640.00 - 1,648.00.
Volume: Volume appears to be increasing on the current breakout attempt from the handle and the larger consolidation.
Target:
The depth of the more recent cup (approximately 284.95 points) projected from the breakout (around 1,586 - which seems to be the C&H neckline) gives a target around 1,850.40.
The height of the larger consolidation (from Oct 2024, approx 308.05 points) projected from the upper boundary breakout (around 1,648) gives a target around 1,957.60. The chart uses both.
Support: The breakout level around 1,640.00 - 1,648.00 is the key immediate support. The low of the cup (1,272.70) is a more significant long-term support.
Resistance: The immediate resistance is the current breakout zone. The projected targets of 1,850.40 and 1,957.60 are the next resistance levels.
Interpretation: APL Apollo is attempting a significant breakout from both a recent Cup and Handle pattern and a longer-term consolidation range. If successful, this could lead to a strong upward move towards the projected targets. The increased volume supports the bullish case. Confirmation above 1,648.00 is key.
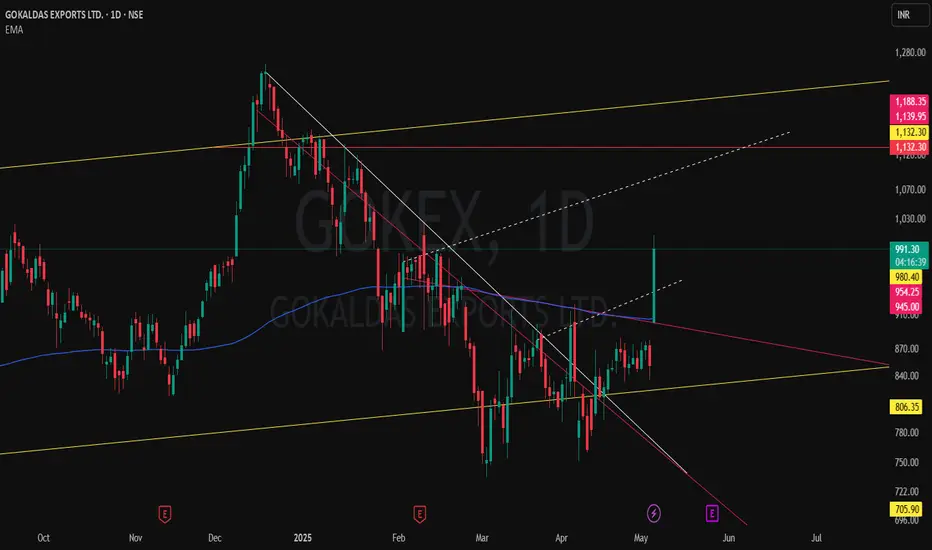
Massive Breakout Loading? GOKEX Smashes Through Triple TimeframeGOKALDAS EXPORTS LTD (GOKEX) is showing serious strength with a powerful breakout candle currently in play – but the real story is the multi-timeframe technical alignment:
📏 MTF Structure
Yellow Parallel Channel from Monthly shows a long-term structure still intact.
Red Horizontal Resistance marks the previous MTF peak – now under threat.
🔻 WTF Pressure
Pink Counter-Trendlines acted as significant resistance on the Weekly – both pierced.
⚡ DTF Precision
White CT Line (Daily) finally broken with conviction.
Dotted White Lines reveal multiple hidden resistances — all cleanly taken out by today's surge.
📊 Volume & Candle Strength
Volume spiking, price up over 16% intraday — just waiting on confirmation at close.
🧠 Watch Closely: A close above today’s highs could flip this into a full-blown A+ breakout setup.
Glenmark Pharmaceuticals – Breakout**GLENMARK:**
The stock has recently attempted to break above a long-term descending trendline, but today’s rejection suggests a potential pullback.
Key Levels:
• Resistance: Trendline around ₹1,660 , ₹1,776
• Support: Horizontal support at ₹1,445

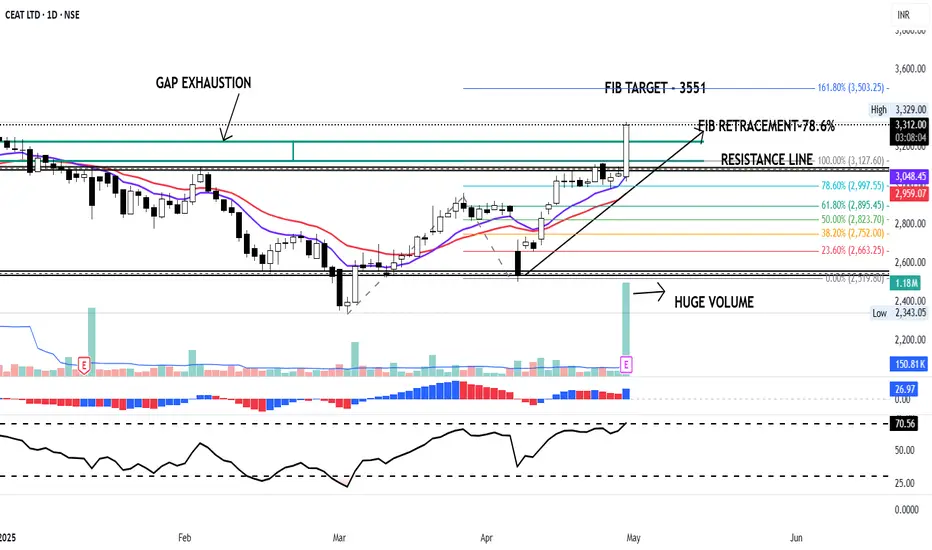
CEAT on a roll.Ceat announced its quarterly results on 29.4.2025 and the market gave big thumbsup to its numbers making the stock price surge up to 8% to Rs.3300 at the time of writing.
On the technical charts CEAT is looking very strong for the more upmove ahead. The stock has broken out of its Resitance zone of Rs.3050/3100 with strong volumes.
The stock has retraced 78.6% on 4th April which is considered a very good retracement according to the Fibonacci analysis. By using the Fibonacci extension tool the target for the stock comes to 3551 ( 161.8% target ).
The stock is trading above 11 and 22 days EMA, RSI is at 70 and MACD above zero line signifying bullish momentum. It has also exhausted the Gap created on the daily charts indicating the confidence in the stock.
Not a BUY/SELL RECOMNDATION
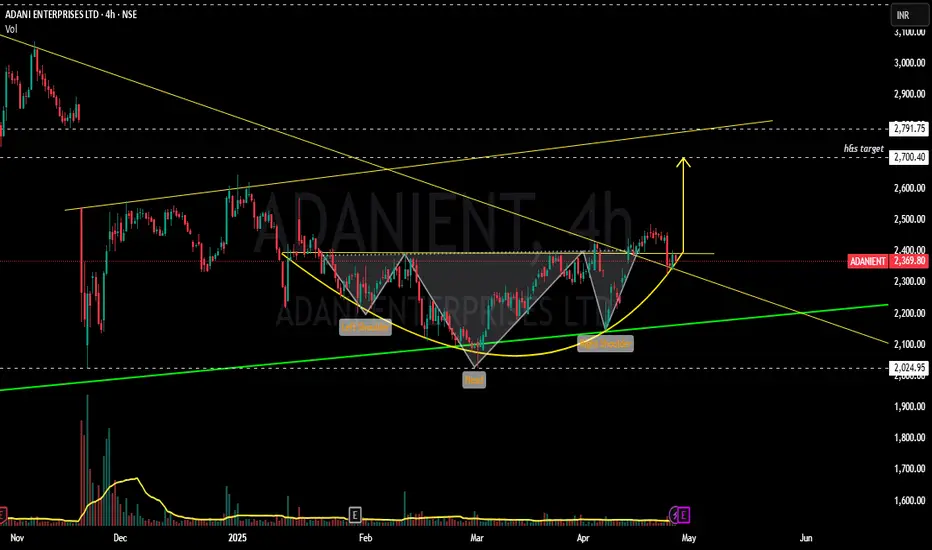
ADANIENT - Bulls getting ready to bump up ?????!!!Y essss!!! !
Chart patterns inculcating me the above titled opinion.
1. Monthly timeframe shows the symmetrical triangle pattern from 2020 till now, now the stock at support line(chart image shown below)
2. Weekly time frame shows us the INSIDE BAR candlestick pattern(mother baby pattern) with good volumes....with the low umtested till now.(made the low of 2025 on 22 nov 2024)
3. Daily time frame shows the Breakout attempt out of the 11 month old trendline.
4. Now, with the results on may 1, we can expect a volatile move.... .with the inverted h&s pattern around the corner.
Voluminous Entry can be made after the BREAKOUT WITH GOOD VOLUMES...
will update once the breakout happens.
Just add it to your watchlist and keep an eye on it.
THIS IS JUST MY OPINION..NOT A TIP NOR ADVICE.
Thank you .
LITECOIN $500 Potential In Current Bull: Detail AnalysisLITECOIN MACRO BREAKOUT – NEXT LEG INCOMING?
NYSE:LTC confirmed a breakout above its multi-year resistance line after holding the Best Accumulation Zone for months!
🔸 Support Held: ~$65
🔸 Accumulation Zone: ~$85-$65
🔸 Short-Term Target: $255/$500
🔸 Long-Term Target: $1000/$1458+
Same pattern. Same zone. Same breakout.
🔥 I’m super bullish on #Litecoin.
Yes, it has tested our patience… but one strong day in this bull market and it could smash $500.
Let’s not forget — our initial entry was around $50, and it’s still a great range to accumulate.
While $1000–$1500 may not happen this bull run, I personally believe it’s possible in the near future.
⚠️ Of course, this is not financial advice — just my personal view. Always DYOR before investing in any coin.

Will Ethereum hit $12000 in current Bull Market?CRYPTOCAP:ETH just confirmed a monthly hammer close — strongest bullish signal of 2025 so far.
Last similar structure led to a +60% rally.
Price action + volume = Strong reversal setup.
Bias: Long | Accumulation Phase Activated 🚀
Note: NFA & DYOR

Rounding Bottom Breakout in United SpiritsUnited Spirits has given Rounding bottom Breakout on the daily charts. This pattern is very powerful and now this stock can provide a return of 15% in near term.
On the monthly chart, the stock has a long white bodied candlestick which signifies strength and possible bullish bias.
On the Daily Chart,the stock is trading above its 11 and 22 day EMA, RSI is at 69 and MACD is above zero line suggesting positive momentum.
Volume- The volume has increased towards the breakout which suggests the possible upmove.
CMP- Rs.1570
Price Target - Rs1800
SL- 1525 ( Below the neckline)
Disclaimer: This is not a buy/sell recommendation. For educational purpose only. Kindly consult your financial advisor before entering a trade.

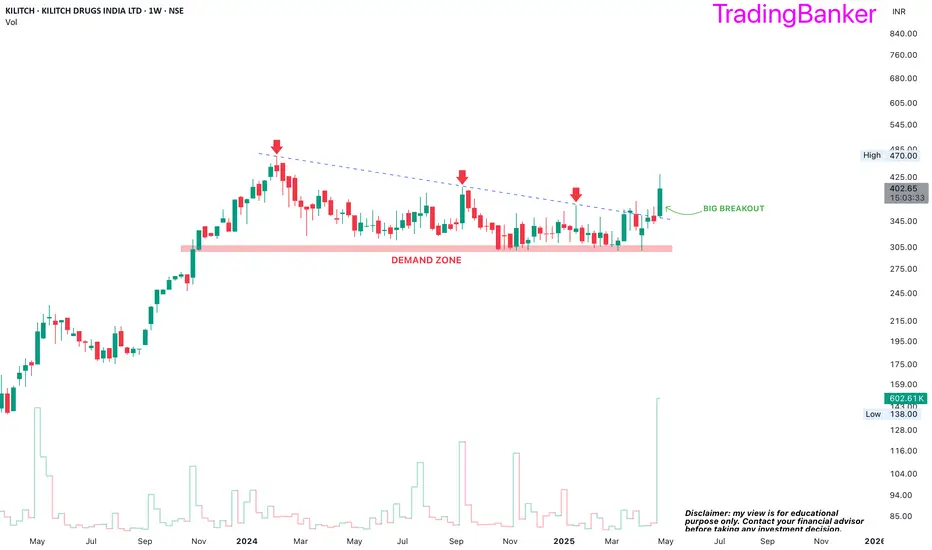
KILITCH: Multibagger in the making?-Earnings and sales have been improving YoY
-Undertaking capacity expansion which will further boost financials
-Highest promoter holding in the last decade
-Will enter partially and rest upon decent quarterly result
-Trendline breakout with huge volumes. SL below breakout candle.
Gold at the Edge: Range Compression Signals Brewing Breakdown !Gold (XAU/USD) has entered a critical phase on the daily timeframe, forming a tight range between ~$3,305 and ~$3,330 after a strong bullish rally. This price action resembles a distribution pattern — a phase where smart money offloads positions while retail gets trapped in volatility. Despite repeated intraday bounces, price has failed to break higher, indicating weakening bullish momentum and growing pressure from zones above.
According to price action this rectangular structure just above $3,300 is not just a pause — it’s a coiling range with heavy potential energy. The failure to push above recent highs shows exhaustion, while the support zone at $3,201.11 emerges as a decisive level. If this support gives way, it would confirm a range breakdown with an immediate target of ~$3,100 and a secondary potential target near $2,900 based on prior zones and volume gaps.
From a fundamental lens, the downside risk is justified. U.S. economic data continues to show resilience, which strengthens the dollar and fuels Neutral Fed sentiment. Sticky inflation and a robust labor market are forcing investors to reprice the probability of further rate cuts — delaying the Fed pivot narrative that previously propelled gold upward. On top of that, real yields are rising again, which historically applies downward pressure on non-yielding assets like gold. With trade wars easing off too this is a downwind for gold .
Geopolitical tensions, which previously supported gold’s safe-haven appeal, have shown signs of de-escalation in recent days, weakening bullish flows further. In short, unless a fresh global catalyst emerges, the fundamentals currently align with the bearish technical setup forming on the chart.
Key Level to Watch:
Breakout 3300 targeting 3210-20 sl above 3350
🔵 $3,201.11 — Decision point for bulls to hold and push back OR a trigger for bears to unleash further downside.
⚠️ Break below this level opens doors to 3,100 first and then 2,900 as liquidity unwinds.
Until a clear breakout or breakdown occurs, this range is a trap. Stay sharp and wait for confirmation — because when this range breaks, it won’t be silent.

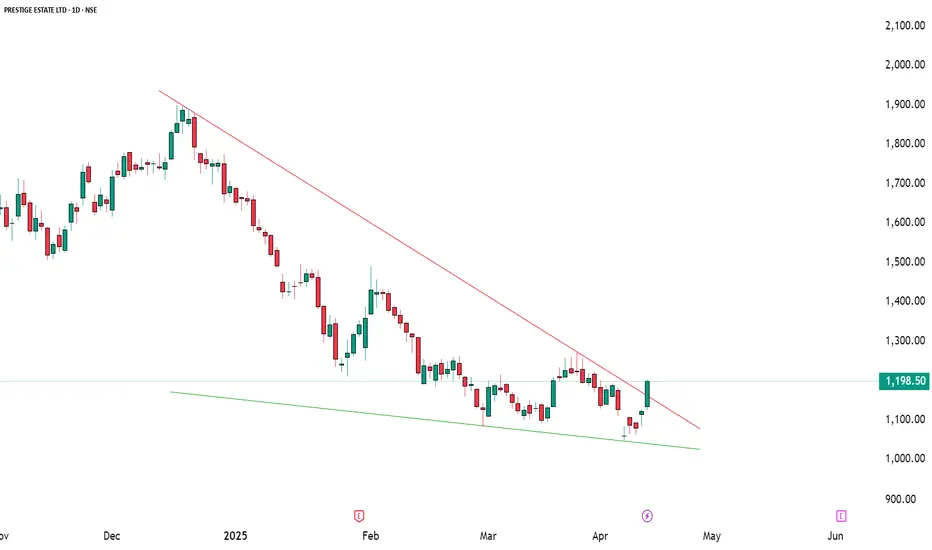
Prestige Estate – Bullish Structure DevelopingPrestige Estate – Bullish Structure Developing After Prolonged Correction
📅 Date: April 16, 2025
📈 Chart Type: Daily | Exchange: NSE
💡 Purpose: Educational Analysis
🔍 Price Action Overview
After an extended downtrend, Prestige Estate appears to be forming a potential trend reversal structure. A strong bullish candle has emerged from a key support zone, accompanied by multiple technical confirmations that indicate renewed buying interest.
📌 Key Technical Highlights
📉 Downtrend Line Break: The stock has convincingly broken above a descending trendline, indicating a potential shift in trend dynamics.
📊 Indicators Triggered:
✅ RSI Breakout: Momentum is turning positive.
✅ MACD Crossover: Bullish signal crossover observed.
✅ Bollinger Band Squeeze Off: Suggests upcoming volatility with a directional move.
📍 Volume Surge: A notable spike in volume supports the strength of the breakout candle.
🧱 Support and Resistance Zones
🟢 Support Levels:
S1: ₹1148
S2: ₹1098
S3: ₹1071
Broad Support Zone: ₹1000–1050 (marked as Weak Support)
🔴 Resistance Levels:
R1: ₹1272 (Pattern Entry Level)
R2: ₹1252
R3: ₹1302
Major Resistance: ₹1900–2000 (Long-term supply zone)
🔄 Entry Reference Levels (For Educational Illustration Only)
✳️ Early Entry Reference: Above ₹1203
A close above ₹1203 indicates sustained strength and potential continuation.
🧩 Pattern Breakout Entry Reference: Above ₹1272
A breakout above ₹1272 could confirm a larger reversal pattern with room to test higher resistance levels.
⚠️ Important Disclaimer
This analysis is strictly for educational purposes and aims to help readers understand price structure, support/resistance zones, and indicator alignment. It does not constitute investment advice or a buy/sell recommendation. Always consult a registered financial advisor before making any investment decisions. Market participation involves risk and capital protection should be a priority.
📘 Conclusion
Prestige Estate is currently at a critical juncture where momentum indicators, volume, and price action are aligning for a potential upside continuation. Close monitoring of key breakout levels and market conditions will be crucial for informed decision making.
🔔 Let us know your thoughts in the comments – Do you see strength sustaining above ₹1203?
📊 Poll: Will Prestige Estate reclaim ₹1300 in the coming weeks?
Nifty CMP at 24335 At this level according to waves it can be preparing for final wave (v) but only if it crosses 24550, till then we should be only observe it as wave 4 correction phase,
No short OR EVEN No long in this range ,

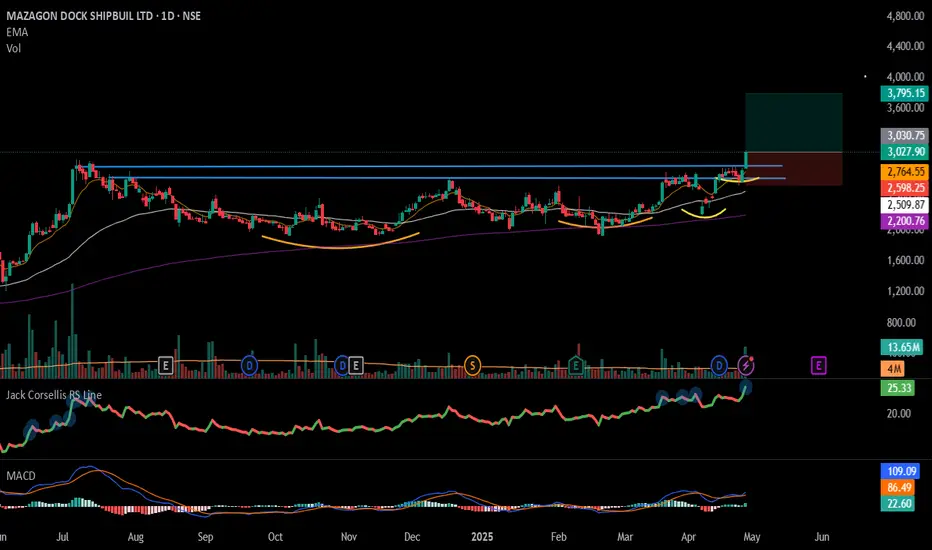
#MAZDOCK - VCP Break Out in Daily Time Frame📊 Script: MAZDOCK
Key highlights: 💡⚡
📈 VCP Break Out in Daily Time Frame.
📈 Price consolidated near Resistance.
📈 BO with Volume spike.
📈 MACD Bounce
📈 RS making 52WH
📈 One can go for Swing Trade.
BUY ONLY ABOVE 3030 DCB
⏱️ C.M.P 📑💰- 3027
🟢 Target 🎯🏆 – 25%
⚠️ Stoploss ☠️🚫 – 14%
️⚠️ Important: Market conditions are Okish, Position size 50% per Trade. Protect Capital Always
⚠️ Important: Always Exit the trade before any Event.
⚠️ Important: Always maintain your Risk:Reward Ratio as 1:2, with this RR, you only need a 33% win rate to Breakeven.
✅Like and follow to never miss a new idea!✅
Disclaimer: I am not SEBI Registered Advisor. My posts are purely for training and educational purposes.
Eat🍜 Sleep😴 TradingView📈 Repeat 🔁
Happy learning with MMT. Cheers!🥂
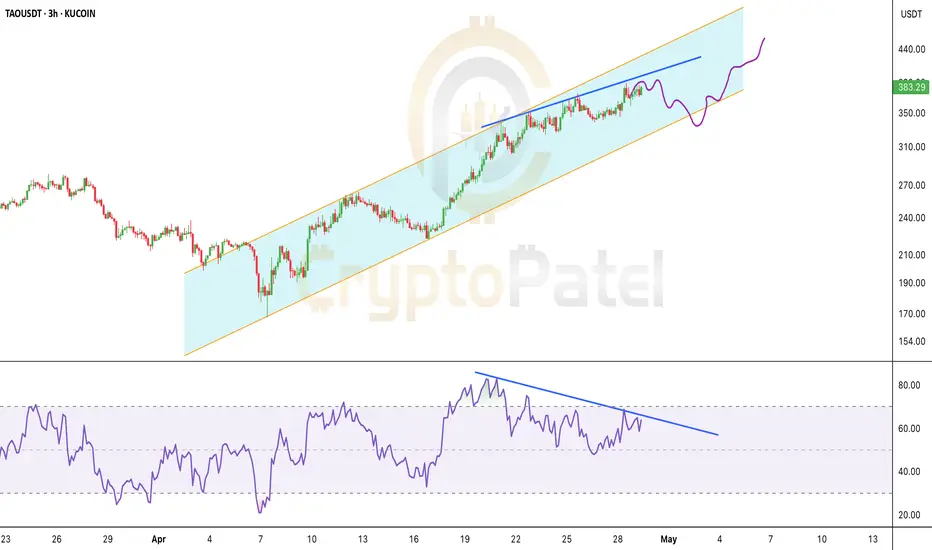
Risk-Managed $TAO Short Setup: Precision Entry Inside FVG ZoneRisk-Managed GETTEX:TAO Short Setup: Precision Entry Inside FVG Zone
▶️ Entry: $384–$395
▶️ Targets: $350 / $330 / $300
▶️ SL: $410
Reason: Bearish Divergence + FVG spotted on LTF.
Perfect for risk-managed apes. Don’t sleep on it.