Weekly CT Breakout + 200EMA Flip | GALAXYSURF Structure📉 Main CT Line (Dotted White)
A well-defined counter-trendline finally gave way after weeks of price compression. The breakout was clean, with a strong bullish candle closing decisively above it.
📊 Volume Confirmation
Breakout candle posted a solid spike in volume — the highest weekly volume in months. 💥
📈 200 EMA Broken (Blue Line)
Price has also cleared the 200-week EMA, a key dynamic resistance, now potentially flipping to support. 📉
🟧 Higher Timeframe Supply (Orange Line) / ⚪ (White Lines)
The breakout candle has also stepped into a tight zone between Weekly + Monthly supply, marked by the orange line.
📌 As always, the chart tells the story. No predictions. No assumptions, just structure.
Breakout-trading

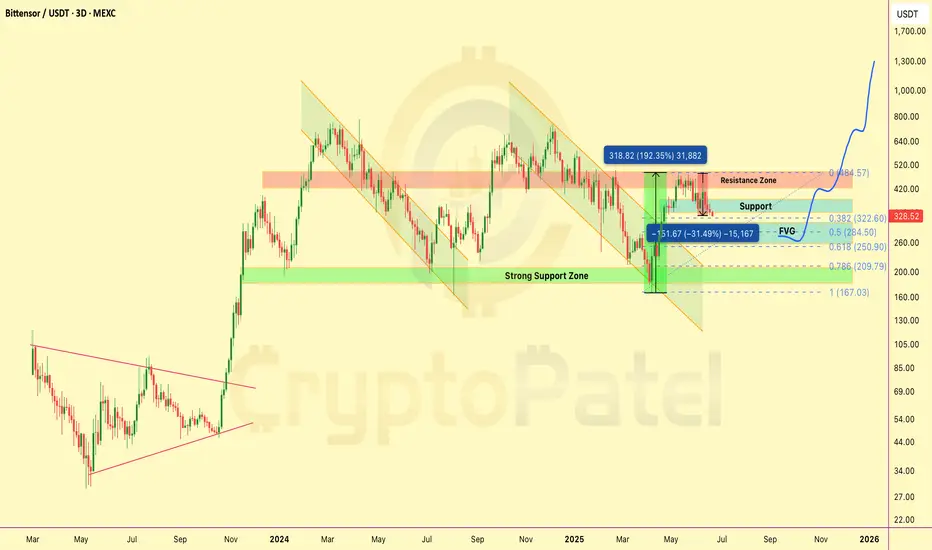
$TAO dumped 30% — and we called it at the topLSE:TAO dumped 30% — and we called it at the top.
We gave the exit at $480.
Now it’s trading near $329. Hope you booked profits or caught that juicy short.
But it’s not over yet 👇
➡️ $350 support broken
➡️ Key zone: $300–$250
➡️ Why? That’s where FVG, 0.5, and 0.618 Fib align.
I’m watching $250 for fresh entries.
Long-term vision? Still see $2k- $3k on the horizon.
Big dips = Big setups.
#TAO #Bittensor NFA & DYOR
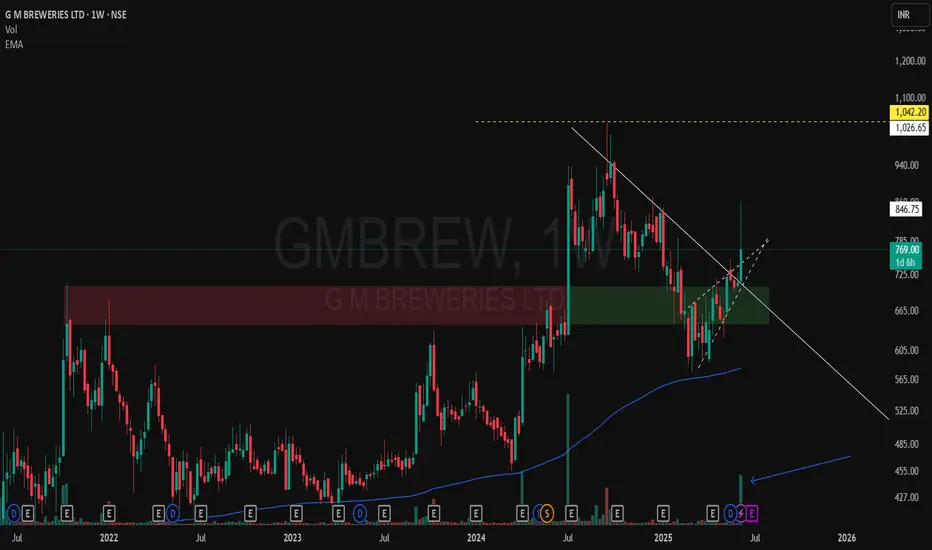
GM BREWERIES – A Classic CT Breakout with Strong Demand Flip🔍 A solid Weekly Time Frame (WTF) structure is visible here on GMBREW:
-The red-green zone highlights a classic supply turning into demand, supporting the structure.
-A clear Counter Trendline (CT) breakout (white line) is now visible, showing strength with increasing momentum.
-Notice the strong spike in volume – this breakout isn't silent. Participation has significantly picked up.
-Yellow line represents the MTF supply, which could act as the next area of interest.
-Price is currently showing a wick, so weekly closing behavior will be key from here.
-No predictions – just a technical snapshot. Structure, volume, and zones are aligning well here. Let’s see how it unfolds. 📊
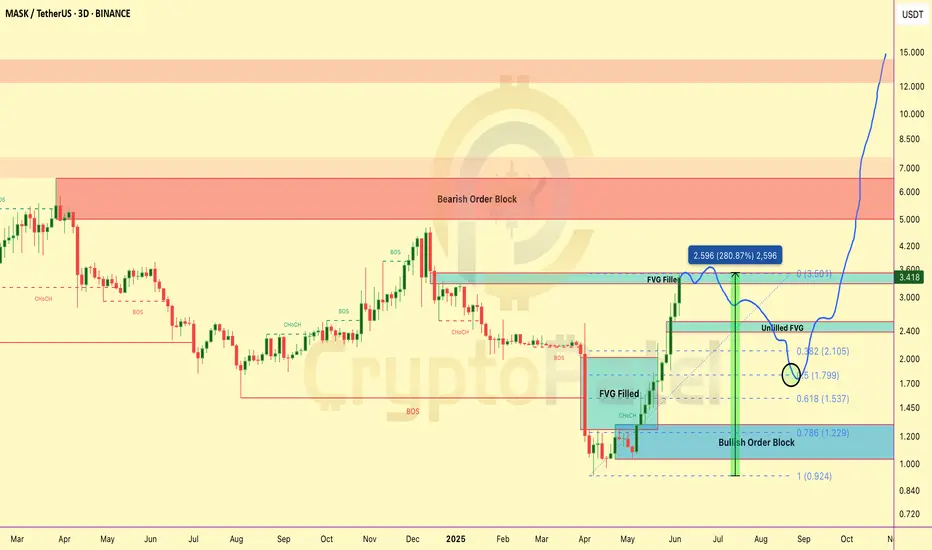
MASK 3.7x PUMP — Is a BIG DIP Coming?MASK 3.7x PUMP — Is a BIG DIP Coming?
MASK just delivered a MASSIVE rally from the Bullish Order Block at $1.2–$1.3 — and filled the FVG around $3.5.
Here’s what’s next 👇
🟢 Short-Term Outlook:
👉 After pumping from $0.927 → $3.50 → that’s a 3.7x move WITHOUT any major retracement.
👉 High chances of a healthy pullback next.
👉 Strong Accumulation Zone: If price drops towards 0.5 Fib retracement at $1.80 → This will be a key area for Smart Money to re-enter.
🟢 Mid-Term Potential:
👉 Once accumulation is done → breakout above $3.5 highly likely.
👉 First big target → Bearish Order Block at $5–$7.
🟢 Long-Term Vision:
👉 If BTC supports and MASK maintains bullish structure → can aim for $15/$30/$50 🚀
👉 Huge upside still left on higher timeframes.
Key Levels to Watch:
✅ $3.5 → Resistance
✅ $2.1–$1.5 → Retracement buy zone (Unfilled FVG + Fib confluence)
✅ $1.80 → 0.5 Fib — Strong Accumulation Zone
✅ $5–$7 → Major target zone
✅ $15/$30/$50 → Long-term moonshot
My Play → Waiting patiently for retracement → looking to accumulate in $2.1–$1.5 zone, ideally around $1.80 → position for next rally!
👉 What’s YOUR strategy on MASK? Buying the dip or waiting higher? Comment below 👇👇👇
NFA & DYOR
4 Stocks. 4 Stories. Here's How I See Them Without Predictions..Purely chart-based view. No bias. No advice. Just how I interpret these right now
I make educational content videos on Swing trading .

Price Action Case Study: Weekly Price action chart of SIGACHI 🔹 Key Structural Elements:
-White Solid Line: Primary Counter-Trendline (CT) connecting multiple swing highs, acting as dynamic resistance over several months.
-White Dotted Lines: Hidden supply lines derived from intermediary highs, often acting as secondary resistance.
-Yellow Lines: Higher timeframe resistance zones (MTF) — offering confluence markers for potential supply zones ahead.
🔹Volume Expansion:
The breakout candle is supported by significant volume (~36M), indicating strong participation. Volume here acts as a confirmation trigger, suggesting institutional interest or broad-based buying.
🔹Structure:
The breakout occurs after an extended consolidation and a series of higher lows.

Everyone’s Buying MMTC… I’m Waiting for this to happen✅ CT Breakout (WTF): Well-defined CT break cleared with strong bullish momentum.
✅ Volume Confirmation: Breakout candle accompanied by 269M+ volume, signaling genuine interest.
✅ Structure: Higher low before breakout reinforces structural reliability.
✅ Base Formation: Multiple weeks of tight consolidation at base builds a solid foundation for the move.
⚠️ Caution – DTF Overextension: On the daily timeframe (DTF), price shows back-to-back green candles, indicating a short-term overbought condition.
A retracement is healthy and preferred. A direct move from here risks a poor R:R swing
📌 Conclusion:
Solid weekly breakout with all structural prerequisites in place. However, due to the extended DTF structure, wait for a healthy pullback before initiating swing entries. Avoid chasing strength. Let the price offer a clean opportunity.
🔁 Following the yellow path = strategic patience + optimal R:R.

Massive Breakout + Volume Surge! KEC Looks Ready to Explode📌 Technical Breakdown:
🔹 CT (Counter-Trendline): A clear downward-sloping white dotted CT has been broken with a powerful bullish candle.
🔹 Base Formation: A strong accumulation zone (green zone) is evident where higher lows were formed, indicating demand absorption.
🔹 200 DEMA: The price cleanly breaks above the 200-day exponential moving average, which often acts as a major dynamic resistance.
🔹 Higher Low Structure: The recent price action formed a higher low, validating strength before the breakout.
🔹 Volume Confirmation: Recent candles show a surge in volume, confirming institutional participation and accumulation during the base.

HEROMOTOCO | Weekly Breakout Analysis📉 Yellow Line — Weekly Counter-Trendline (WTF CT) resistance finally broken with conviction. This line guided the entire downtrend and its breach signals a strong structural shift.
📈 Red Parallel Channel — A hidden resistance channel formed during the recent consolidation phase. Price climbed within this tight range and has now broken out, confirming internal strength and directional intent.
🟧 Orange Horizontal Line — Major Monthly Time Frame (MTF) resistance, which now acts as the next crucial target. The breakout candle has enough space to breathe before testing this overhead level.
⚪ White Dotted Line — Daily Time Frame (DTF) counter-trendline that had already been broken earlier, providing early signs of reversal. Serves as a great precursor to the higher timeframe breakout.
📊 Volume: Weekly breakout accompanied by ~5.57M volume — exceeding the 50K benchmark required for WTF breakout validation. Strong institutional interest is evident.
🟩 Structure: Price has formed a higher low base and broke out cleanly above all marked resistances — a sign of strength across all timeframes.

Clean Breakouts Don’t Lie — TFCILTDSupport Trendline holding beautifully from mid-2021.
CT (Counter Trendline) broken decisively this month with strong volume ✅.
Supply-Demand Zone (marked in green) retested and held.
Hidden Line (dotted pink) showing internal resistance structure — now taken out 🔥.
Current Structure:
A classic breakout with multiple confirmations — trend support, supply zone defense, CT break, hidden resistance breach — aligning well together.
🚀 As always, follow strict risk management. No trade is sure-shot — but structures like these offer probability edges.

Sunday Swings 27 April | Stocks and NiftyI make educational content videos for swing / positional trading
No calls, tips or future predications are done in this video .

GMR AIRPORTS LTD - Cup & Handle Breakout! 📈 Chart Overview:
The stock has formed a Cup & Handle pattern, confirming a bullish breakout.
A downtrend resistance has been breached, signaling strong buying interest.
🔍 Key Levels:
Resistance Levels: ₹87.19, ₹90.78, ₹90.86
Support Levels: ₹79.05, ₹75.10, ₹74.96
📊 Observations:
Volume spike supports the breakout, increasing reliability.
RSI at 74.40 indicates overbought conditions, so a slight pullback before further upside is possible.
The risk-reward ratio is favorable, with defined stop-loss and targets.
🚀 Trading View:
If the price sustains above ₹79.05, it can move towards ₹87-₹91 levels.
A retest of the breakout level (₹79) could provide a buying opportunity.
📌 Disclaimer: This is for educational purposes only. Always do your research before making investment decisions.

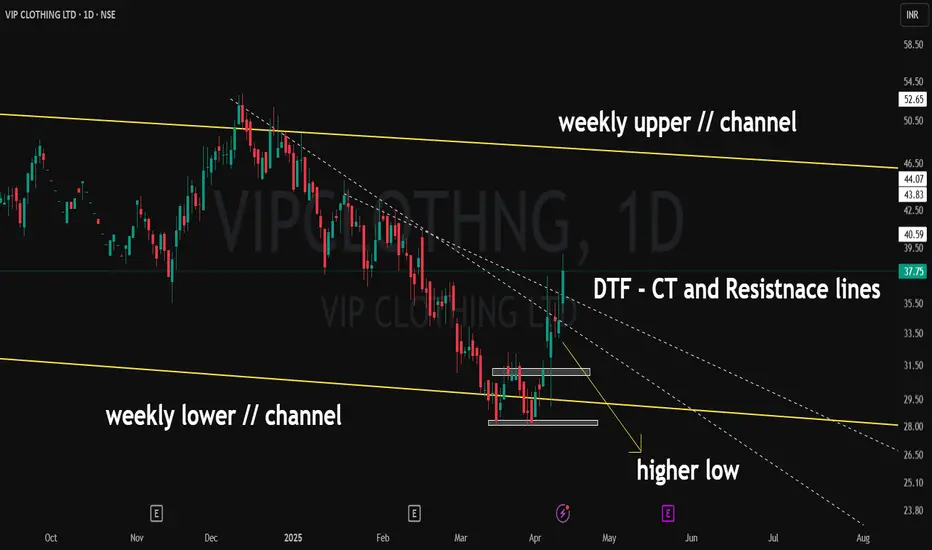
Vip Clothing - Power Breakout🟡 WTF Parallel Channel
The stock was respecting a long-term descending parallel channel (yellow lines), and recently took support off the lower boundary.
📉 Higher Low Formed
It created two clear demand zones (marked boxes), confirming higher lows — a classic signal of accumulation and reversal strength.
📊 Supply Zone Broken
Not just any breakout — it smashed through the supply zone with strong bullish candles, showing conviction and volume support.
📐 Trendline Breakout
Today, it broke out of the counter trendline (CT) and the descending resistance (2 dotted lines) — both gone in a single strong move, putting it in a clear breakout zone.
🎯 What's Next?
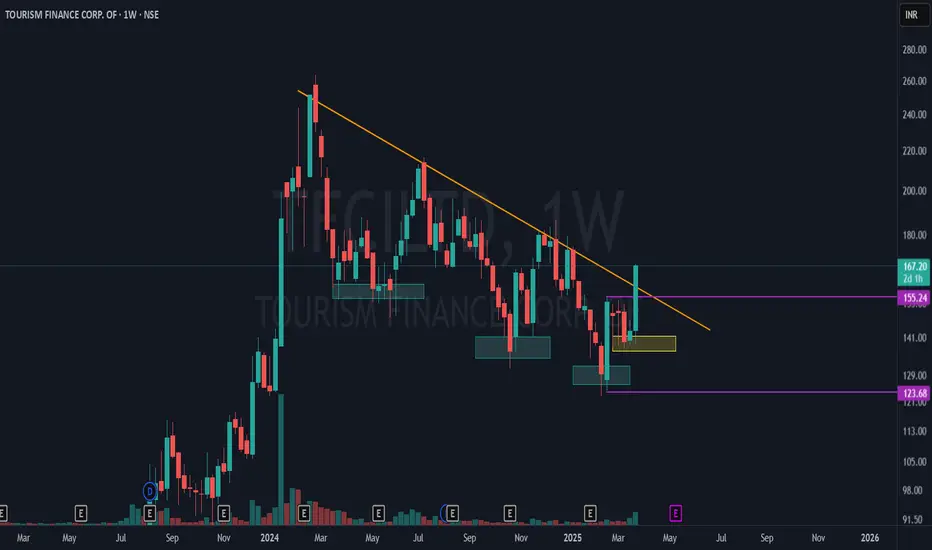
Tourism Finance Corp - Major Breakout in Progress!TFCI is showing a significant market structure shift on the weekly time frame (WTF) with strong confluence of technical signals! 📊
🔹 Lower Lows to Higher Low Transition:
Blue boxes indicate a series of lower lows, reflecting a prior downtrend.
The yellow box highlights a higher low, signaling a potential trend reversal!
🔹 Mother Candle Breakout:
The purple lines mark the high and low of the mother bar (key range).
Price is now breaking out from the upper side of the mother candle, confirming bullish momentum.
🔹 Counter Trendline (CTL) Breakout:
The orange line represents the main CTL on the weekly timeframe.
Price is successfully breaking out, indicating a potential trend shift to bullish!
Comment below your thoughts
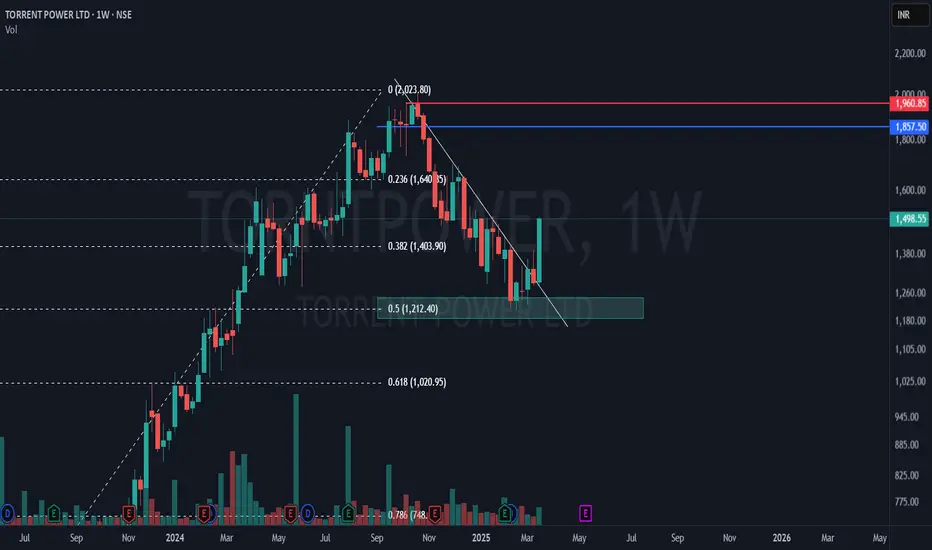
Torrent Power – 50% Fibonacci Retest & Breakout Play!📊 Technical Breakdown:
🔹 50% Fibonacci Retracement at ₹1,212 – a crucial support where buyers stepped in!
🔹 Falling trendline breakout with a massive +16.06% green candle – trend reversal confirmation?
🔹 Volume surge suggests strong buying interest but relatively still lower than as it used to be in this stock year ago
🔹 Blue and Red lines are nearest supply zone created by a weekly and monthly time frame
L&T Finance Weekly Breakout Setup 🔹 Green Line – The weekly support held strong, giving a perfect WTF (Where's The Floor) bounce.
🔹 Supply Zone (Blue Box) – This crucial resistance has now been broken out convincingly.
🔹 Red Line – A CT (Counter-Trendline) breakout with solid volume confirmation.
🔹 Bright Blue Line (MTF Resistance @ 185.82) – The toughest resistance, but it's far from the breakout zone, making this a high-RR trade idea.
🔥 Unique setup with multiple confluences! Volume spike adds conviction. Can bulls sustain the momentum? 🤔
📈 What’s your take on this breakout? Comment below! 👇

Simple weekly time frame swing trade idea I make educational content videos for swing / positional trading

Simple price action based swing trading idea for 10 March 2025I make educational content videos for swing / positional trading

Unique way of Trading the Broadening Patterns with examplesI daily make educational content videos for swing / positional trading

Pre and Post Breakout with Pattern trading I make educational content videos for swing / positional trading

2 Stocks Price action for 30 Jan 2025 I daily make educational content videos for swing / positional trading

Amazing swing trading stocks for 29 Jan 2025I daily make educational content videos for swing / positional trading

3 Swing Trading ideas that can give you Amazing Returns I daily make educational content videos for swing / positional trading
