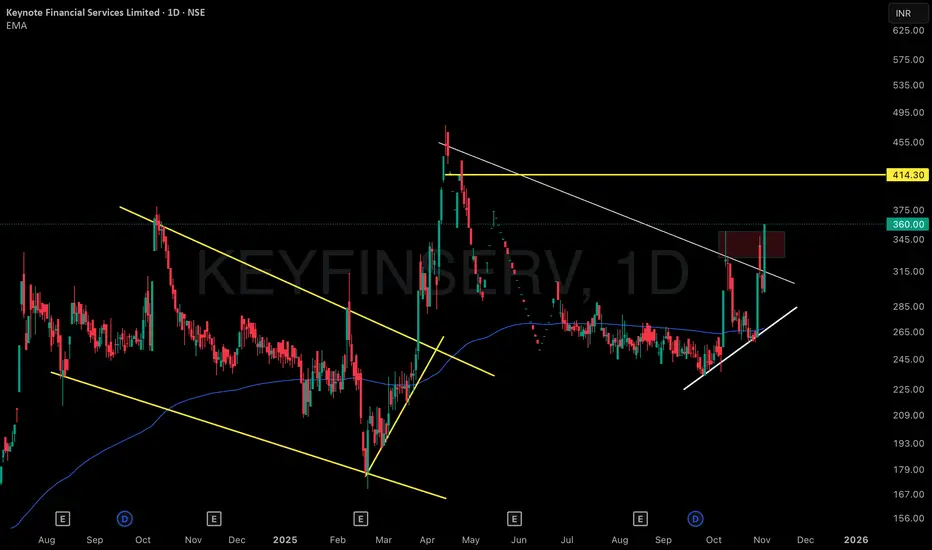
Recurring VCP Structures: Multi-Phase Consolidation & Expansion1 . This chart distinctly showcases a series of visually captivating Volatility Contraction Patterns (VCPs) across multiple phases, elegantly demarcated by yellow trendlines that map out both historical and present consolidation zones. Each contraction zone is marked by repeated, precise touches on trend boundaries, reflecting steady accumulation followed by eruptive volatility and sharp price expansions—almost like a pattern “echo” cycling through the chart.
2 . The highlighted VCP structures reveal not just one, but several contraction-and-expansion cycles, creating an intricate tapestry of market behaviour. Note how each phase includes a concentrated period of sideways price movement, where activity compresses before unleashing swift, directional breakouts. The interplay of these phases turns the chart into a textbook reference for sequential VCP observation, with periods of quiet consolidation—almost like calm before a storm—setting the stage for pronounced volatility bursts.
3 . Recent activity amplifies this effect: vivid volatility swings transition rapidly into tight consolidation, echoing earlier pattern cycles and further emphasizing the recurring structural nature. These technical formations, combined with strong boundary touches and clear momentum surges, make the chart an excellent study in pattern recognition, volatility monitoring, and visual market structure analysis—all shared purely for observational insight, with no predictions or directional bias.
Breakout
BUY TODAY SELL TOMORROW for 5%DON’T HAVE TIME TO MANAGE YOUR TRADES?
- Take BTST trades at 3:25 pm every day
- Try to exit by taking 4-7% profit of each trade
- SL can also be maintained as closing below the low of the breakout candle
Now, why do I prefer BTST over swing trades? The primary reason is that I have observed that 90% of the stocks give most of the movement in just 1-2 days and the rest of the time they either consolidate or fall
Resistance Breakout in SIYSIL
BUY TODAY SELL TOMORROW for 5%

BITCOIN TECH UPDATE: BEARISH DOMINATES MUST READ🚨 BTC TECH UPDATE: BEARISH DOMINATES MUST READ 🚨
CRYPTOCAP:BTC is down 14% from my bearish short at $115,000 retest.
✅ Those who shorted, well played.
✅ Those who avoided longing at the top, capital saved.
Price Action:
#BITCOIN hit 1st support and broke below, trend remains bearish.
Next target: $94,000.
Short-Term Relief:
Expect a bounce toward $105,000–$108,000 (retest + FVG zone) before the next leg down.
Longer-Term:
$94,000 key decision zone → potential drop to $76,000 if bearish momentum continues.
Will update with precision once $94k is reached.
Sentiment: Bearish as forecasted from $115k.
Bullish Trigger:
If BTC breaks $111,500 with HTF candle close, bullish scenario activates → potential ATH toward $150,000.
Trade smart. Watch levels. Manage risk.
Your move: Ride the bearish wave or wait for the relief rally?
NFA & DYOR

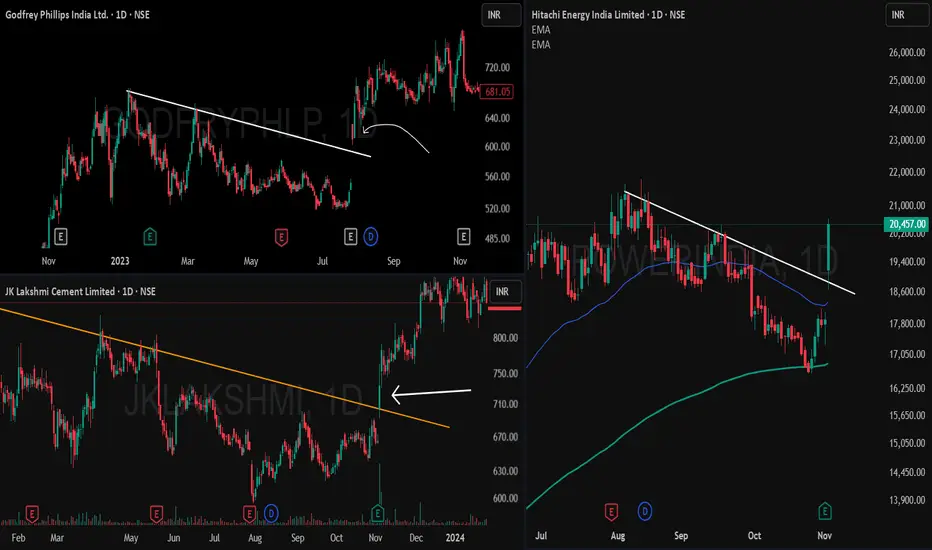
Breakaway Gap Up Breakout — A Powerful StudyThis post analyzes breakaway gap up breakouts with multiple chart examples, illustrating how price leaps above well-tested trendline resistance without a retest, triggering strong upward momentum.
Main Report
What is a Breakaway Gap Up Breakout?
A breakaway gap up breakout occurs when the price gaps above a resistance trendline that has been tested multiple times, but instead of interacting with the resistance, the price opens substantially higher, leaving a noticeable gap. This phenomenon signals strong demand and often marks the beginning of a sustained price rally
Chart Observations
- Left-side examples (Godfrey Phillips & JK Lakshmi Cement):
Both charts show prices repeatedly hitting a descending trendline resistance. Unlike typical breakouts, the price did not touch or retest the resistance before breaking out; instead, it jumped above with a clear gap up. This is the classic signature of a breakaway gap. Following the breakout, continuation moves are observed, confirming the bullish momentum.
- Right-side example (Power Grid Corp):
Here, the price similarly clears a major resistance following several rejection points. The breakout is accompanied by a gap and swift follow-up buying, exemplifying the reliability of the breakaway gap pattern
Key Traits of Breakaway Gap Ups
-Occur after prolonged resistance tests.
-Price gaps above resistance without retesting or shadowing.
-Often lead to strong follow-through and trend continuation.
-Frequently signal institutional participation or a major sentiment shift.
Raghav Productivity Enhancers Ltd | Weekly VCP Breakout | Moment🏭 Company Overview
Raghav Productivity Enhancers Ltd (NSE: RPEL) is India’s leading producer of silica ramming mass, a key refractory material used in steel manufacturing furnaces. The company operates modern facilities with global quality standards, catering to both domestic and international steel producers.
Fundamental Keys
Company's market cap ₹35,887 Cr
PE Ratio : High Valuation (78.90)
Price to sales: >15.75
ROE: >30% Excellent
ROA: >26% Good
Net Profit Margin: >19% Good
Operating Margin: >45% Good
EBITDA Margin: >28% Good
Debt-to-Equity: 0.0279 (debt-free profile)
Quick Ratio: 3.67
Cash Ratio: 0 (working capital tightness)
Debt to EBITDA: 0.098 Good
Annual sales have increased for 3 consecutive years.
Quarterly revenue trending upward for 5 years.
Strong balance sheet with growing total assets and minimal debt.
Financially robust with excellent profitability and asset efficiency.
Valuations are stretched, but strong earnings momentum supports short- to medium-term bullish sentiment.
Technical Analysis (Weekly + Daily)
Stock formed a perfect VCP (Volatility Contraction Pattern). A series of tightening swings leading to a breakout with a massive green candle.
Breakout candle closed near high - shows conviction buying.
Volume expansion on breakout confirms institutional participation.
Price now comfortably trades above key resistance zone (~₹740) flipping previous resistance into new support. All moving averages aligned bullishly with expanding volume signaling a high-probability breakout continuation.
Price trades above 9, 20, and 50 EMA - bullish alignment. ADX is showing healthy trend strength. RSI mildly overbought, typical for breakout continuation. MACD confirmed strong bullish crossover. Weekly volume surged to ~995K, 3× above average clear sign of institutional activity. Daily volume >615K confirms multi-timeframe buying interest.
Swing Trade Plan : For 1-3 weeks
Breakout Aggressive Entry: ₹795–805 On (close above breakout high)
Retest Entry: ₹740–760 (On low-volume retest of breakout zone)
Stop-Loss ₹650 Below 50 EMA / prior base
Target 1: ₹850–880 (First resistance zone)
Target 2: ₹950–1,000 )Measured flag projection)
Trailing Strategy:
Move SL to ₹740 after T1 achieved.
Trail below 9 EMA (daily) as price trends higher.
Exit if weekly candle closes below 20 EMA with volume expansion.
⚠️ Disclaimer
This analysis is for educational and research purposes only. It is not financial advice. Always conduct your own due diligence and use proper risk management.

Price Halts and Power of Confluence The price chart displays a noteworthy transformation as a previous supply zone evolves into an area of strong demand, illustrating a crucial market shift. The highlighted supply region, which had earlier capped price advances and attracted selling interest, has now transitioned into a price zone where buyers are stepping in, creating multiple reactions that signify growing demand as prices revisit this level.
- Supply to Demand Conversion: The red-shaded supply band acted as a ceiling for prices historically, but recent moves show price halting and consolidating above this region, marking a critical change in the market’s balance. This type of consolidation—where price compresses and pauses just after clearing a major supply area—is a visible sign of acceptance by market participants, as both buyers and sellers reassess value at this pivotal zone.
- Consolidation as Price Stability: Observing the price action post-supply area, there is clear evidence of tight, sideways movement—an area of price equilibrium or market indecision. This consolidation signals an important digestion phase, a hallmark of healthy price action
- Trendline Confluence: The thick green upward trendline adds a second layer of technical strength to this setup. Historically, prices have repeatedly taken support on this trendline during corrections, aligning perfectly with the newly converted demand area. This intersection of the time-based trendline with the horizontal supply/demand zone forms a strong confluence. Confluence zones like this are typically high-probability areas of interest, as the overlap of structural (trendline) and behavioral (supply/demand) features amplifies the significance of the region and attracts greater participation from market players.
-

$LTC to $500–$1000? Could Explode in the Next Alt SeasonCRYPTOCAP:LTC to $500–$1000? Could Explode in the Next Alt Season
CRYPTOCAP:LTC has been slow-growing, but I see strong potential here. I’m holding tight.
Imo, CRYPTOCAP:LTC could easily hit $500 during the next alt season. If it drops below or near $90, that’s a solid opportunity to accumulate for long-term gains.
A 10x from here isn’t impossible: $500–$1000 is within reach, but it will require patience.
Worth noting: CRYPTOCAP:LTC didn’t hit a new ATH after the 3rd halving, unlike the first two, which reached new highs within about 1000 days. This suggests there’s still a real chance for CRYPTOCAP:LTC to hit a new ATH within the next one Year.
Stay patient, plan your entries, and don’t get caught up in FOMO.
⚠️ Disclaimer: NFA. Crypto is risky. DYOR and only invest what you can afford to lose.

Volume Contraction Pattern Amidst Dual TrendlinesThe chart reveals important price structure and behavior over the past 18 months, featuring both a prominent counter trend line (marked in red) and a long-term support trendline (marked in green). Each element signifies distinct phases of supply absorption and buyer interest.
• Counter Trend Line (Red): This line has consistently acted as a pivot for multiple lower highs, reflecting the presence of vigilant sellers at each attempt to move higher. Multiple reaction points along this line indicate repeated supply emergence whenever price approached the zone, especially after sharp rallies earlier in the trend.
• Support Trend Line (Green): The green upward-sloping line marks sequential higher lows. This support axis has been respected multiple times, hinting at growing accumulation at each retest despite temporary price weakness in the broader market. The curvatures at lows (forming cup-like bases) display periods of volatility contraction and constructive price action as buyers step in at successively higher prices.
• VCP Dynamics: The pattern visible in the chart exhibits systematic contraction in the price swings. Each corrective structure—characterized by the curved reactions at support—shows a shrinking amplitude in both price and volume. This VCP sequence typically points toward consistent supply absorption, with sellers getting exhausted at lower levels after each contraction. The emergence of strong green candles with above-average volume near the support line often signals a revitalization of demand forces, as seen recently.
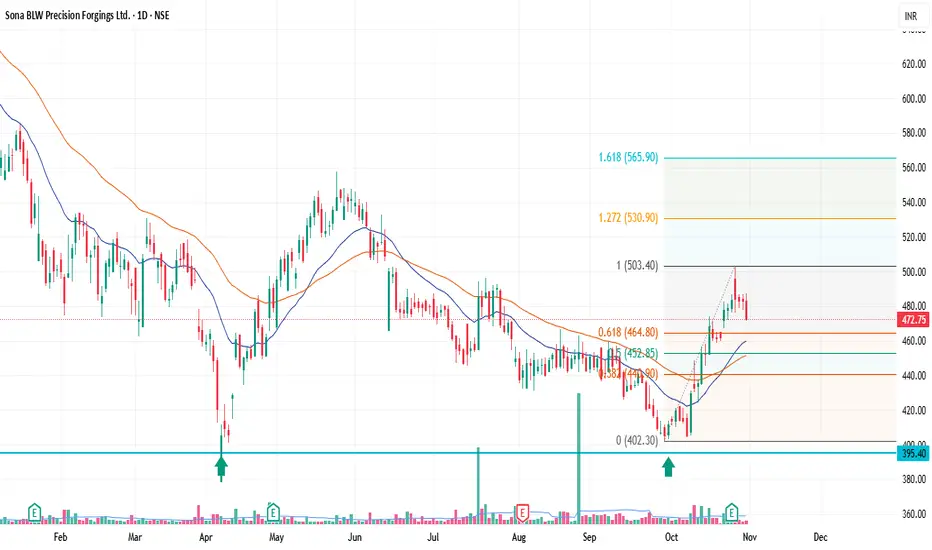
Sona BLW Precision Forgings Ltd. (SONACOMS) — pullback setup(SONACOMS) — Bullish Pullback Setup
📅 Timeframe: 1D | 💰 CMP: ₹472.75 | 📈 Volume: Above average
Technical View
Sona BLW has completed a strong impulse wave from ₹402 → ₹503, followed by a healthy pullback.
Price is now retracing near the 0.618 Fib level (₹464.8), aligning with the 21EMA — a zone that often acts as support during trend continuation.
Volume on the breakout was strong, showing accumulation interest.
Trade Plan
Entry Zone: ₹465–₹470
Stop Loss: ₹450 (below 0.5 Fib and 20EMA)
Targets:
🎯 T1: ₹503
🎯 T2: ₹530 (Fib 1.272)
🎯 T3: ₹566 (Fib 1.618)
Summary
✅ Uptrend resumption likely if ₹450 holds
✅ Rising 21EMA & 50EMA support the structure
✅ Strong breakout volume confirms institutional buying
Bias: Bullish
Risk–Reward: ~1:2.5+
Invalidation: Close below ₹450
Disclaimer : Risk management is crucial in this volatile market, so keep position sizing appropriate. This analysis is intended for educational purposes and not financial advice.
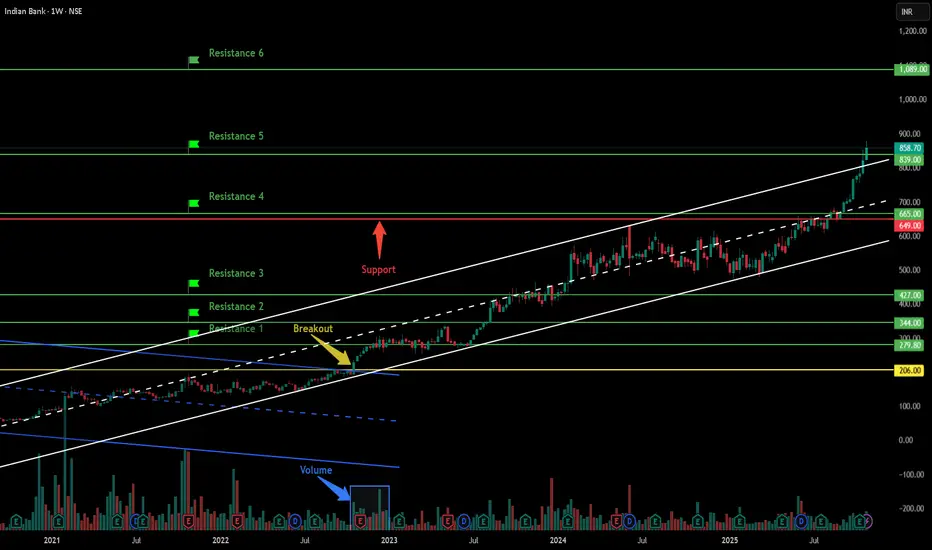
Indian Bank - Breakout Setup, Move is ON...#INDIANB trading above Resistance of 839
Next Resistance is at 1089
Support is at 649
Here are previous charts:
Chart is self explanatory. Levels of breakout, possible up-moves (where stock may find resistances) and support (close below which, setup will be invalidated) are clearly defined.
Disclaimer: This is for demonstration and educational purpose only. This is not buying or selling recommendations. I am not SEBI registered. Please consult your financial advisor before taking any trade.
Precision Wires (M): Strongly Bullish (ATH Breakout)The stock has decisively broken out of a 10-month consolidation range, creating a new All-Time High (ATH) on exceptional volume. This signals the potential start of a new, major uptrend.
📈 1. The Long-Term Context
- Sideways Trend: The stock was in a prolonged sideways consolidation phase starting from January 2024.
- Volume Contraction: During this sideways period, volume was "drying up," which is a classic bullish sign of seller exhaustion and accumulation.
- The "Lid": This consolidation formed a strong horizontal resistance level that capped all rally attempts throughout the year.
🚀 2. The Decisive Breakout (The October 2025 Event)
In October, the stock broke this pattern with explosive force:
- Massive Surge: The stock surged 23.11% in a single move.
- Exceptional Volume: This surge was backed by massive, high-conviction volume of 24.51 Million shares, confirming strong institutional interest.
- ATH Achieved: This move pushed the stock to a new All-Time High and, most importantly, closed firmly above the horizontal resistance that defined the 2024 & 2025 trading range.
📊 3. Key Technical Indicators
The underlying momentum supports this bullish breakout:
- EMAs: Short-term Exponential Moving Averages are in a "PCO" (Price Crossover) state, signaling a new, strong bullish trend.
- RSI: The Relative Strength Index (RSI) is rising, indicating that buying momentum is strong and accelerating.
🎯 4. Future Scenarios & Key Levels to Watch
⚠️ A Note of Caution
While the breakout is clear, we need to be cautious. After such a sharp vertical move, a "pause" or "pullback" is healthy. The primary risk to monitor is potential bearish divergence
🐂 The Bullish Case (Breakout Continuation)
- Confirmation: The old resistance must now act as new support. As long as the stock holds above this breakout level, the trend is intact.
- Target 1:₹320
- Target 2:₹410 (if momentum continues)
🐻 The Bearish Case (Breakout Failure)
- Trigger: If the breakout fails, the stock will fall back below the old horizontal resistance level (the one it just broke).
- Confirmation: A high-volume move back into the old range.
- Target: This would signal a "fakeout" and could lead to a sharp decline to the nearest support ₹170 .

$HYPE/USDT Breakdown Confirmed: 30–60% Downside Incoming!$HYPE/USDT Breakdown Confirmed: 30–60% Downside Incoming!
Price broke critical support + completed a bearish retest. I'm positioning for a 30-60% correction from current levels.
TARGET ZONE: $20-$25
Why I'm Bearish Short-Term:
✅ Support turned resistance after break
✅ Already pumped 500%+ in 6 months - early holders are rotating out
✅ Clear distribution pattern forming
✅ Risk/Reward heavily favors shorts here
THE NUCLEAR WARNING: Almost $500M worth of tokens unlocking in the next 28 days.
This isn't FUD - this is math. That kind of supply hitting the market? You do the calculation.
Long-Term Perspective:
$20 zone could be THE generational entry for patient money. But right now? Let the distribution play out.
GETTEX:HYPE Distribution Phase Confirmed? 👇
NFA & DYOR

$LINEA WARNING: Bearish Pressure + Accumulation Opportunity Ahea$LINEA WARNING: Bearish Pressure + Accumulation Opportunity Ahead!
Chart Analysis Recap:
Previous exit signal: $0.025 → #Linea is now ~50% down ✅ confirms chart-based strategy.
Current trend: Super bearish; expecting further downside 20%-40% before the next upward leg.
Long-Term Potential:
@Linea.eth could give 10x returns, targeting $0.1–$0.2, but success depends on smart entry points.
Key Strategy:
Ideal accumulation zone: below $0.01 for long-term holders.
Trade smart, enter on hard dips and manage risk.
Takeaway: Patience + technical discipline = positioning for potential massive upside.
NFa & DYOR

$XPL ALERT: Bearish Now, Massive Accumulation Ahead?AMEX:XPL ALERT: Bearish Now, Massive Accumulation Ahead?
Current Chart View:
AMEX:XPL (Plasma) is showing bearish momentum at current levels. Expect a potential 30%-50% downside, which could create a high-probability accumulation zone for strategic investors.
Key Resistance: $0.32 (blue trendline)
Only a close above $0.32 on higher timeframes (HTF) will trigger a bullish trend reversal. Until then, bears are in control.
Targets if Bullish Breakout Occurs:
Short-term: Price clears $0.32 → bullish momentum resumes
Long-term: $2 possible if price sustains above $0.32
Trading Strategy:
Accumulate in the lower support zone for maximum risk-reward
Wait for HTF confirmation above $0.32 for safer long positions
Watch volume & momentum for breakout validation
Market Insight:
AMEX:XPL offers strategic accumulation potential now, but patience is key. The next bullish move depends entirely on HTF breakout confirmation.
NFA & DYOR

Will SUI/USDT hit $20 in current bull market or future?SUI Testing Final Demand Zone: Reversal Imminent?
SUI is currently testing a major re-accumulation zone around $2.1 – $1.8, which previously acted as a strong demand area.
A liquidity grab below this level could trigger a sharp reversal, similar to the last time price swept lows before a massive rally.
The structure remains valid as long as this zone holds.
Once price reclaims the $2.7–$3.0 resistance, momentum could shift strongly bullish, targeting the $4.8 zone, and eventually the $20 macro target if the trend continues.
Support: $2.1 – $1.8
Resistance: $2.7 / $4.8
Macro Target: $20
Of course, NFA & Always DYOR

Indraprastha Medical Ltd | Bullish Flag Breakout | Swing SetupCompany Overview (Fundamental)
Indraprastha Medical Corporation Ltd (IMCL) operates under the Apollo Hospitals Group and manages the Indraprastha Apollo Hospital, New Delhi — one of India’s largest multi-specialty hospitals. Company financially strong, consistent profitability, improving margins, and low debt.
Fundamentally stable company with consistent earnings and a defensive sector (Healthcare).
Strong base for technical breakout follow-through.
💰 Market Cap: ~₹5,400 Cr
📈 Revenue Growth (YoY): +16% (Strong Growth)
💸 Net Profit Margin: ~10–12% (steady)
💵 Debt-to-Equity: 0.05 (virtually debt-free)
📊 ROE (Return on Equity): ~20%
Technical Overview
The setup represents a bullish continuation phase, with EMAs stacked positively and volume confirming accumulation.
Price trades above all 3 key EMAs (9, 20, 50) — strong bullish alignment.
Formation of a textbook Bullish Flag Pattern after a sharp pole rally from ₹460 to ₹610.
Recent candle closed bullish with +3.4% gain and high volume (2.48M) — indicating renewed buying interest.
RSI ~60 → Momentum healthy and not overbought.
MACD positive crossover developing, confirming bullish trend strength.
Price Action Analysis
Clean, bullish, momentum-driven move with volume confirmation.
Buy on dip near breakout retest at ₹580-583
Book Partial profit at ₹625–630
target 2: ₹655–660 this will be Flag breakout projection.
A perfect risk to reward ratio following.
Disclaimer
This analysis is for educational and research purposes only — not investment advice.
Always do your own due diligence and manage risk before trading.

Major Counter Trendline Structure, Strong Channel & Demand FlipThe weekly chart for Chennai Petroleum Corporation Ltd (CPCL) presents a robust technical development without classic breakout language.
-Price action has respected a prominent red counter trendline, with the latest move representing a shift in momentum against the prior trend.
-A clean parallel channel with dotted lines has formed, indicating sustained price progression and orderly accumulation over several months.
-There's a key supply-demand conversion zone, now acting as a pivotal support area after functioning as resistance. This is where previous selling interest is replaced by renewed buying activity.
-Notably, volumes are surging in alignment with this move, confirming broad participation and strong conviction among buyers.

RBLBANK ( M ) BREAKOUTStock Name : RBL BANK ( M )
Friends, after a long time, this stock has broken out in the monthly time frame after about five years and eight months. This type of breakout is considered very strong and there are only two days left for the completion of this month's candle. So we can consider this as a complete breakout. If you look at the range of the breakout, it was Rs 180. Then you can add the stock to your watch list.
Target 1 : 396 - 400
Target 2 : 475 - 500
Note: Our posts are posted for learning purposes. You will be responsible for any profit or loss you make from the advice given in the channel. Before investing in the stock market, you must consult your financial advisor.
WE ARE NOT A SEBI REGISTERED

Objective Observation in Sideways Markets1) Sideways market action is clearly depicted here, with price oscillating between well-defined resistance and support bands (marked by orange horizontal lines). The presence of both multiple resistance and support levels typifies a range-bound environment, where relying solely on single breakout/CT patterns may lead to inconsistent observations.
2) To supplement this, a solid red counter-trendline has been drawn across recent swing highs/lows, offering a direct visual of shifting momentum pockets. In sideways phases, such counter-trendlines might limit or expand their analytical usefulness, depending on whether price respects or ignores these boundaries within the broader “box”.
3) Further, layering a secondary dotted formation—a small broadening pattern—provides additional observation reference points. Using both counter-trend and minor broadening structures together helps in mapping probable price responses at key junctions, especially when horizontal supports/resistances cluster.
4) By objectively tracking these intersections and reactions—rather than expecting a directional resolution—traders gain more nuanced insight for potential tactical responses on future moves. No forecasts here; just systematic, multi-pattern observation.
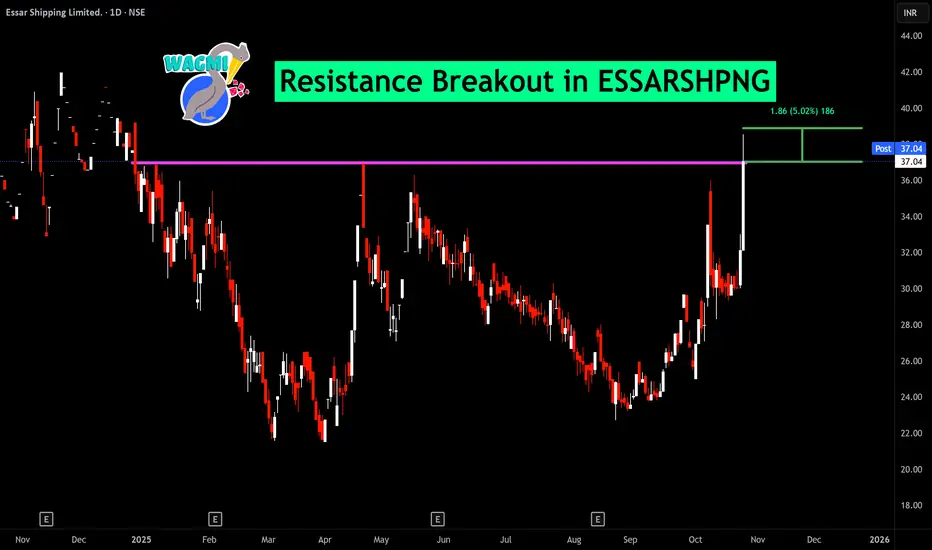
BUY TODAY SELL TOMORROW for 5%DON’T HAVE TIME TO MANAGE YOUR TRADES?
- Take BTST trades at 3:25 pm every day
- Try to exit by taking 4-7% profit of each trade
- SL can also be maintained as closing below the low of the breakout candle
Now, why do I prefer BTST over swing trades? The primary reason is that I have observed that 90% of the stocks give most of the movement in just 1-2 days and the rest of the time they either consolidate or fall
Resistance Breakout in ESSARSHPNG
BUY TODAY SELL TOMORROW for 5%
MRPL Triangle BreakoutMRPL has given a Breakout after forming a Triangle Pattern on 1D timeframe with very high volumes. The stock is also trading above its 200EMA.

Jaicorp ltdCup handle pattern with good volume in green days,
Negative days low dry volume .
178 resistance if it break then easily move more up side
Stop loss below handle
9%

BUY TODAY SELL TOMORROW for 5%DON’T HAVE TIME TO MANAGE YOUR TRADES?
- Take BTST trades at 3:25 pm every day
- Try to exit by taking 4-7% profit of each trade
- SL can also be maintained as closing below the low of the breakout candle
Now, why do I prefer BTST over swing trades? The primary reason is that I have observed that 90% of the stocks give most of the movement in just 1-2 days and the rest of the time they either consolidate or fall
Consolidation Breakout in KFINTECH
BUY TODAY SELL TOMORROW for 5%
