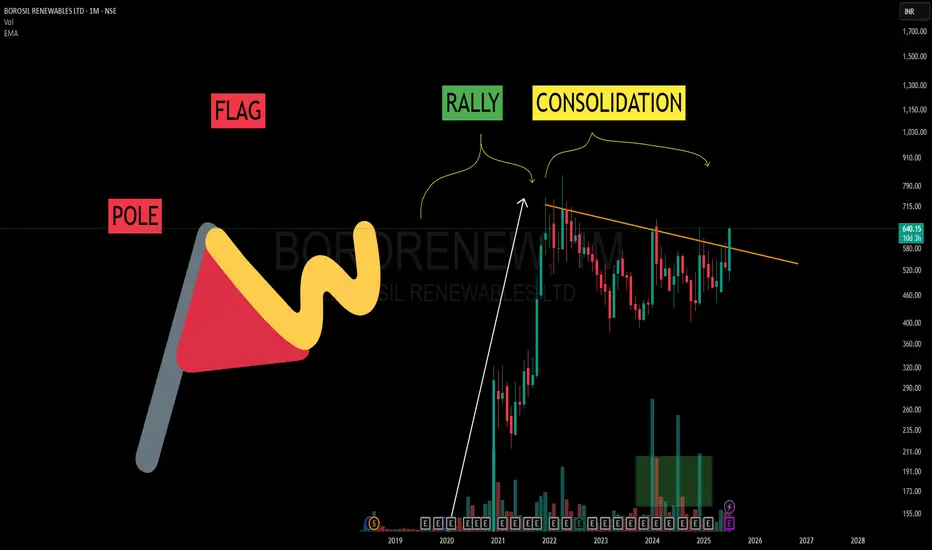
Flag, Pole and Patience– Learning from the Bigger TimeframeIn trading, patterns on higher timeframes often carry deeper meaning.
What you’re seeing in this chart isn’t a forecast — it’s a learning opportunity.
Let’s break this down:
🔺 POLE:
This sharp rally from 2020–2022 represents a strong burst of momentum. That’s your Pole — it shows clean directional intent from market participants.
🏁 FLAG:
After the rally, price didn’t crash — it started consolidating. This sideways or slightly downward structure is known as the Flag.
It often appears as a phase of “cooling off” — traders taking profits, new buyers waiting.
📈 RALLY + CONSOLIDATION = Classic Flag & Pole
A rally followed by consolidation = textbook flag structure.
⏳ And here’s the takeaway:
When viewed on a Monthly (WTF - Way Too Far 😅) timeframe, these patterns take years to form. But that also means they carry weight.
No predictions here. Just learning.
Understanding market rhythm through structure > outcome can be your edge.
Breakout
Gold Prices Rise Amidst USD WeaknessAmong precious metals, prices are increasing due to the weakening of the USD. There are no negative scenarios for gold in the medium term, considering the current developments: US government spending is out of control, ongoing trade tensions, uncertain inflation, and increasing criticism aimed at the Fed.
As of the time of writing, gold has risen by 0.3% in the past 24 hours, equivalent to an increase of 100 pips, currently trading at 3,350 USD.
The current environment is highly favorable for gold, especially as investors lose confidence in the stability of US monetary policy. If the Fed begins to concede to political pressure, gold prices could break previous highs and head toward 3,440 USD/ounce in the short term.
Do you agree with this view?

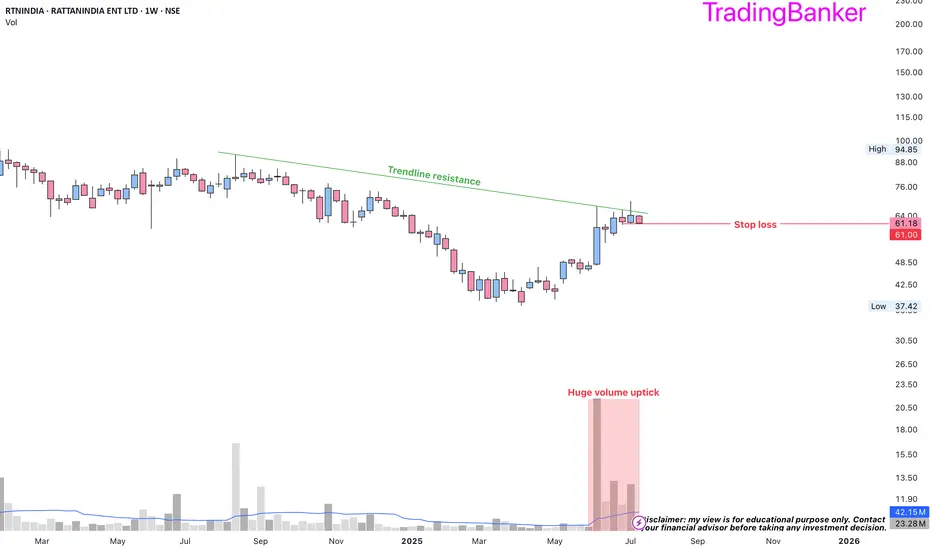
RTNINDIA: high reward to risk ratio➡️heavy volumes and big candles are the footprints of institutions
➡️Fund raising approved for business opportunities
➡️entry price 62.75 with a SL of 61
➡️since the #breakout was not confirmed, moved my SL within a few percentage points
will $LTC/USDT ready for $500 in bull run?CRYPTOCAP:LTC Took Off from $55 — Now Gaining Momentum Again, and $500 Might Be Closer Than You Think
CRYPTOCAP:LTC has delivered strong gains from both our entries:
✅ First entry at $55 — now up 140%
✅ Second entry at $70 — currently up 85%
Currently, CRYPTOCAP:LTC is trading around $117, sitting right at a key resistance level.
If this resistance breaks, we could see a strong rally toward $300–$500 in this bull run.
My Target:
I’m still expecting $500 as a realistic target and anything beyond that is a bonus.
NFA & DYOR

Elliott Wave Insights: Clearly indicates the Analytical approachHello friends,
Welcome to RK_Chaarts,
Today we're going to attempt to analyze the chart of Biocon Limited. Clearly, on the monthly timeframe, we can see that we've completed wave ((3)) and wave ((4)), which are of primary degree, marked on chart in Black color. We're currently unfolding wave ((5)), which will have five sub-divisions on the weekly timeframe. The weekly chart also shows that we've completed wave (1) and wave (2) of intermediate degree which we've marked in Blue, and wave (3) has begun, possibly indicating a breakout on the weekly chart. This breakout, having good intensity of Volumes.
Similarly, on the daily chart, we can see that we've completed sub-divisions red 1 and red 2 within wave (3), and possibly started red 3 of (3).
So, based on wave analysis, the outlook appears highly bullish, snapshots are shared below.
Possible Wave counts on Monthly
Possible wave counts on Weekly
Possible wave counts on Daily
The breakout is also accompanied by excellent volume. If we see a dip on lower timeframes, such as Hourly chart, and the price reaches a reliable moving average like the 50-EMA or 200-EMA, it could be a great opportunity to enter. Additionally, friends, we can see on the daily timeframe that a reversal chart pattern has formed and is on the verge of a breakout, with the price standing at the neckline. As soon as this breakout occurs, we can expect further additions. Snapshots are shared below.
Reversal and Bullish Chart Pattern: Inverted Head n Shoulder
Furthermore, we can see that the RSI on the weekly chart has also broken out and is above 60, indicating a strong bullish momentum. Even the MACD has shown a bullish positive crossover and is moving above the zero line on the weekly chart. Additionally, the monthly MACD is also displaying a strong bullish trend, having given a positive crossover and remaining above the zero line. These are all very positive signs. Snapshots are shared below.
RSI Breakout & above 60 on Weekly
MACD on Weekly
MACD on Monthly
We can see that on the weekly chart, the price has crossed above the major EMAs, including the 50, 100, and 200-period EMAs. Now, as the price moves towards its target, these three major moving averages are not obstacles, but rather support levels below. The fact that the price is moving above all these moving averages is a sign in itself.
Looking at the monthly timeframe, we can see that the price has also crossed above the 50, 100, and 200-period EMAs and is moving above them. This is a strong indication of the trend's strength and direction. Snapshots are shared below.
Ema monthly
Ema weekly
So, friends, if our Elliott Wave analysis is correct, and our roadmap is accurate, then as we can see, the monthly chart's wave ((3)), which is of primary degree, marked as rounded three in black, has completed its rounded ((4)) correction or retracement. Now, we're moving upwards towards wave ((5)).
If our wave count is correct, and the structure is right, then according to the theory, wave ((4))'s low, which is around 192, should not be breached. This level will serve as an invalidation level. If the price breaches the invalidation level of 192, which seems unlikely given the positive signs, our wave count will be invalidated, and we'll need to reanalyze it.
On the other hand, based on Elliott Wave theory, the projected target for wave ((5)) is typically between 123.6% and 161.8% of the length of wave ((4)). So, the price may reach or consolidate between the levels of 559 and 672, which are the projected targets based on wave theory, marking the end of wave ((5)) on the monthly chart.
This post is shared purely for educational purpose & it’s Not a trading advice.
I am not Sebi registered analyst.
My studies are for educational purpose only.
Please Consult your financial advisor before trading or investing.
I am not responsible for any kinds of your profits and your losses.
Most investors treat trading as a hobby because they have a full-time job doing something else.
However, If you treat trading like a business, it will pay you like a business.
If you treat like a hobby, hobbies don't pay, they cost you...!
Hope this post is helpful to community
Thanks
RK💕
Disclaimer and Risk Warning.
The analysis and discussion provided on in.tradingview.com/u/RK_Chaarts/ is intended for educational purposes only and should not be relied upon for trading decisions. RK_Chaarts is not an investment adviser, and the information provided here should not be taken as professional investment advice. Before buying or selling any investments, securities, or precious metals, it is recommended that you conduct your own due diligence. RK_Chaarts does not share in your profits and will not take responsibility for any losses you may incur. So Please Consult your financial advisor before trading or investing.

Chainlink’s Bull Run: Up 80% After the Dip — Is $100 the Next?Chainlink’s Bull Run: Up 80% After the Dip — Is $100 the Next Target?
If you followed my chart, you likely caught the move.
✅ We entered below $10
✅ It pumped to over $30
✅ Recently dipped near $11 and another good Profit.
It’s still up 80% from our entry zone, and I believe CRYPTOCAP:LINK still has room to grow.
My updated targets: $50 / $75 / $100
Tip: Take some profits along the way and ride the trend smartly.
NFA & DYOR

HDFC Asset Management Company Ltd - Long Setup, Move is ON...#HDFCAMC trading above Resistance of 3844
Next Resistance is at 5237
Support is at 2982
Here are previous charts:
Chart is self explanatory. Levels of breakout, possible up-moves (where stock may find resistances) and support (close below which, setup will be invalidated) are clearly defined.
Disclaimer: This is for demonstration and educational purpose only. This is not buying or selling recommendations. I am not SEBI registered. Please consult your financial advisor before taking any trade.

EUR/USD: Continuing Downtrend and Key Levels to WatchHello traders, what are your thoughts on EUR/USD?
Today, EUR/USD continues its strong downtrend, currently trading around 1.161. One of the key factors driving this decline is the strong recovery of the USD. Following the release of positive data from the US, especially the unemployment report, the market has reinforced expectations that the Fed will maintain high interest rates for a longer period. This has reduced the appeal of the euro, putting significant pressure on EUR/USD.
From a technical perspective, the price is approaching the trendline's lower limit, and a breakout at this point could push EUR/USD further down. Personally, I expect the EMA 89 area to be an ideal target for this strategy.
What about you, do you agree with my outlook? Feel free to share your thoughts, and let’s discuss!

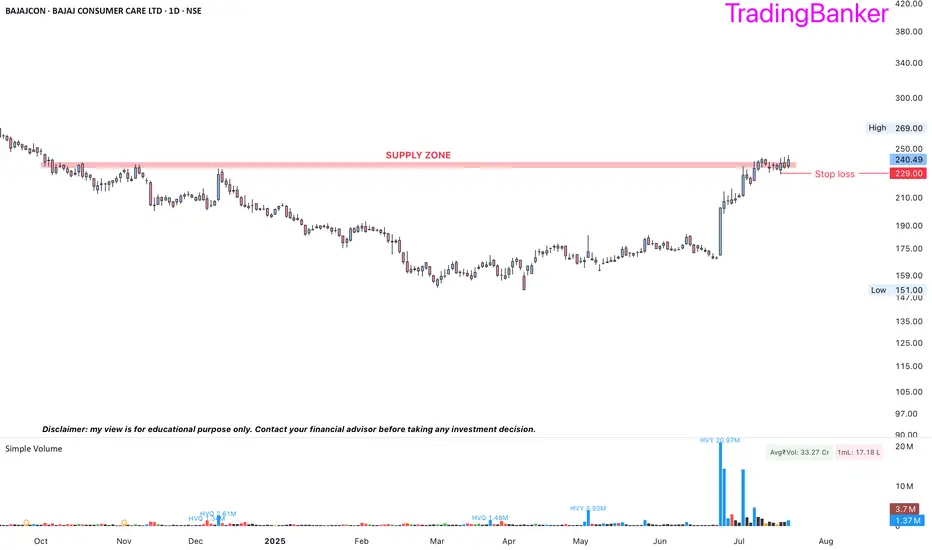
BAJAJCON: a probable long trade➡️heavy volumes and big candles are the footprints of institutions
➡️entry price 233 with a SL of 229
➡️consumption theme
➡️supply zone breakout in the offing and may turn out to be a high reward to risk trade
Powergrid - 10% Upmove possible?!!!Chart patterns suggest me the above titled opinion
1. Monthly chart shows a Mother baby candle (feb and march 2025)
2. Weekly chart too shows a good inside bar candle with good volume support and Breakout visible (shown below)
3. In daily time frame, there is an expanding channel pattern... . Higher high formed indicates a bulls edge .
4.Let's wait for the Breakout and enter the trade
5.Target levels mentioned @ chart.
This is just my opinion...not a tip nor advice...
Thank you!!!!

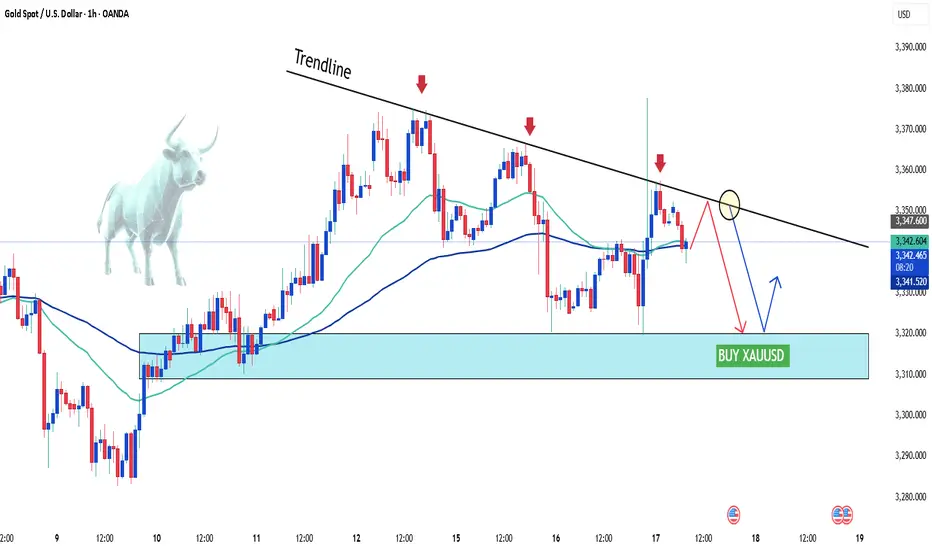
BREAK OUT GOLD On H1 frame, gold has signs of breakout, so pay attention to the support area 3342
XAUUSD BUY Zone: 3341 - 3343
Stoploss: 3337 (60pips)
Takeprofit: 3346 - 3350 - 3354

Gold's Short-Term DeclineHello everyone, what do you think about gold?
Today, gold continues its short-term downtrend. After new data was released at the end of yesterday’s trading session, the USD rose by 0.3%, and U.S. Treasury yields also increased, reducing the appeal of gold. Additionally, the latest unemployment claims data shows improvement in the U.S. economy, which has contributed to the drop in the precious metal.
As of writing, gold is trading around the EMA 34, 89 levels at 3,336 USD. With the recent news, the market is expected to maintain its current stance throughout the day, as no new significant updates are expected.
From a technical standpoint, the downtrend remains in place, with prices continuing to be capped below the trendline. The series of lower highs and lows could likely lead XAUUSD to test lower levels, with the possibility of reaching the 3,300 USD mark.
What do you think about the price of gold today? Let us know in the comments!

Gold Weekly Recap – XAU/USD OutlookOANDA:XAUUSD experienced sharp volatility last week as investors reacted to escalating U.S. tariff announcements and shifting expectations around the Federal Reserve’s rate policy. Although prices dropped early in the week, gold quickly bounced back with three consecutive bullish sessions—highlighting strong buying interest amid growing inflation fears and trade tensions.
Analysts remain split: half foresee more upside, while others maintain a neutral stance. Yet, most agree on one thing—gold continues to serve as a defensive fortress during times of uncertainty, especially with markets grappling with both fiscal and monetary headwinds.
Technically, gold is fluctuating within a tight range around 3,360 USD. While no clear breakout from consolidation has occurred, supportive factors like a weakening U.S. dollar, the U.S. national debt surpassing 37 trillion dollars, and safe-haven inflows from reserve funds are helping keep prices stable.
📍If upcoming CPI data or new tariff announcements from the U.S. further pressure the dollar, gold could test the 3,400 resistance level. Otherwise, a sideways trend may dominate if negative news is absorbed smoothly.
Trend Bias: Neutral – leaning bullish if 3,300 holds strong.
So, are you siding with the bulls or waiting for a clear breakout?
Drop your thoughts in the comments! 💬

Gold Prices Volatile Amid Economic Data and Trade TensionsGold prices saw strong fluctuations yesterday, dropping near 3,320 USD/ounce before quickly recovering and rising to 3,370 USD/ounce, a difference of about 50 USD, fueled by U.S. PPI data. However, by the end of the session, the price dropped back and is now trading around 3,340 USD/ounce, with little change compared to the same time yesterday.
The U.S. June PPI rose 2.3% year-on-year, lower than May's 2.6% increase and the forecasted 2.5%. Core PPI rose 2.6%, also lower than May's 3% and the forecasted 2.7%. Month-on-month, the PPI remained unchanged at 0%, below the 0.3% increase in May and the forecasted 0.2%, while core PPI also held steady.
This data suggests that inflation may decrease, especially after the U.S. adjusts its tax policies. Markets expect the Fed to cut interest rates in September, weakening the USD. Additionally, trade tensions between the U.S. and the EU have intensified after President Trump announced a 30% tariff on European imports, prompting a similar response from the EU.
These factors are driving investors back into gold as a safe-haven asset. Gold is expected to continue consolidating in anticipation of a potential breakout.
Dhanuka Agri.: Consolidation BreakoutDhanuka Agri.: Consolidation Breakout. CMP 1779.
Resistance at 1861/1926
Support at 1747/1648

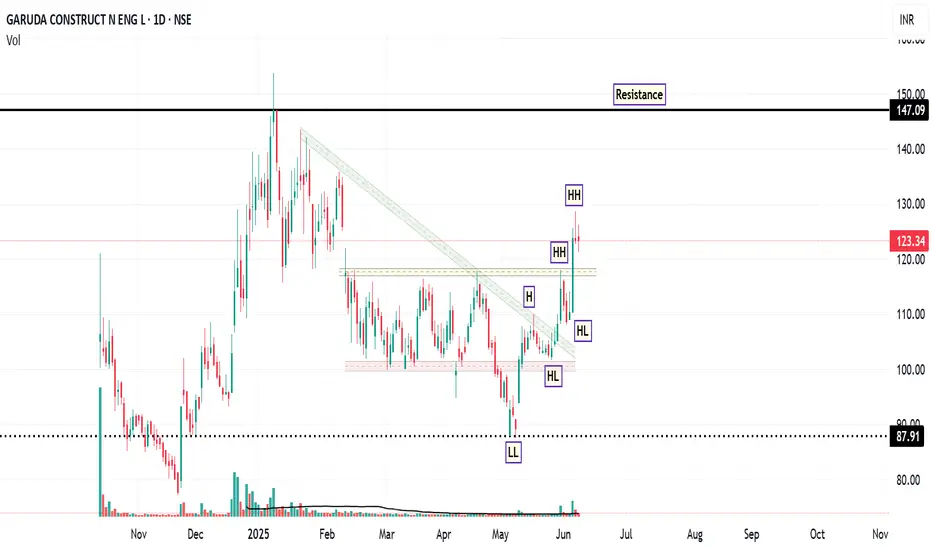
Garuda: Riding the Momentum WaveFrom February to late May 2025, the stock of GARUDA was trading in a sideways consolidation range, roughly between ₹100 (support) and ₹115-₹120 (resistance). The recent powerful green candles have shattered the upper boundary of this range. Also, the most significant event on the daily chart is the decisive breakout from a descending trendline that had capped prices. Also, LL and HH formation observed on daily chart.
The breakout was accompanied by a significant spike in volume ( 862.88K shares ), which is substantially higher than the average volume during the consolidation period. High volume on a breakout lends strong credibility to the move.
The RSI is at a strong 69.20 . It is in bullish territory and rising, indicating strong buying momentum. It is approaching the overbought region (>70), but is not there yet, leaving room for further upside before becoming extended.
If the stock consolidates above the ₹120-₹121 support level. Buyers step in on any minor dip till ₹118 , and the price then continues its upward trajectory towards the resistance targets of ₹129 and subsequently ₹149 .
Disclaimer: This technical analysis is for informational purposes only and should not be considered as financial advice. Trading in the stock market involves risk. Always conduct your own research and consult with a qualified financial advisor before making any investment decisions.
Radhika Jeweltech – Classic Contraction PatternTimeframe: Weekly
Structure Observed: Contraction Pattern between Trendlines
Volume: Significant recent uptick 📊
Key Zones:
🔴 Supply Zone above 123
🟢 Dynamic Support from ascending trendline
🟠 Active counter-trendline now breached
After months of lower highs and higher lows, the price has been squeezing into a classic contraction pattern between a descending orange trendline (acting as counter-trendline resistance) and a rising green trendline providing consistent support.
This week’s candle has decisively broken above the descending trendline on strong relative volume.
With the weekly close due tomorrow, all eyes remain on how the candle settles — will it sustain this breakout structurally or retreat below the trendline?
📌 Important Note: This is a technical observation — not a trade recommendation.

Euro Slips Further as Safe-Haven Demand for USD GrowsThe EUR/USD pair is facing strong selling pressure as global financial markets continue to reel from geopolitical and trade-related tensions. The Euro is weakening as investors increasingly turn to the U.S. Dollar as a safe haven, following a series of aggressive tariff policies announced by the United States.
Adding to the Euro’s struggles is the lack of positive economic data from the Eurozone, which has further diminished hopes for a meaningful recovery. Traders are now closely watching for monetary policy signals from both the ECB and the Federal Reserve, but so far, the bearish trend remains firmly in place.
On the technical front, EUR/USD continues to move within a descending channel, while the bearish crossover of the EMA 34 and 89 keeps sellers in control. With risk sentiment leaning defensive and capital flowing toward safe-haven assets, the pair may see further downside unless surprise bullish catalysts emerge from upcoming data or central bank remarks.

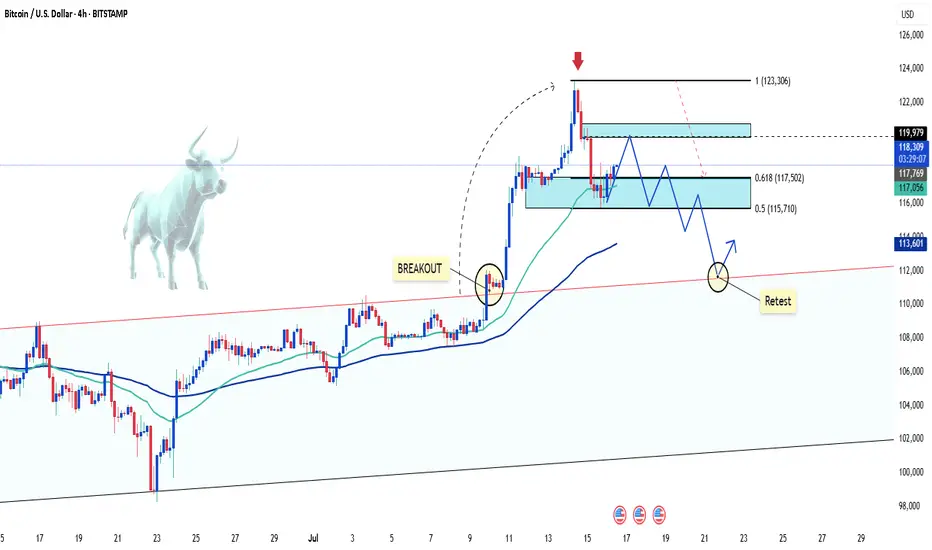
BTC/USD Pullback: What’s Next for Bitcoin?Hello, passionate and wealthy traders! What are your thoughts on BTC/USD?
After a strong surge above the 122,500 USD zone, BTC/USD has started to experience a slight pullback. This is completely normal and necessary for Bitcoin to gain new momentum.
In my personal view, the recent peak of BTC/USD signals that this correction is in play. But where do you think BTC/USD will adjust to? Personally, I believe the 111,500 USD zone is quite reasonable. It’s also the previous breakout level, and this pullback aims to test the uptrend safely.
What about you? Where do you see BTC/USD heading? Looking forward to hearing your thoughts!
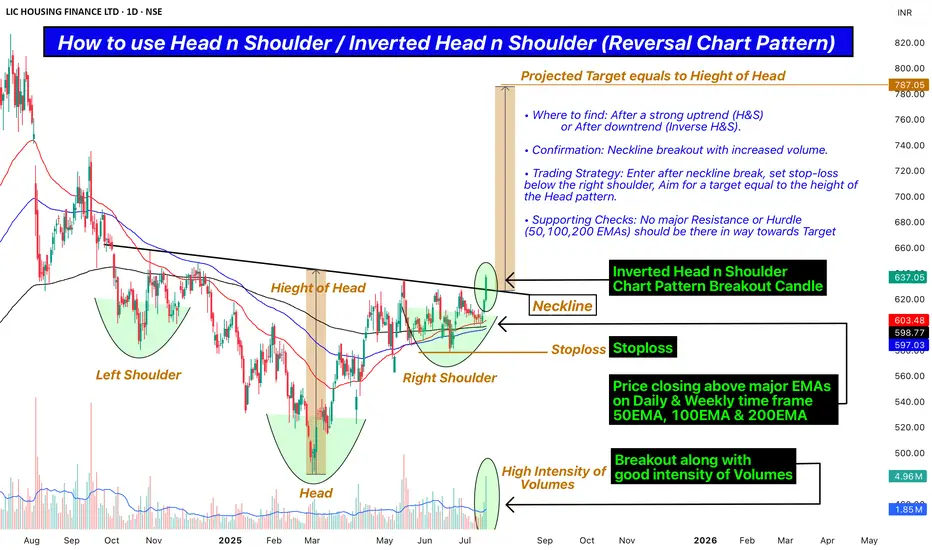
How to use Head n Shoulder / Inv. Head n Shoulder Chart Pattern.Hello Friends,
Welcome to RK_Chaarts,
Today we are going to Learn how to use Head n Shoulder / Inverted Head n Shoulder (Reversal Chart Pattern) as a Professional Trader along with real terms to check, Confirm and apply.
• Where to find: After a strong uptrend (H&S) or After downtrend (Inverse H&S).
• Confirmation: Neckline breakout with increased volume.
• Trading Strategy: Enter after neckline break, set stop-loss below the right shoulder, Aim for a target equal to the height of the Head pattern.
• Supporting Checks: No major Resistance or Hurdle (50,100,200 EMAs) should be there in way towards Target.
This post is shared purely for educational purpose & it’s Not a trading advice.
I am not Sebi registered analyst.
My studies are for educational purpose only.
Please Consult your financial advisor before trading or investing.
I am not responsible for any kinds of your profits and your losses.
Most investors treat trading as a hobby because they have a full-time job doing something else.
However, If you treat trading like a business, it will pay you like a business.
If you treat like a hobby, hobbies don't pay, they cost you...!
Hope this post is helpful to community
Thanks
RK💕
Disclaimer and Risk Warning .
The analysis and discussion provided on in.tradingview.com is intended for educational purposes only and should not be relied upon for trading decisions. RK_Chaarts is not an investment adviser and the information provided here should not be taken as professional investment advice. Before buying or selling any investments, securities, or precious metals, it is recommended that you conduct your own due diligence. RK_Chaarts does not share in your profits and will not take responsibility for any losses you may incur. So Please Consult your financial advisor before trading or investing.
Mastering Multi Time Frame Analysis | Swing and Intraday TradingWhether you're a price action trader or rely on indicators, mastering Multi Time Frame (MTF) Analysis can transform your swing and intraday trading decisions. In this video, I break down how to use MTF effectively to align your entries, spot fakeouts, and trade with higher conviction.

EUR/USD Faces Strong Sell-off, Is a Deeper Correction Coming?The FX:EURUSD pair continued its sharp decline this morning, currently trading around 1.161, after breaking through the bullish wedge pattern on the daily chart. This key technical signal suggests that the previous uptrend has ended, opening the possibility for a deeper correction in the short term. The inability to hold the 1.171 resistance after two attempts further confirms the ongoing downtrend.
The selling pressure is driven by the strong recovery of the USD, as investors seek refuge in safe-haven assets amid concerns about global growth and geopolitical instability. Additionally, U.S. bond yields have rebounded following strong economic data, reducing the appeal of the euro. The expectation that the Fed will maintain high interest rates for a longer period also contributes to the downward pressure on EUR/USD.
In the short term, if EUR/USD fails to hold the 1.158 support, there is a high likelihood of a drop towards 1.140, a level that acted as strong support in the past. Traders should closely monitor signals from the Fed and the upcoming PMI data for the Eurozone to assess the next trend direction.

Gold Faces Pressure as USD Strengthens – A Buying Opportunity?Gold prices have seen a slight decline today compared to yesterday’s trading session, fluctuating around 3,328 USD after losing over 43 USD in just one session.
The main factors contributing to this drop are:
-USD Strength: The USD Index rose by 0.56%, making gold more expensive for investors holding other currencies.
-Rising U.S. Bond Yields: U.S. Treasury yields surged to nearly 4.5%, drawing money away from the gold market.
-U.S. CPI for June: The CPI met expectations, easing inflation fears and reducing the demand for gold as a safe-haven asset.
Despite the short-term pressure, investors remain hopeful that the Fed will cut interest rates in September, potentially providing a boost for gold.
Personal assessment: While gold is currently in a correction phase, its long-term trend remains intact. This could be a buying opportunity if you believe in the upcoming monetary easing cycle.
What do you think about gold’s price today? Let us know in the comments!
