Titan | Swing | Breakout Titan has just given a clean trendline breakout followed by a successful retest, which makes this setup quite interesting from a positional swing trade perspective.
✅ Trendline Breakout
• The stock broke a strong descending trendline that had been acting as resistance for several months.
✅ Retest and Bounce
• After the breakout, Titan came back to retest the breakout level near ₹3,380, which held well — a classic bullish sign. This bounce happened around the 38.2% Fibonacci retracement zone — another technical confluence that adds weight to the trade idea.
⸻
📈 Entry, Targets & Stop Loss
• Entry Zone: Around ₹3,665 – ₹3,695
• Stop Loss (SL): Below ₹3,202
Important note: If price breaks below ₹3,500 without RSI crossing 75, it might lead to negative RSI divergence — a warning of weakening momentum. In that case, better to exit to avoid capital getting stuck.
⸻
🎯 Targets Based on Fibonacci Extensions:
• Target 1: ₹4,123
• Target 2: ₹4,324
• Target 3: ₹4,580
These targets are calculated using Fibonacci extension levels, with the final one being the 1.618 golden ratio zone.
⸻
Disclaimer: Do your own analysis before putting money in investment. Idea is for education purpose to share and learn within trading view community. Not a suggestion to put your hard earn money.
Breakout

Nuvama Wealth: Breakout at 7660Nuvama Wealth: Breakout at 7660. CMP 7880.
Resistance at 7960
Support at 7300

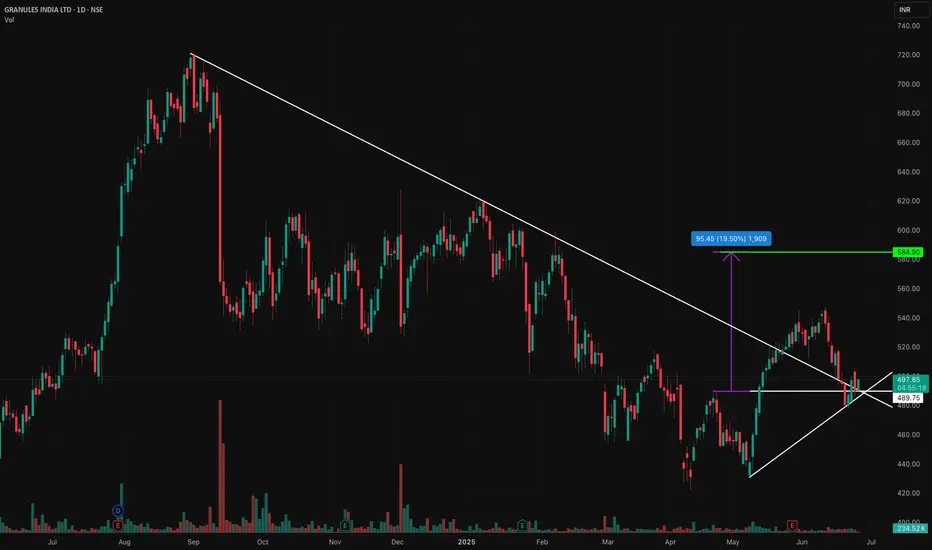
Granules - Double Bottom Breakout Double Bottom Breakout and Retest Done
Buy @ 495-497
SL 475
Target - 585
Resistance Trendline Breakout as well !!
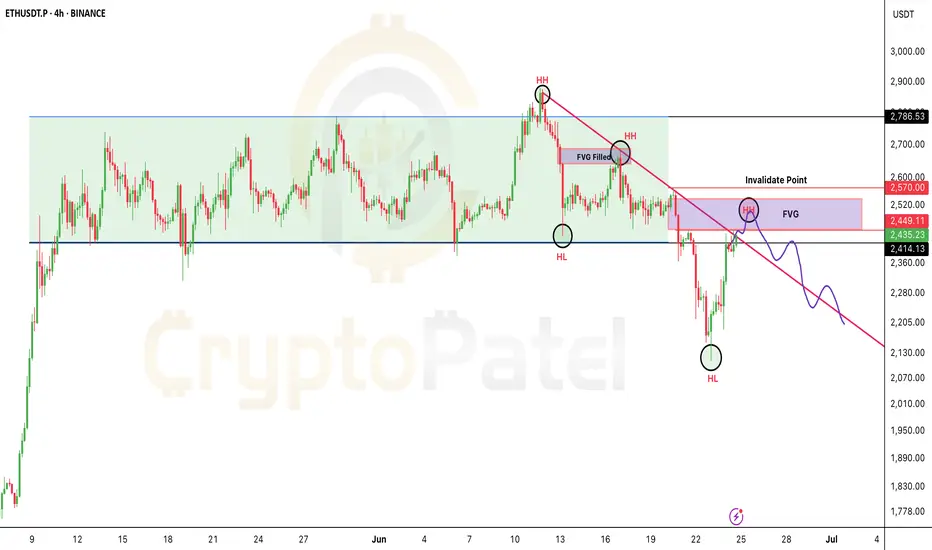
If you're shorting Ethereum, watch $2570 closely.If you're shorting Ethereum, watch $2570 closely.
If a candle closes above $2570, that invalidates the short — time to exit.
Why?
Because above this level, the risk/reward flips against you.
Better to wait for a cleaner entry with less risk, more reward.
Target: $2000
Retweet if this helps your trade plan.
NFA & DYOR
Midhani: Breaks Out of Consolidation: Ready for Lift-Off ?NSE:MIDHANI Breaks Out of Consolidation: A Technical Powerhouse Ready for Lift-Off ?
Price Action Analysis:
- Current Price: ₹463.60 (as of June 23, 2025)
- Price Movement: +20.30 points (+4.58%) on the day
- The stock has demonstrated a spectacular breakout from a lengthy consolidation phase
- Sharp vertical surge from ₹340 levels to current highs of ₹463.60
- Strong momentum evident with substantial volume expansion
Volume Spread Analysis:
- Current Volume: 6.03M shares (significantly elevated)
- Average Volume: 2.36M shares
- Volume surge of approximately 155% above average indicates strong institutional participation
- Volume spike during breakout confirms genuine buying interest
- The previous consolidation period showed declining volume, typical of accumulation phases
Key Technical Levels:
Base Formation:
- Primary Base: ₹220-₹340 range (March 2025 to May 2025)
- Base Duration: Approximately 3 months
- Base Type: Cup and Handle pattern with rectangular consolidation
- Base Depth: From ₹463 high to ₹220 low (52.5% correction)
- Quality: High-quality base with proper volume characteristics
Support Levels:
- Immediate Support: ₹420-₹440 (previous resistance turned support)
- Secondary Support: ₹380-₹400 (50% retracement of recent move)
- Major Support: ₹340-₹360 (breakout point and upper base boundary)
- Ultimate Support: ₹280-₹300 (middle of base formation)
Resistance Levels:
- Immediate Resistance: ₹480-₹500 (psychological round numbers)
- Next Resistance: ₹520-₹540 (measured move from base)
- Major Resistance: ₹580-₹600 (long-term projection target)
Technical Patterns Identified:
Primary Pattern:
- Cup and Handle Formation: Completed with successful breakout
- Handle Formation: Tight consolidation between ₹320-₹340 levels
- Breakout Volume: Exceptional with 155% above average volume
Secondary Patterns:
- Ascending Triangle: Formed during the handle phase
- Flag Pattern: Brief consolidation after initial breakout surge
- Higher Lows: Consistent pattern throughout base formation
Trend Analysis:
- Primary Trend: Strongly Bullish (breakout confirmed)
- Intermediate Trend: Bullish momentum accelerating
- Short-term Trend: Overbought but maintaining strength
Trade Setup and Strategy:
Entry Levels:
- Aggressive Entry: ₹445-₹460 (current levels on minor pullbacks)
- Conservative Entry: ₹420-₹440 (on deeper retracement to support)
- Breakout Entry: ₹350-₹360 (for those who missed the initial move)
Exit Levels:
- Target 1: ₹500 (near-term psychological resistance)
- Target 2: ₹540 (measured move from base)
- Target 3: ₹600 (extended target based on base width)
Stop-Loss Strategy:
- Tight Stop: ₹420 (for aggressive entries)
- Standard Stop: ₹380 (below key support zone)
- Conservative Stop: ₹340 (below breakout point)
Position Sizing and Risk Management:
Position Sizing Guidelines:
- Conservative Allocation: 2-3% of portfolio
- Moderate Allocation: 3-5% of portfolio
- Aggressive Allocation: 5-7% of portfolio (for high-risk tolerance)
Risk Management Framework:
- Maximum Risk per Trade: 2% of total capital
- Risk-Reward Ratio: Minimum 1:3 for all entries
- Scaling Strategy: Add positions on pullbacks to support levels
- Profit Booking: Book 30% at Target 1, 40% at Target 2, 30% at Target 3
Portfolio Considerations:
- Sector Allocation: Limit defence/aerospace exposure to 10-15% of portfolio
- Correlation Risk: Monitor other defence stocks for overexposure
- Market Timing: Consider broader market conditions before position sizing
Sectoral and Fundamental Backdrop:
Defence and Aerospace Sector Overview:
- India's defence budget targeting ₹1.75 lakh crore turnover by 2025
- The government focus on Atmanirbharta (self-reliance) in defence manufacturing
- The global aerospace and defence market is showing a strong growth trajectory
- Space economy growing at 7.4% year-over-year globally
Company Fundamentals:
- Market Cap: ₹8,693 crore
- Revenue: ₹1,074 crore (FY2025)
- Net Profit: ₹110 crore with 21.28% growth in Q4 FY2025
- Promoter Holding: 74% (strong management confidence)
- Specialisation: High-grade alloys, aerospace materials, defence components
Recent Developments:
- Strong presence at Aero India 2025 with indigenous aerospace materials
- Launch of High-Temperature Nickel Alloy Billets and Superni 41 Plates
- Strategic partnerships with HAL, GTRE, ADA, and the Indian Air Force
- Focus on critical materials for defence and aerospace applications
Industry Catalysts:
- Increasing defence procurement by the Indian government
- Export opportunities in aerospace components
- Technological advancement in the space and defence sectors
- The government push for indigenous manufacturing capabilities
Risk Factors and Considerations:
Technical Risks:
- Overbought conditions in the near term may lead to consolidation
- High volatility expected due to recent breakout
- Potential for profit booking at psychological resistance levels
Fundamental Risks:
- Dependence on government orders and policy changes
- Competition from private sector players
- Raw material cost fluctuations
- Execution risks in scaling up production
Market Risks:
- Broader market correction could impact momentum
- Sector rotation away from defence stocks
- Geopolitical factors affecting defence spending
- Interest rate environment impacting valuations
My Take:
NSE:MIDHANI presents a compelling technical setup with a successful breakout from a well-formed base pattern. The combination of strong volume confirmation, favourable sector dynamics, and improving fundamentals creates an attractive investment opportunity. However, investors should be mindful of the recent sharp move and consider appropriate position sizing and risk management strategies.
The stock appears well-positioned to benefit from India's growing defence and aerospace sector, supported by government initiatives and increasing focus on indigenous manufacturing capabilities. Technical indicators suggest further upside potential, making it suitable for both momentum and growth-oriented investment strategies.
Keep in the Watchlist.
NO RECO. For Buy/Sell.
📌Thank you for exploring my idea! I hope you found it valuable.
🙏FOLLOW for more
👍BOOST if you found it useful.
✍️COMMENT below with your views.
Meanwhile, check out my other stock ideas on the right side until this trade is activated. I would love your feedback.
Disclaimer: "I am not a SEBI REGISTERED RESEARCH ANALYST AND INVESTMENT ADVISER."
This analysis is intended solely for informational and educational purposes and should not be interpreted as financial advice. It is advisable to consult a qualified financial advisor or conduct thorough research before making investment decisions.

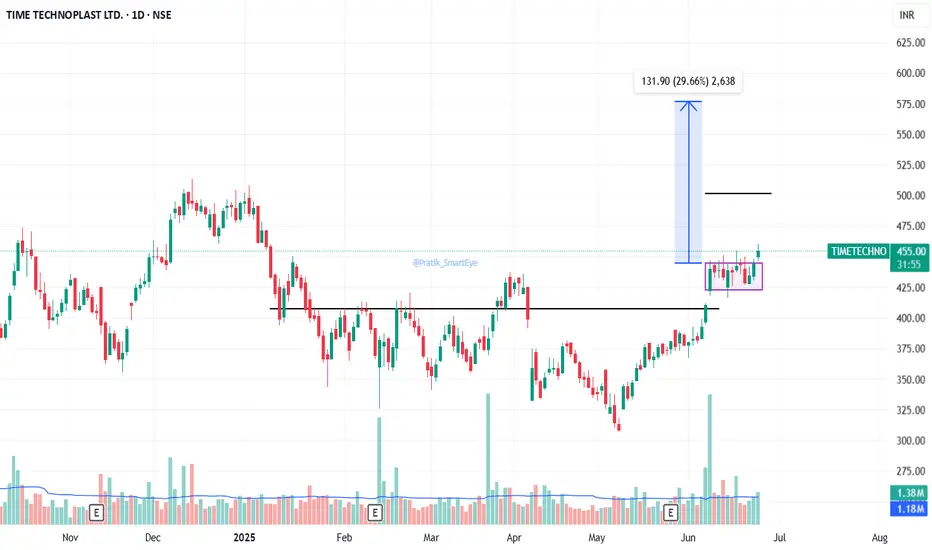
Time Technoplast: Box / Flag BreakoutTime Technoplast: Box / Flag Breakout. CMP 454.
Resistance at 500/576.
Support at 423.
Gold Slips Sharply Ahead of Key US DataGold (XAUUSD) kicked off the week with a steep decline, currently hovering around $3,345 — down over 200 pips from the session’s open. This move unfolds just ahead of a series of major US economic releases, including PMI figures, Q1 GDP, and most importantly, the Core PCE Index — the Fed’s preferred inflation gauge.
Markets are anticipating that Core PCE will remain elevated, reinforcing the case for prolonged high interest rates, which in turn adds pressure on safe-haven assets like gold.
From a technical perspective, the short-term chart has just formed a price GAP. If buyers capitalize on this setup, there’s a potential opportunity to target a gap fill. However, bearish pressure remains strong. If any recovery fails to break above the $3,389 resistance zone, traders should consider sticking with the prevailing downtrend.
Wishing you a successful trading day ahead!

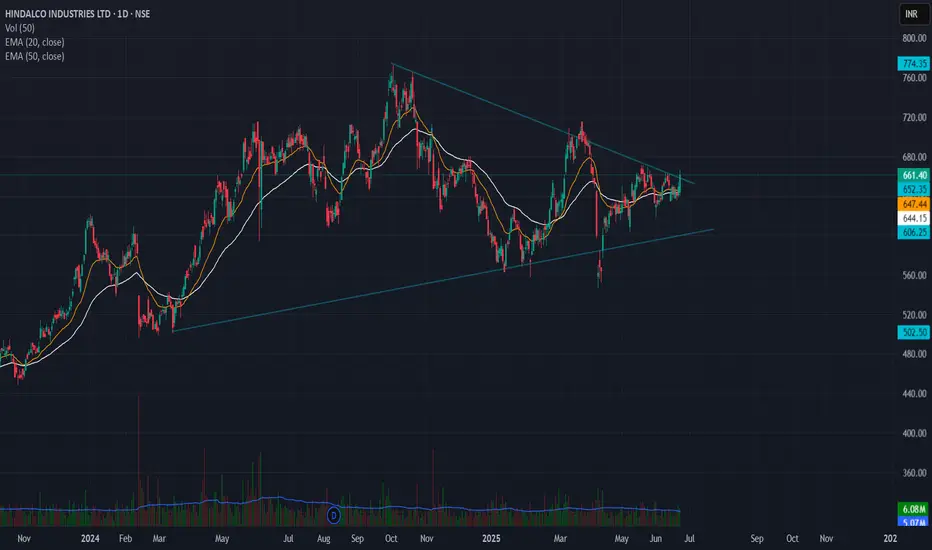
Hindalco Symmetrical Triangle breakout setup🔹 Pattern: Symmetrical Triangle
🔹 Breakout Level: ₹660
🔹 Stoploss: ₹635 (below swing low)
🔹 Target Zone: ₹850 – ₹900
🔹 Risk–Reward: 7.6 – 9.6
🔹 Timeframe: Positional (swing to medium term)
---
📊 Chart Analysis:
Hindalco has broken out of a well-defined symmetrical triangle on the daily chart, with strong price compression followed by bullish breakout confirmation.
The triangle height is ~₹200, projected from the breakout zone, giving a target range of ₹850–₹900.
🧠 Stoploss placed below the last swing low inside the triangle to avoid false breakdown traps.
Weekly CT Breakout + 200EMA Flip | GALAXYSURF Structure📉 Main CT Line (Dotted White)
A well-defined counter-trendline finally gave way after weeks of price compression. The breakout was clean, with a strong bullish candle closing decisively above it.
📊 Volume Confirmation
Breakout candle posted a solid spike in volume — the highest weekly volume in months. 💥
📈 200 EMA Broken (Blue Line)
Price has also cleared the 200-week EMA, a key dynamic resistance, now potentially flipping to support. 📉
🟧 Higher Timeframe Supply (Orange Line) / ⚪ (White Lines)
The breakout candle has also stepped into a tight zone between Weekly + Monthly supply, marked by the orange line.
📌 As always, the chart tells the story. No predictions. No assumptions, just structure.

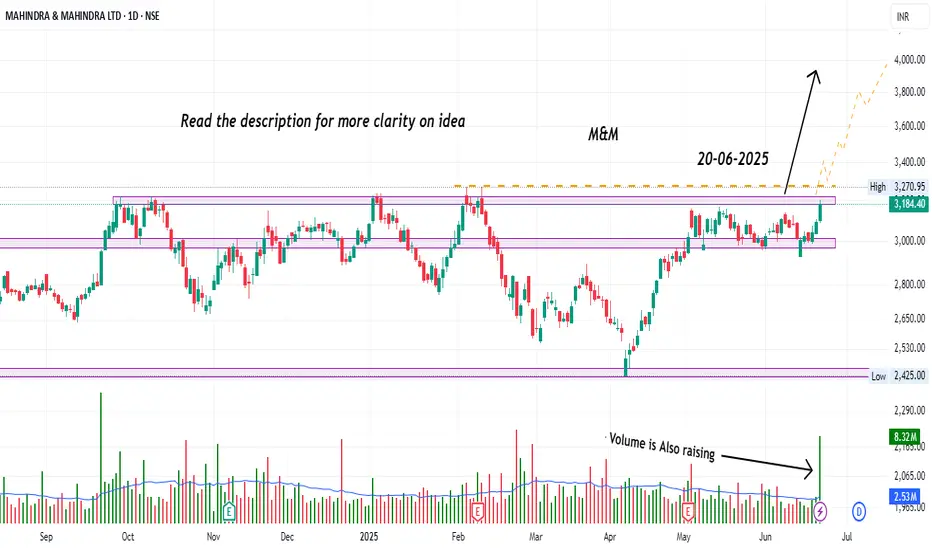
Mahindra & Mahindra – Activity Picking Up! Watch CloselyHey Family, here’s another stock showing a strong technical setup! 🚀
📈 Stock: Mahindra & Mahindra Ltd (NSE: M&M)
🔍 Key Observations:
📊 Chart Pattern:
The stock is displaying a Horizontal Breakout Setup from a well-defined multi-month resistance zone, dating back to 07-10-2021. This forms a strong bullish continuation base, indicating potential for a sustained move higher.
📈 Recent Price Action:
• M&M has recently tested the upper boundary of its resistance zone around ₹3,270, which has been respected multiple times in the past (notably on 18-06-2025 and 20-06-2025).
• The current close at ₹3,184.40 (+2.90%) on June 20, 2025, shows increasing buying momentum near this critical resistance level.
• Volume surged to 8.32M, significantly above average, confirming institutional participation and validating the price action.
📦 Volume Insight:
The volume spike on the breakout attempt signals strong accumulation. This is a vital confirmation factor for the bullish case.
💡 Trading Recommendation:
Aggressive Approach:
• Traders can consider participating based on the current price structure, using proper risk management techniques aligned with individual trading plans.
Conservative Approach:
• Alternatively, wait for a clear breakout confirmation with strong follow-through and closing strength above the resistance zone before considering entry. This helps reduce false breakout risks.
🧠 Rationale:
The recent price behavior, combined with heightened volume activity, reflects growing interest in the stock. Such conditions often signal a shift in market sentiment. Observing how the stock reacts in the coming sessions can provide useful cues. Traders should focus on structure, strength, and participation—adapting their approach based on personal style and risk preference.
🚨 Disclaimer: This is not financial advice. All views are shared for educational purposes only. Please do your own research and always manage your risk before making any trading decisions.
📢 What’s your view? Drop it in the comments and boost the idea if you found it useful – your support helps us keep sharing quality setups! 💬🔥
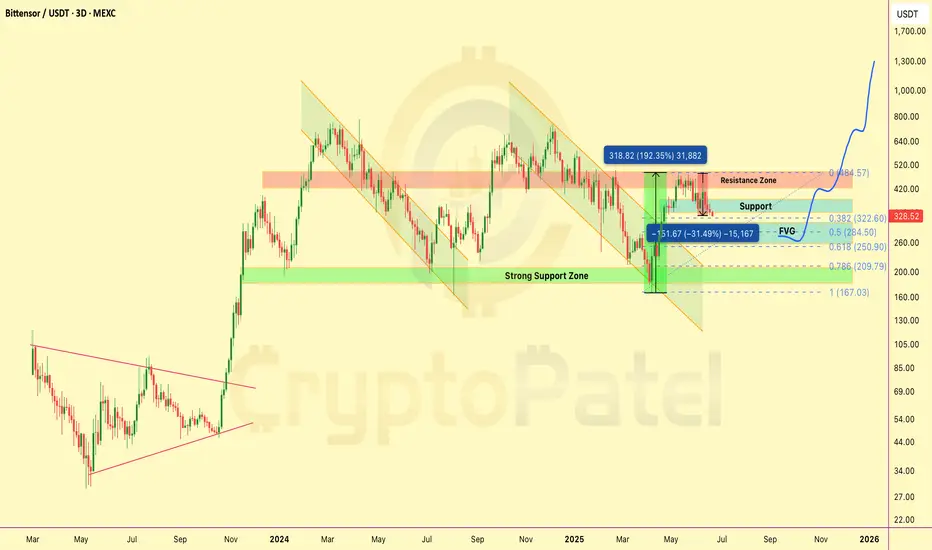
$TAO dumped 30% — and we called it at the topLSE:TAO dumped 30% — and we called it at the top.
We gave the exit at $480.
Now it’s trading near $329. Hope you booked profits or caught that juicy short.
But it’s not over yet 👇
➡️ $350 support broken
➡️ Key zone: $300–$250
➡️ Why? That’s where FVG, 0.5, and 0.618 Fib align.
I’m watching $250 for fresh entries.
Long-term vision? Still see $2k- $3k on the horizon.
Big dips = Big setups.
#TAO #Bittensor NFA & DYOR
Styrenix Performance Materials Ltd - Breakout Setup, Move is ON.#STYRENIX trading above Resistance of 2485
Next Resistance is at 3295
Support is at 1675
Here are previous charts:
Chart is self explanatory. Levels of breakout, possible up-moves (where stock may find resistances) and support (close below which, setup will be invalidated) are clearly defined.
Disclaimer: This is for demonstration and educational purpose only. This is not buying or selling recommendations. I am not SEBI registered. Please consult your financial advisor before taking any trade.

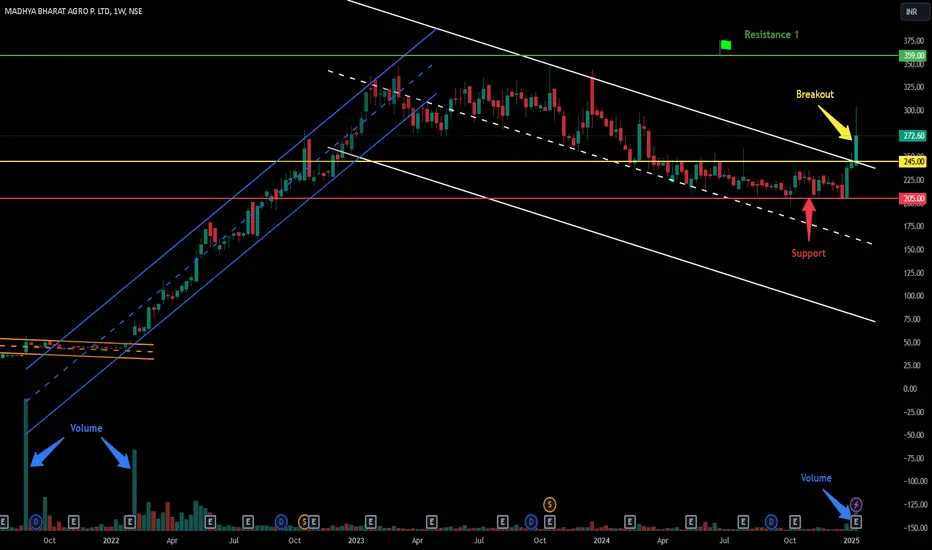
Breakout in Madhya Bharat Agro Products Ltd...Chart is self explanatory. Levels of breakout, possible up-moves (where stock may find resistances) and support (close below which, setup will be invalidated) are clearly defined.
Disclaimer: This is for demonstration and educational purpose only. This is not buying or selling recommendations. I am not SEBI registered. Please consult your financial advisor before taking any trade.
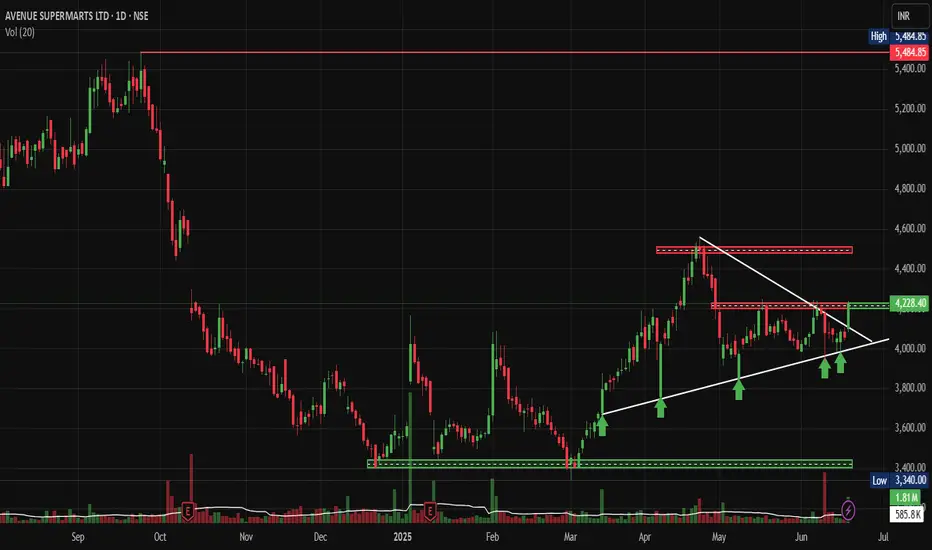
DMART: Technical Breakout Signals Major Rally AheadNSE:DMART Technical Breakout Signals Major Rally Ahead after news of its Entry in Uttar Pradesh as the First Store Opened in Agra.
Price Action:
• Current Price: ₹4,228.40 (up 4.17% or ₹169.30)
• 52-Week Range: ₹3,340 (Low) to ₹5,484.85 (High)
• Stock is trading in the upper half of its annual range, showing strong momentum
• Recent price action indicates a successful breakout from the consolidation phase
Volume Spread Analysis:
• Volume spike visible during recent breakout sessions
• Above-average volume of 585.8K shares traded, confirming institutional participation
• Volume pattern supports the bullish price movement
• Higher volume on green candles indicates genuine buying interest
Key Technical Levels:
Support Levels:
• Primary Support: ₹4,100-4,150 (recent breakout level)
• Secondary Support: ₹3,900-3,950 (previous resistance turned support)
• Major Support: ₹3,600-3,700 (demand zone from March-April consolidation)
• Critical Support: ₹3,400-3,450 (psychological level and volume-based support)
Resistance Levels:
• Immediate Resistance: ₹4,400-4,450 (supply zone marked on chart)
• Major Resistance: ₹4,600-4,700 (previous swing high area)
• Target Resistance: ₹5,200-5,300 (approaching 52-week high zone)
• Ultimate Target: ₹5,484 (52-week high)
Base Formation:
• Stock formed a strong accumulation base between December 2024 and April 2025
• Base depth: Approximately 25-30% from peak to trough
• Duration: A 5-month consolidation period indicates institutional accumulation
• Base breakout occurred with strong volume confirmation in May 2025
Technical Patterns:
• Cup and Handle formation visible from October 2024 to May 2025
• Ascending triangle pattern during the consolidation phase
• Higher lows formation indicating strong underlying demand
• Breakout from falling wedge pattern in early May 2025
Trend Analysis:
• Primary Trend: Bullish (upward sloping trendline from December lows)
• Intermediate Trend: Bullish breakout from consolidation
• Short-term Trend: Strong upward momentum with minor pullback potential
Trade Setup:
Bull Case Scenario:
• Entry Strategy: Buy on dips approach recommended
• Momentum continues toward ₹4,600-4,800 levels
• Volume expansion supports further upside
• Sector rotation favouring retail stocks
Entry Levels:
• Aggressive Entry: ₹4,200-4,250 (current market price area)
• Conservative Entry: ₹4,050-4,100 (on pullback to support)
• Ideal Entry: ₹4,000-4,050 (strong support retest)
Exit Levels:
• Partial Profit Booking: ₹4,500-4,600 (book 30-40% position)
• Second Target: ₹4,800-4,900 (book another 30-40%)
• Final Target: ₹5,200-5,300 (ride remaining 20-30% position)
Stop-Loss Strategy:
• Initial Stop-Loss: ₹3,950 (below recent support)
• Trailing Stop-Loss: Trail stops by ₹150-200 as price advances
• Final Stop-Loss: ₹3,800 (if major support breaks)
Risk Management:
Position Sizing:
• Conservative Allocation: 2-3% of total portfolio
• Moderate Allocation: 3-5% of total portfolio
• Aggressive Allocation: 5-7% of total portfolio (only for high-conviction traders)
Risk Factors:
• Market volatility during the quarterly results season
• Retail sector sensitivity to economic cycles
• High valuations may limit upside potential
• Profit booking pressure near previous highs
Risk Mitigation:
• Diversify across multiple retail stocks
• Use a staggered entry approach
• Maintain strict stop-loss discipline
• Monitor sector rotation trends
Sectoral Backdrop:
Retail Sector Overview:
• The Indian retail sector is following the "Everyday Low Cost - Everyday Low Price" strategy
• Strong, organised retail penetration growth expected
• Consumer spending recovery supporting sector growth
• E-commerce competition intensifying, but offline retail remains resilient
Sector Catalysts:
• Festival season approaching (positive for retail)
• Rural consumption recovery expected
• Urban consumption remains steady
• Government policies supporting organised retail
Fundamental Backdrop:
Company Overview:
• Avenue Supermarts follows a competitive procurement, operational efficiency, and cost-effective distribution strategy
• Market Cap: ₹2,75,237 Crores with almost debt-free status
• Leading hypermarket chain with strong brand presence
Financial Performance:
• Q4 FY25: Sales of ₹14,872 crore (16.9% YoY growth)
• Revenue projected to grow 15% to ₹68,000 to ₹70,000 crore
Business Strengths:
• Strong operational efficiency and supply chain management
• Consistent store expansion strategy
• High customer loyalty and repeat business
• Strong cash generation and a debt-free balance sheet
Growth Drivers:
• New store openings in Tier-2 and Tier-3 cities
• Same-store sales growth improvement
• Category expansion and private label growth
• Digital initiatives and omnichannel presence
My Take:
NSE:DMART presents a compelling technical setup with strong fundamental backing. The stock has successfully broken out from a 5-month consolidation base with volume confirmation. Risk-reward ratio favours bulls with proper position sizing and stop-loss management. Traders should consider entering on minor pullbacks, while investors can accumulate on any meaningful corrections toward support levels.
Keep in the Watchlist.
NO RECO. For Buy/Sell.
📌Thank you for exploring my idea! I hope you found it valuable.
🙏FOLLOW for more
👍BOOST if you found it useful.
✍️COMMENT below with your views.
Meanwhile, check out my other stock ideas on the right side until this trade is activated. I would love your feedback.
Disclaimer: "I am not a SEBI REGISTERED RESEARCH ANALYST AND INVESTMENT ADVISER."
This analysis is intended solely for informational and educational purposes and should not be interpreted as financial advice. It is advisable to consult a qualified financial advisor or conduct thorough research before making investment decisions.
TEXRAIL: Breakout FocusTEXRAIL has recently exhibited a notable technical development on the daily chart. On Friday, 16 May , the stock completed a breakout from an inverted head and shoulders pattern, a formation often associated with potential trend reversals. The breakout occurred with a decisive close above the neckline, which had previously acted as a key level of resistance and had been tested multiple times, reinforcing its technical significance.
Following the breakout, the price action has respected the neckline as a new support level, with multiple successful retests and rebounds observed. As of today’s session, TEXRAIL has once again rebounded from a brief consolidation phase, accompanied by a substantial increase in trading volume—approximately 18M shares , significantly above its recent average. This surge in volume may indicate renewed interest and participation from market participants.
Momentum indicators are also aligning with the bullish structure. The Relative Strength Index (RSI) is currently approaching the 70 level , suggesting strong upward momentum, though it is nearing overbought territory. Additionally, the MACD histogram is showing signs of potential short-term consolidation or profit-taking, particularly as the price approaches a previously identified supply zone.
Looking ahead, the chart outlines three potential resistance levels that may act as intermediate targets or areas of interest for traders monitoring the trend. These levels are derived from historical price action and volume profile analysis.
📊 Please refer to the accompanying chart for a visual breakdown of the pattern, volume dynamics, and resistance zones.
Disclaimer:
The information provided in this analysis is intended solely for educational and informational purposes. It does not constitute investment advice, a recommendation, or an offer to buy or sell any securities. Always conduct your own research or consult with a qualified financial advisor before making any investment decisions.

CT Breakout Live on GOKULAGRO! Supply Zone Just Ahead 📌 CT Breakout In Play | GOKULAGRO
A strong breakout just happened on the Daily chart of GOKULAGRO.
🟢 The Active CT (green) has been cleanly broken today with a strong bullish candle.
🟢 Multiple hidden resistances were also taken out during the breakout – marked in green as they’ve now turned into potential support.
🟢 A healthy volume spike confirms strong participation – not massive, but convincing enough to validate the move.
🔴 The next major supply lies just ahead – a combined Weekly + Monthly resistance zone (marked in red). This could act as a temporary pause or reversal zone if not cleared with momentum.
This is not a forecast or a buy/sell recommendation — just a structured observation of price action and context.
Watching how it behaves near the higher timeframe supply. Will it reject or absorb?
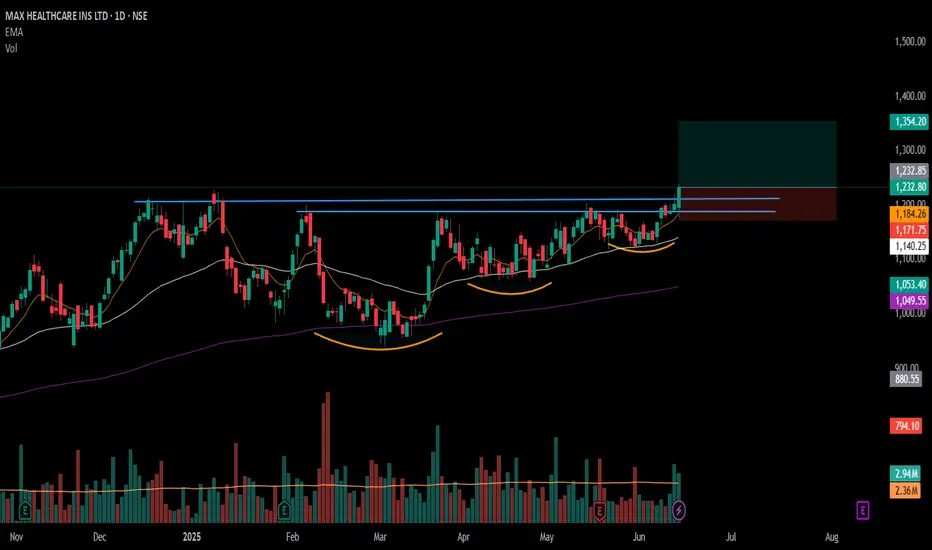
MAXHEALTH - 7 months consolidation VCP Breakout - ATHMAXHEALTH
1) 7 months consolidation - volatility contraction pattern breakout and Closed at it's All Time High. A potential up move is possible.
2) Pharma and Healthcare index looks solid to support Pharma stocks.

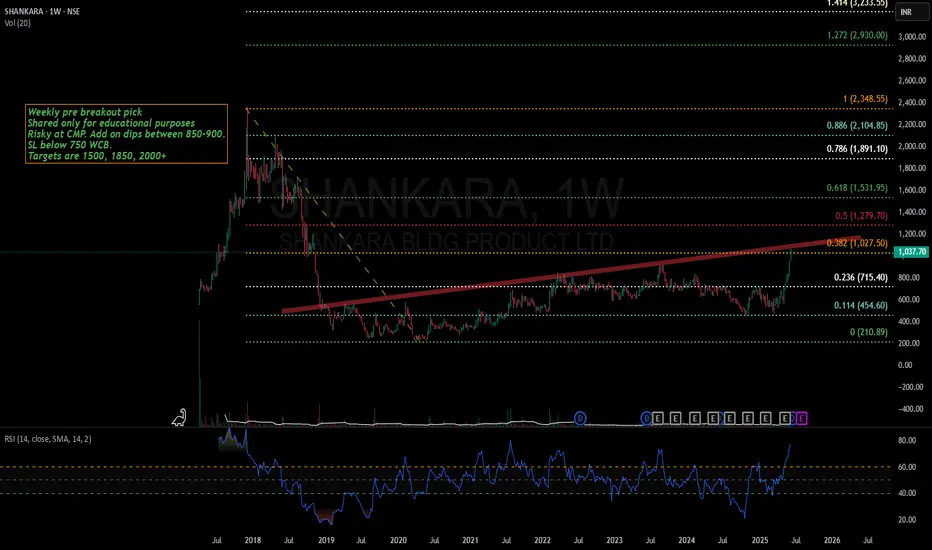
Shankara- U-turn pick for probable 2x returnsShankara has been in a accumulation phases since past 5+ years but has recently given a big breakout.
Stock has potential to fly more as it is just a start of stage 2
Stock can be kept in watchlist for big returns as a positional pick.
It is small cap stock and comes with high risk with high returns.
Please trade wisely and with proper SL.
Please note that this idea is not a recommendation and is for you to learn how stage 2 breakouts can be explosive.
Wockhardt-Bad fundamentals, Strong technicals!Wockhardt is an age old Indian pharma company which has been in loss since few years.
Stock has bounced from strong support and also gave inverted head & shoulders breakout.
Stock is consolidating post breakout.Not my usual technofunda pick but a very attractive technical breakout. Please know that risk is more with such ideas.

Apollo Micro-Do not miss this Volume breakout!Apollo Microsystems has given a breakout of consolidation with a strong weekly closing, almost forming a bullish marubozu candle
Stock will look good only when it retest level of 110 and bounces.
Levels mentioned on chart. I will not buy at CMP.
Stock has potential to fly at least towards 200 according to fib extension.
It is too good of breakout to miss. I have hardly seen such a bullish weekly candle recently when Nifty has been slight bearish.

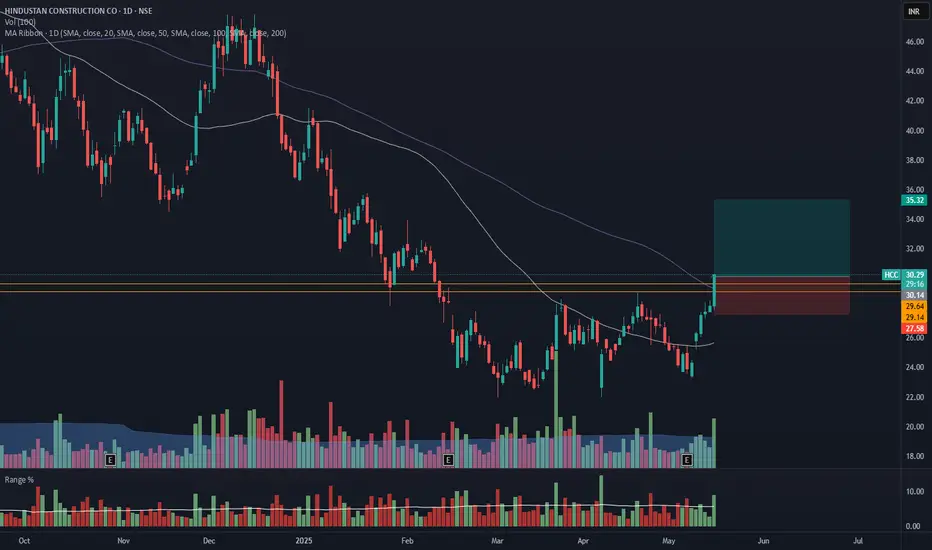
HCC - Breakout from DTFHCC has resistance weakening on the Daily charts and has given a breakout with good volume.
The target of this pattern signals an upside potential of 17% from the current price level in the medium term.
The stock is trading above its 50- and 100-day exponential moving averages (EMAs). The range is more than 1.5X, and the Volume is also 1.5X the average.
CMP- Rs. 30
Target Price- Rs35 ( 17% upside)
SL - 27.5
Disclaimer: This is not a buy/sell recommendation. For educational purpose only. Kindly consult your financial advisor before entering a trade.
#MAXHEALTH - VCP Set up Breakout in Daily Time Frame📊 Script: MAXHEALTH
Key highlights: 💡⚡
📈 VCP Set up Breakout in Daily Time Frame.
📈 Price consolidating near Resistance, then Breakout.
📈 Volume spike seen during Breakout.
📈 MACD Cross
📈 Can go for a swing trade
BUY ONLY ABOVE 1235 DCB
⏱️ C.M.P 📑💰- 1232.80
🟢 Target 🎯🏆 – 11%
⚠️ Stoploss ☠️🚫 – 5%
⚠️ Important: Market conditions are Okish, Position size 50% per Trade. Protect Capital Always
⚠️ Important: Always Exit the trade before any Event.
⚠️ Important: Always maintain your Risk:Reward Ratio as 1:2, with this RR, you only need a 33% win rate to Breakeven.
✅Like and follow to never miss a new idea!✅
Disclaimer: I am not SEBI Registered Advisor. My posts are purely for training and educational purposes.
Eat🍜 Sleep😴 TradingView📈 Repeat 🔁
Happy learning with MMT. Cheers!🥂
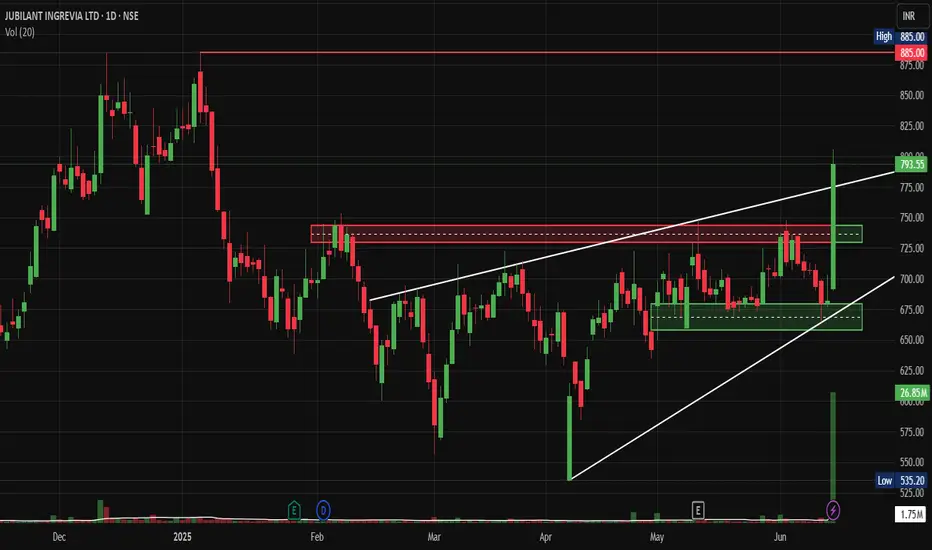
Jubilant Ingrevia: Broke Out after Stake Sell from PromotersNSE:JUBLINGREA Just Broke Out Big after Prabhudas Lilladher gave Hold Rating with a target of Rs 713 and Stake Sell from Promoters
Technical Chart Pattern:
• The stock displays a classic ascending triangle pattern formation spanning from February to June 2025
• Multiple higher lows connected by an ascending trend line (white diagonal support)
• Horizontal resistance zone around ₹735-740 levels acting as the upper boundary
• Recent breakout above the triangle pattern with strong volume confirmation
Key Support and Resistance Levels:
• Primary Support: ₹675-685 (previous resistance turned support)
• Secondary Support: ₹650-660 (trend line support)
• Major Support: ₹535-550 (swing low from March)
• Immediate Resistance: ₹800-810 (psychological level)
• Major Resistance: ₹885 (all-time high marked on chart)
Base Formation Analysis:
• Well-defined base formation between ₹650-740 levels over 4 months
• The consolidation phase showed declining volatility, indicating accumulation
• Multiple tests of resistance at ₹735-740 showing supply absorption
• Base depth of approximately 15-20% from the highs, indicating healthy correction.
Volume Spread Analysis:
Volume Characteristics:
• Significant volume spike during the recent breakout (26.85M vs average 1.75M)
• Volume expansion during upward moves and contraction during pullbacks
• Strong institutional participation is evident from the volume profile
• Volume-price correlation remains positive, supporting the uptrend
Volume Indicators:
• Above-average volume during breakout confirms genuine demand
• Recent sessions show sustained higher volumes, indicating continued interest
• No distribution patterns are visible in volume analysis
Trade Setup:
Entry Strategy:
• Primary Entry: ₹790-800 on any pullback to the breakout zone
• Aggressive Entry: Current market price around ₹799 with tight stops
• Conservative Entry: Wait for retest of ₹740-750 resistance-turned-support
• Scale-in approach recommended given the momentum
Exit Levels:
• Target 1: ₹850 (measuring the triangle height projection)
• Target 2: ₹885 (previous all-time high)
• Target 3: ₹920-950 (extended projection based on base depth)
• Trail stops above ₹850 for position management
Stop Loss Placement:
• Initial Stop Loss: ₹735 (below breakout level)
• Revised Stop Loss: ₹750 (after first target achievement)
• Final Stop Loss: ₹780 (trailing stop for remaining position)
Risk Management Framework:
Position Sizing Guidelines:
• Risk 1-2% of portfolio capital per trade
• Position size calculation: (Account Size × Risk %) ÷ (Entry Price - Stop Loss)
• Maximum position should not exceed 3-5% of the total portfolio
• Consider reducing the size given recent volatility expansion
Risk Control Measures:
• Maintain risk-reward ratio of a minimum of 1:2
• Use partial profit booking at predetermined levels
• Avoid averaging down below stop loss levels
• Monitor sector rotation and market sentiment
Fundamental and Sectoral Backdrop:
Company Overview:
• Jubilant Ingrevia operates in Speciality Chemicals, Nutrition and Health Solutions, and Chemical Intermediates segments
• Global provider serving pharmaceutical, nutrition, agrochemical, and consumer industries with a focus on quality and customization
• Serves 15 of the top 20 Global Pharma & 7 of the top 10 Global Agrochemical companies as a leading low-cost provider
Recent Financial Performance:
• Net profit jumped 153.16% year-over-year to ₹74.05 Cr in Q4 2024-2025
• Q4 2025 revenue of 1,051 cr. down from INR1,074 cr. in Q4 FY24 with EBITDA of INR148 crores showing 42% year-on-year rise
• Market capitalization of 12,664 Cr. with trailing twelve-month revenue of 4,178 Cr.
Sectoral Dynamics:
• The speciality chemicals sector is benefiting from the China+1 strategy
• Increasing demand for pharmaceutical intermediates post-COVID
• The government push for self-reliance in chemical manufacturing
• Export opportunities in agrochemical intermediates are expanding globally
Key Fundamentals:
• The company shows a low return on equity of 9.24% over the last 3 years
• Analyst average share price target of ₹735
• Strong client base with global pharmaceutical and agrochemical giants
• Diversified product portfolio, reducing concentration risk
Market Outlook and Catalysts:
Positive Catalysts:
• Expansion in speciality chemicals capacity
• New product launches in the nutrition segment
• Increasing penetration in international markets
• Potential margin expansion through product mix improvement
Risk Factors:
• Raw material price volatility
• Regulatory changes in target markets
• Currency fluctuation impact on exports
• Competition from Chinese manufacturers
My Take:
This technical setup presents a compelling opportunity with the stock breaking out of a well-defined pattern, supported by strong fundamentals and favourable sector dynamics. The risk-reward profile appears attractive for traders and investors willing to manage position size appropriately.
Keep in the Watchlist.
NO RECO. For Buy/Sell.
📌Thank you for exploring my idea! I hope you found it valuable.
🙏FOLLOW for more
👍BOOST if you found it useful.
✍️COMMENT below with your views.
Meanwhile, check out my other stock ideas on the right side until this trade is activated. I would love your feedback.
Disclaimer: "I am not a SEBI REGISTERED RESEARCH ANALYST AND INVESTMENT ADVISER."
This analysis is intended solely for informational and educational purposes and should not be interpreted as financial advice. It is advisable to consult a qualified financial advisor or conduct thorough research before making investment decisions.