LLOYDSENT | Cup and Handle | BreakOut | Daily | Good VolumeHere's the **technical analysis** of **Lloyds Enterprises Ltd (NSE: LLOYDSENT)** on the **daily chart**,
---
## 📊 **Lloyds Enterprises Ltd – Daily Chart Analysis**
---
### 🧩 **Chart Patterns Observed**
#### 2. **Cup and Handle Formation**
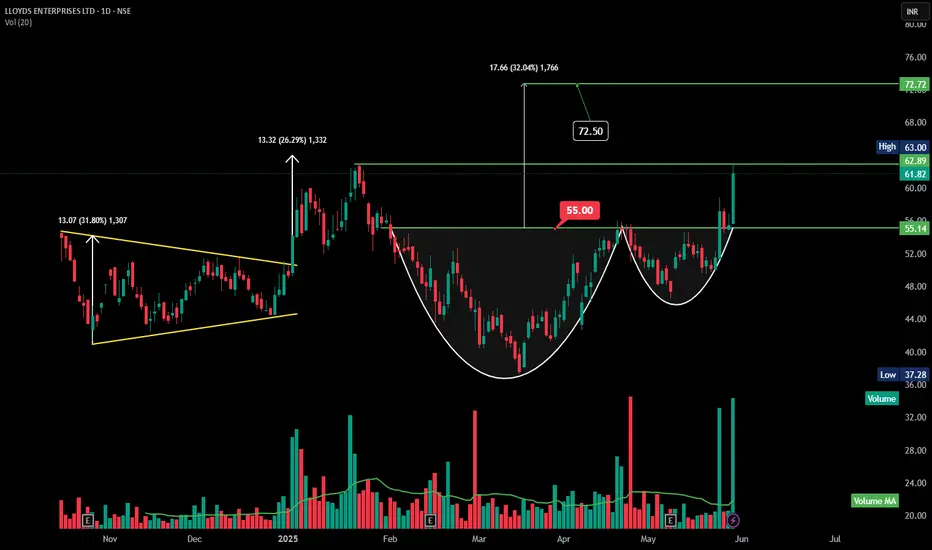
* A well-formed **cup and handle** pattern observed between March–May 2025.
* **Neckline breakout**: ₹55.00
* The price surged sharply after breakout, confirming pattern validity.
---
### 📏 **Price Action & Measured Targets**
| Move Type | Range | Target |
| --------------------- | ---------------------- | --------------------------------- |
| Cup & Handle Breakout | ₹55.00 → ₹72.50 | **₹72.50** (Measured Move Target) |
| Current Price | ₹61.82 | |
| Immediate Resistance | ₹63.00 | |
| Support | ₹55.14 (Breakout zone) | |
* Breakout move from ₹55 to ₹63 already achieved \~14.5% rally.
* **Next target**: ₹72.50 (as per the height of the cup added to breakout zone).
---
### 🔥 **Volume Analysis**
* Massive **volume spike** on breakout candle above ₹55.00 — signifies **strong buying interest**, likely institutional participation.
* Previous volume bars were average or decreasing → confirms **handle was low-volume** (ideal setup).
---
### 🧭 **Key Technical Levels**
| Level Type | Price (₹) |
| ------------------------ | --------------- |
| Resistance 1 (immediate) | ₹63.00 |
| Target Zone | ₹72.50 – ₹72.72 |
| Breakout Zone (Support) | ₹55.00–₹55.14 |
| Strong Support | ₹48.00 |
---
### ✅ **Technical Conclusion**
📌 **Bias**: **Strongly Bullish**
* Price broke above both **cup neckline** and **horizontal resistance** with confirmation.
* RSI likely to be nearing overbought; hence, a short pause/consolidation can occur around ₹63 before next leg up.
---
### 🎯 **Trading Strategy**
| Strategy | Plan |
| ----------------------- | ------------------------------------------------------- |
| **Swing Buy on Retest** | Enter on dip near ₹58–₹60 zone |
| **Target** | ₹72.50–₹72.72 |
| **Stop Loss** | Below ₹54.80 (close basis) |
| **Momentum Play** | Add above ₹63 on closing basis with volume confirmation |
🧠 Risk-Reward looks favorable (\~1:2+) for swing traders.
Breakout
$RENDER Could Be the Next Nvidia of CryptoCRYPTOCAP:RENDER Could Be the Next Nvidia of Crypto
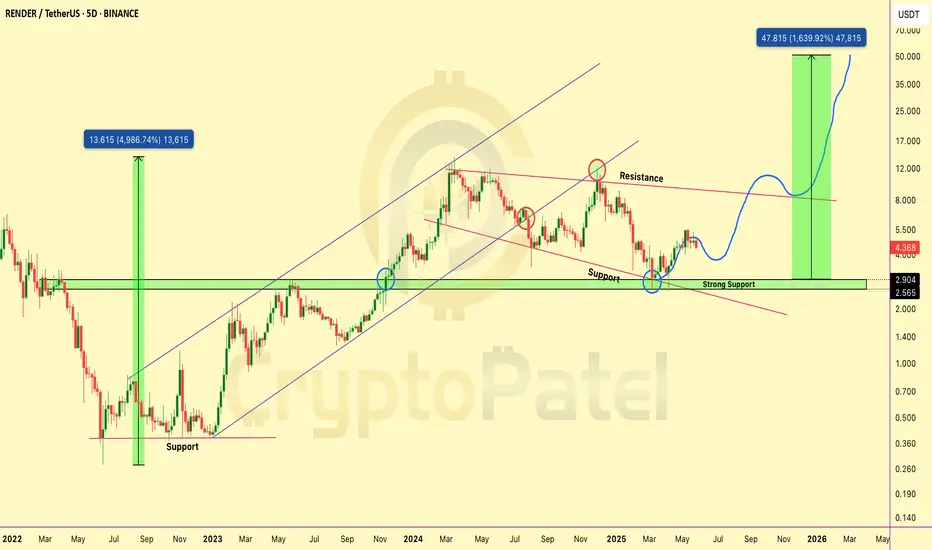
CRYPTOCAP:RENDER is one of the strongest AI projects in crypto right now — and it’s only getting started. The dip you see now?
That’s an accumulation opportunity for long-term believers!
▶️ Best Buy Zone: $4 – $3.40
▶️ Targets: $8.6 / $15 / $25 / $40 / $50
▶️ Strong Support: $2.90 – $2.50
As long as we’re above that — we’re super bullish! ✅
Why CRYPTOCAP:RENDER Can Hit $30–$50 This Cycle:
✅ Solves real problems – powers AI, 3D, VFX, gaming
✅ Trusted by giants – Netflix, Disney, Apple, Unreal Engine
✅ Limited supply + burn = strong tokenomics
✅ On Solana now – faster, cheaper, better
✅ Rides the AI wave – GPU demand is booming
✅ Last cycle = 49x. This time? Bigger stage, bigger vision.
It’s like the Nvidia of Web3 — but decentralized.
👇 If you believe in the future of AI + GPU power…
Keep your eyes on $RENDER. This one’s not just hype.
NFA & DYOR
#PILITA - Multi Year BreakOut 📊 Script: PILITA
Key highlights: 💡⚡
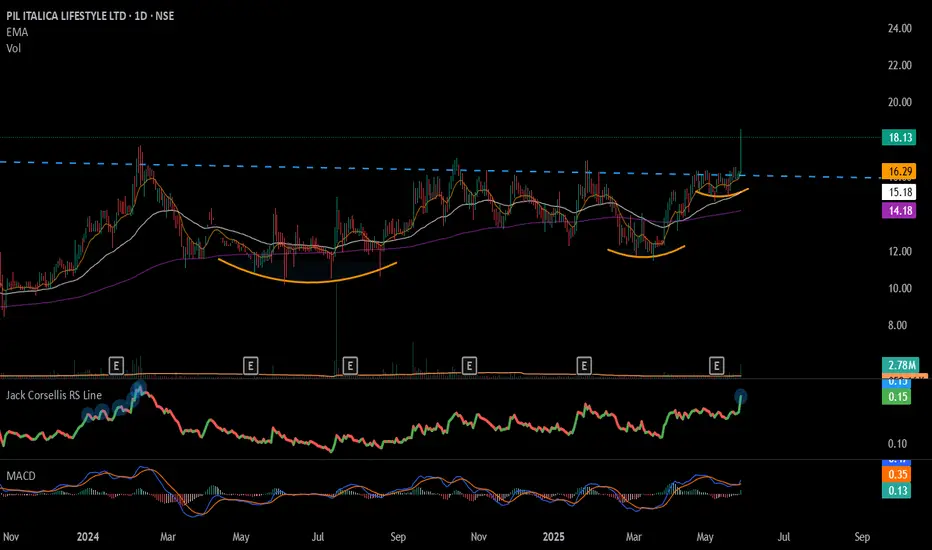
📈 8 Year BreakOut in Daily Time Frame.
📈 Price consolidating near Resistance.
📈 Volume spike during Breakout
📈 MACD Bullish
📈 Can go for a swing trade
⚠️ Important: It’s a Penny Stock Trade with extreme caution
BUY ONLY ABOVE 17.50 DCB
⏱️ C.M.P 📑💰- 17.45
🟢 Target 🎯🏆 – NA%
⚠️ Stoploss ☠️🚫 – NA%
⚠️ Important: Market conditions are Okish, Position size 50% per Trade. Protect Capital Always
⚠️ Important: Always Exit the trade before any Event.
⚠️ Important: Always maintain your Risk:Reward Ratio as 1:2, with this RR, you only need a 33% win rate to Breakeven.
✅Like and follow to never miss a new idea!✅
Disclaimer: I am not SEBI Registered Advisor. My posts are purely for training and educational purposes.
Eat🍜 Sleep😴 TradingView📈 Repeat 🔁
Happy learning with MMT. Cheers!🥂
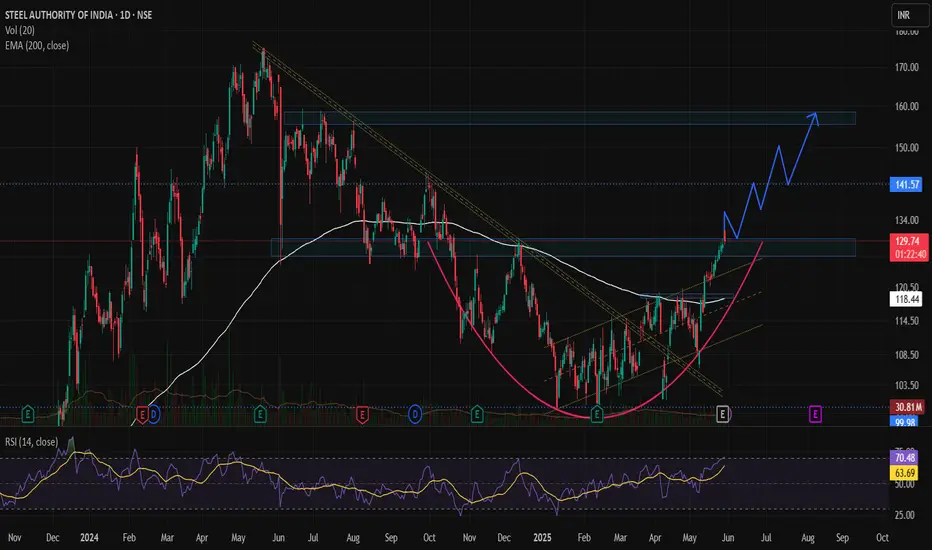
SAIL – Trend Reversal & Trade SetupA trend reversal appears to be taking shape in SAIL, indicating a potential shift from a downtrend to an uptrend. The stock has recently came out of a falling trendline and has closed above its 200-day EMA, placed at ₹117, signaling renewed strength and buyer interest.
🔄 Technical Outlook
- Breakout Zone: SAIL gave a technical breakout at ₹117, which aligns with its 200 EMA (Day), a widely tracked long-term moving average.
- Current Price Action: The stock is now trading at around ₹130, emerging from a rounding bottom pattern, which is a bullish continuation pattern indicating accumulation and base formation.
- Volume Analysis: Recent trading sessions have shown notable volume spikes, supporting the bullish breakout and trend reversal narrative.
- Fundamental Trigger: Q4 Results have been decent, providing a fundamental cushion to the technical setup. While not overly bullish, the results are good enough to support the ongoing trend reversal, especially if broader market sentiment remains stable.
📊 Support & Resistance Levels
- Crucial Support Zone: ₹127–₹130 — holding this zone is key for sustaining the bullish move.
- Key Breakout Zone: ₹127–₹130 — staying above this range will confirm the breakout and strengthen the upward move.
- Stop Loss: A protective stop-loss at ₹115, which lies just below the 200-day EMA, is advisable to manage downside risk.
🎯 Target Levels
First Target: ₹140
Second Target: ₹150
Final Target: ₹158
Time Frame: Expected to take 2–2.5 months to achieve the projected targets if momentum continues.
IFCI: Explosive Move Hits a Key WallTechnical Setup – IFCI Ltd. on the weekly timeframe chart
Current Price: ₹70.31
Breakout Confirmation: Price broke above major trendline resistance (dotted line) with strong volume
Volume Profile: Highest traded zone was around ₹42–₹50 (base built here)
Fibonacci Levels: 61.8% broken = bullish signal
Targets: 🎯 ₹91.56 (100% Fib level) 🎯 ₹161.79 (161.8% extended Fib target – long term)
📊 Fundamental Story – Government owned NBFC
Focused on infrastructure and industrial finance
Recent market rally shows renewed investor interest
Benefits from:
• PSU sector momentum
• Government capex push
• Improved asset quality & restructuring progress
Turnaround story in the making, driven by fundamentals + reform
Like, comment your thoughts, and share this post!
Explore more stock ideas on the right hand side your feedback means a lot to me!
Disclaimer: This post is for educational purposes only and should not be considered a buy/sell recommendation.

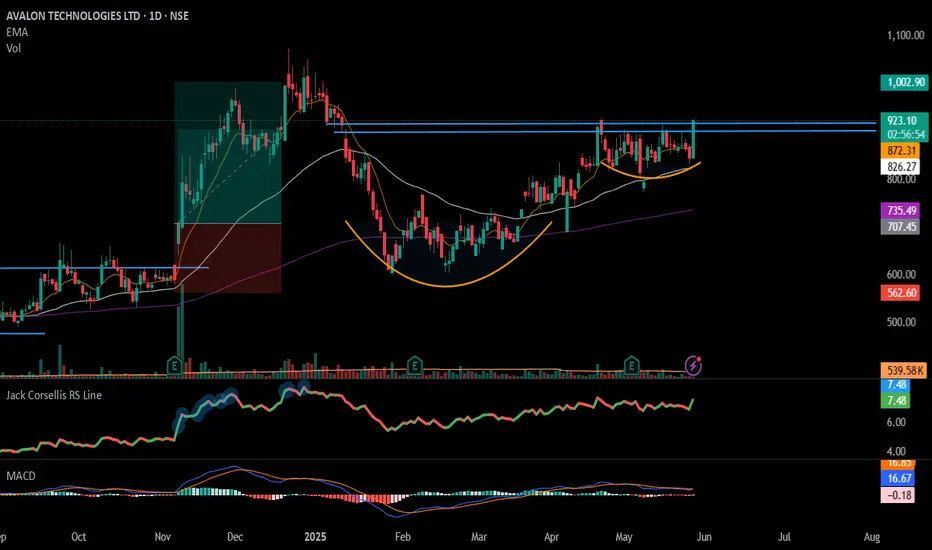
#AVALON - Cup & Handel Potential BreakOut / Keep In WatchList📊 Script: AVALON
Key highlights: 💡⚡
📈 Cup & Handel Potential BreakOut in Daily Time Frame.
📈 Price consolidating near Resistance.
📈 Wait for Volume spike during Breakout
📈 MACD Bullish
📈 Can go for a swing trade
BUY ONLY ABOVE 930 DCB
⏱️ C.M.P 📑💰- 915
🟢 Target 🎯🏆 – NA%
⚠️ Stoploss ☠️🚫 – NA%
⚠️ Important: Market conditions are Okish, Position size 50% per Trade. Protect Capital Always
⚠️ Important: Always Exit the trade before any Event.
⚠️ Important: Always maintain your Risk:Reward Ratio as 1:2, with this RR, you only need a 33% win rate to Breakeven.
✅Like and follow to never miss a new idea!✅
Disclaimer: I am not SEBI Registered Advisor. My posts are purely for training and educational purposes.
Eat🍜 Sleep😴 TradingView📈 Repeat 🔁
Happy learning with MMT. Cheers!🥂
CHOLAFIN: Potential for 15-20% Upside AheadThe chart of CHOLAFIN provides delineates critical price thresholds that signify breakout points, along with specific support levels that serve as indicators of where buying interest may manifest.
Additionally, the chart highlights regions likely to act as ceiling points for future price ascensions, allowing for informed decisions on entry and exit strategies.
Disclaimer: The information contained in this technical analysis report is intended solely for informational and educational purposes. It should not be interpreted as financial advice or a recommendation to buy or sell any security. Investors are strongly encouraged to conduct their own research and consult with a qualified financial advisor before making any investment decisions.

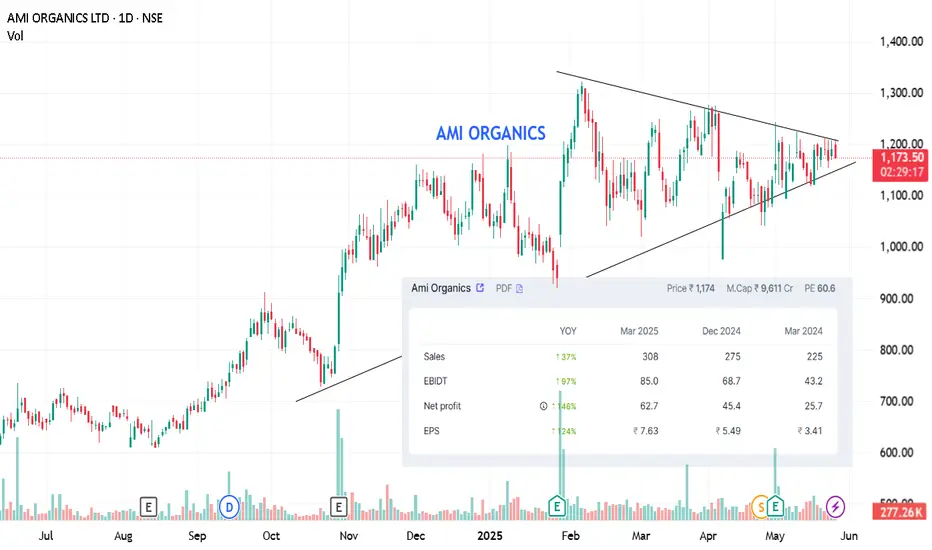
AMI ORGANICS: RANGE and TRIANGLE with strong Q results, ami organics is set to break the consolidation range with stong momentum, early setup has advantage.
keep your risk reward in check and can become a good script.
ALong
Bharat Dynamics Ltd (BDL)🚀 BDL - Technical Breakout in Play!
Weekly breakout above key resistance zone 🔥
Pattern: Double Bottom ➕ Break of Monthly Mother Candle High
Potential Upside:
🎯 Target 1: ₹1968.50
🎯 Target 2: ₹2590.00

Massive Breakout + Volume Surge! KEC Looks Ready to Explode📌 Technical Breakdown:
🔹 CT (Counter-Trendline): A clear downward-sloping white dotted CT has been broken with a powerful bullish candle.
🔹 Base Formation: A strong accumulation zone (green zone) is evident where higher lows were formed, indicating demand absorption.
🔹 200 DEMA: The price cleanly breaks above the 200-day exponential moving average, which often acts as a major dynamic resistance.
🔹 Higher Low Structure: The recent price action formed a higher low, validating strength before the breakout.
🔹 Volume Confirmation: Recent candles show a surge in volume, confirming institutional participation and accumulation during the base.

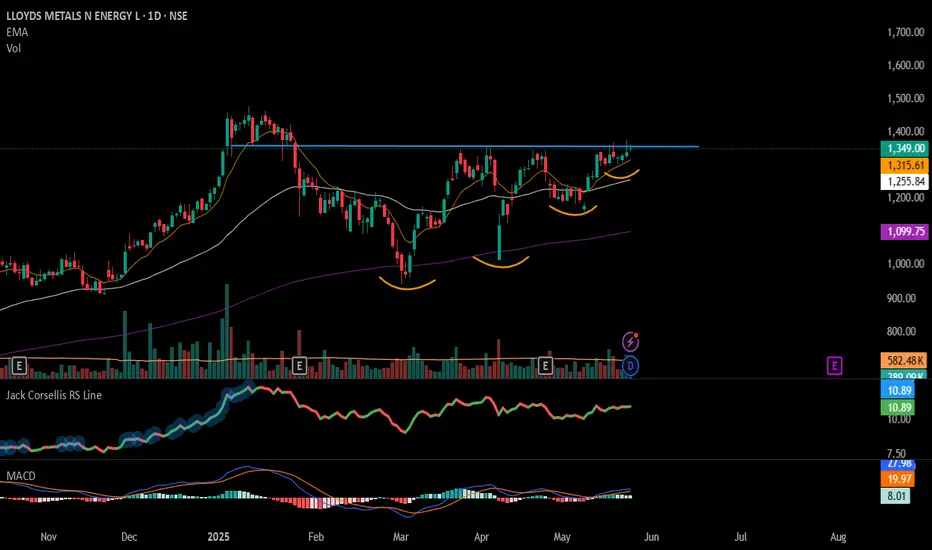
#LLOYDSME - BreakOut Soon Candidate📊 Script: LLOYDSME
Key highlights: 💡⚡
📈 VCP BreakOut in Daily Time Frame.
📈 Price consolidating near Resistance.
📈 Wait for Volume spike during Breakout
📈 MACD Bullish
📈 Can go for a swing trade
BUY ONLY ABOVE 1405 DCB
⏱️ C.M.P 📑💰- 1349
🟢 Target 🎯🏆 – NA%
⚠️ Stoploss ☠️🚫 – NA%
⚠️ Important: Market conditions are Okish, Position size 50% per Trade. Protect Capital Always
⚠️ Important: Always Exit the trade before any Event.
⚠️ Important: Always maintain your Risk:Reward Ratio as 1:2, with this RR, you only need a 33% win rate to Breakeven.
✅Like and follow to never miss a new idea!✅
Disclaimer: I am not SEBI Registered Advisor. My posts are purely for training and educational purposes.
Eat🍜 Sleep😴 TradingView📈 Repeat 🔁
Happy learning with MMT. Cheers!🥂
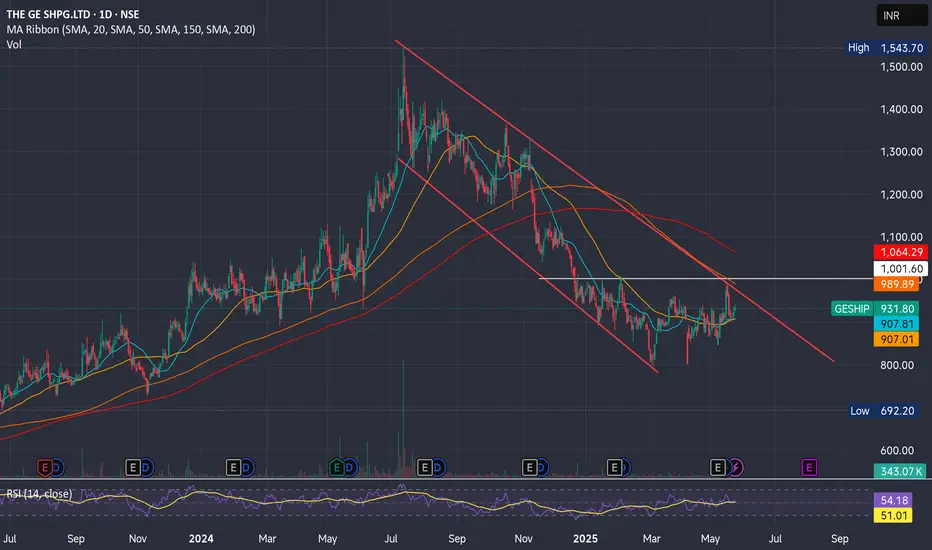
Ge shipping in a trading channel Ge shipping in trading channel range may breakout soon.
Stop loss 904 may add at current levels for Target towards 1225.
Hidden Channel SHATTERED – Explosive Breakout on SHILPA MEDICARE✅ Breakout from a well-defined Weekly Counter Trendline (white thick line) with strong bullish candle.
⚡ Hidden Broadening Channel Formation (dotted white lines) was also broken in the same move—double breakout confirmation!
💥 Volume spike — first major surge in weeks, indicating institutional participation.
📌 Consolidation just below major resistance (MTF orange line) played out perfectly. Price broke above previous swing highs.
🧱 Next Resistance: ₹898.05 (Monthly TF resistance). With current momentum, a clean test is highly probable.

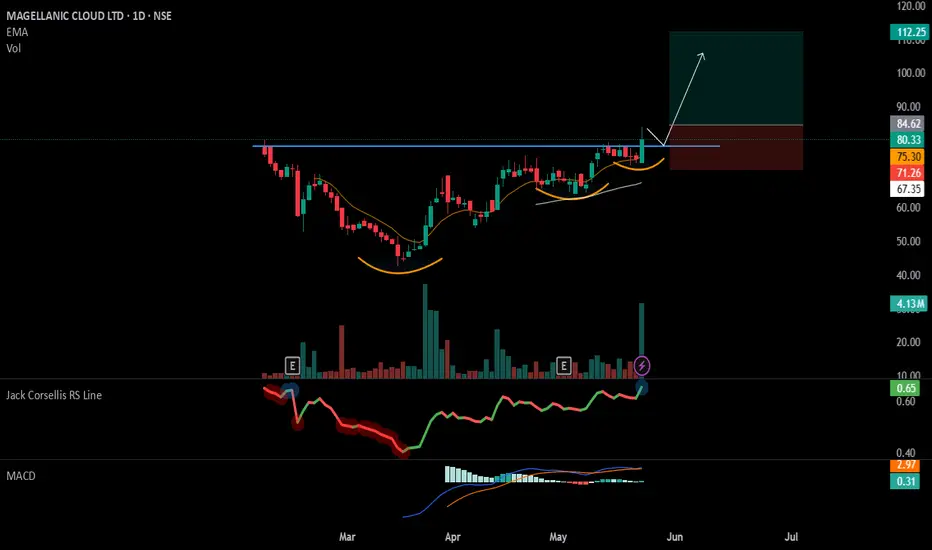
#MCLOUD - VCP + IPO Base Break Out📊 Script: MCLOUD
Key highlights: 💡⚡
📈 VCP + IPO Base BreakOut in Daily Time Frame.
📈 Price consolidated near Resistance.
📈 Volume spike seen
📈 MACD Crossover
📈 Can go for a swing trade
BUY ONLY ABOVE 85 DCB
⏱️ C.M.P 📑💰- 80.33
🟢 Target 🎯🏆 – 31%
⚠️ Stoploss ☠️🚫 – 15%
️⚠️ Important: Market conditions are Okish, Position size 50% per Trade. Protect Capital Always
⚠️ Important: Always Exit the trade before any Event.
⚠️ Important: Always maintain your Risk:Reward Ratio as 1:2, with this RR, you only need a 33% win rate to Breakeven.
✅Like and follow to never miss a new idea!✅
Disclaimer: I am not SEBI Registered Advisor. My posts are purely for training and educational purposes.
Eat🍜 Sleep😴 TradingView📈 Repeat 🔁
Happy learning with MMT. Cheers!🥂
SHANKARA: supply zone breakout➡️PE well below the industry PE (half)
➡️highest ever sales and manageable debt
➡️volume uptick
Cons:
⬆️receivables (probably on account of pushed sales)
⬆️retail holding and trade payables

TTML: Unlocking Potential with Elliott WavesHello friends, Welcome to RK Chaarts.!
Let’s analyse the chart of Tata Teleservices Maharashtra Limited from an Elliott wave perspective.
We can see that in March 2023, the stock formed a bottom around 49.65 and then moved upwards in an impulse wave. We can identify wave one as complete, ending around the July 2024 high.
After that, there was a sudden fall to the April 2025 low, which we assume to be the end of wave two. We expected it to reverse around the previous low, because wave II cannot retrace more than 100% of wave I (Elliott wave principles), and Same happened, it had reversed from that low to upside.
Looking at the weekly chart, we can see that post wave II, price has broken the 0-B trend line with strong volume intensity. If our wave counts are correct, we can measure wave I and project wave III’s target using Trend based Fib extensions as per Elliott wave theory.
According to the theory, wave III target could be around 150.70, which is 1.618 times the length of wave I.
Projected Targets as per Elliott waves:
So, friends, from an Elliott wave perspective, Tata Teleservices has strong potential to move upwards to around 150 rupees, with potential targets at 88, 112, 127, and 150 rupees.
Invalidation levels:
Please note that this analysis is for educational purposes only and involves multiple possibilities. The scenario presented focuses on one potential outcome, assuming the invalidation level of 49.65 is not triggered. If it is triggered, the chart would need to be reassessed, and wave counts would need to be reevaluated.
This is not a tip or advisory, but rather a educational analysis.
I am not Sebi registered analyst.
My studies are for educational purpose only.
Please Consult your financial advisor before trading or investing.
I am not responsible for any kinds of your profits and your losses.
Most investors treat trading as a hobby because they have a full-time job doing something else.
However, If you treat trading like a business, it will pay you like a business.
If you treat like a hobby, hobbies don't pay, they cost you...!
Hope this post is helpful to community
Thanks
RK💕
Disclaimer and Risk Warning.
The analysis and discussion provided on in.tradingview.com/u/RK_Charts/ is intended for educational purposes only and should not be relied upon for trading decisions. RK_Chaarts is not an investment adviser and the information provided here should not be taken as professional investment advice. Before buying or selling any investments, securities, or precious metals, it is recommended that you conduct your own due diligence. RK_Chaarts does not share in your profits and will not take responsibility for any losses you may incur. So Please Consult your financial advisor before trading or investing.

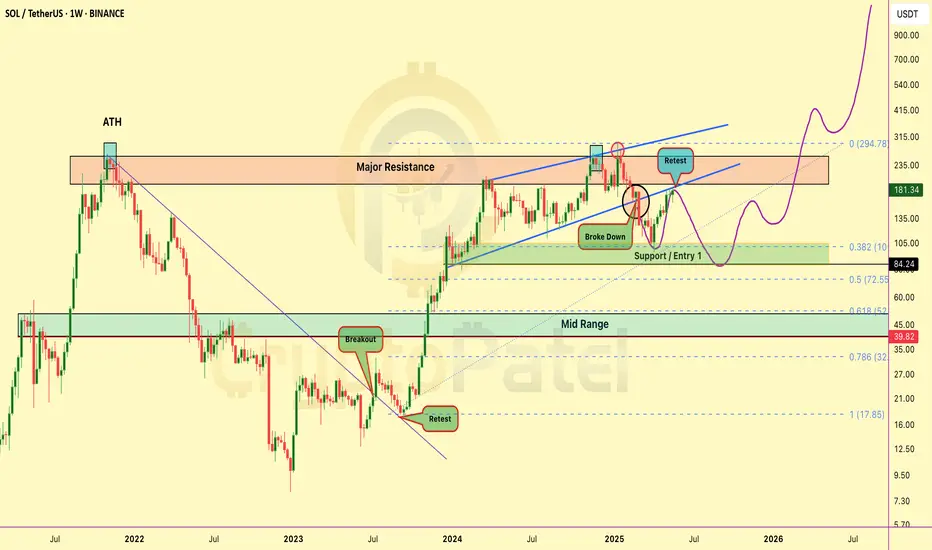
Bearish Setup Loading on Solana? Bearish Setup Loading on Solana? Watch This Key Level Closely
Solana just retested the breakdown zone after losing key support — currently sitting in a danger zone.
Short Interest Zone: $180 – $190
If this area holds as resistance, we could see another move below $150 soon.
Bearish Setup Invalidation: Break above $200 will flip this bias.
Long-Term View? I’m still super bullish on SOLANA in the bigger picture — my long-term target remains $1000 🚀
Risk Management is Key
Never trade without a STOP LOSS — protect your capital.
This is NOT financial advice — DYOR before investing.
Let the chart guide you, not emotions. Stay sharp.
ETHEREUM MEGA CYCLE ALERT🚨 ETHEREUM MEGA CYCLE ALERT 🚨
CRYPTOCAP:ETH just bounced from the same support zone that sparked its last bull run 🔥
This could be the start of Wave 5 — and if history repeats…
🎯 Target: $10,000 ETH
Last time this pattern showed up? ETH went 10x.
Don’t fade the chart.
👉 Like & Retweet if you’re riding this wave
👇 Tag a friend who’s still sleeping on ETH!

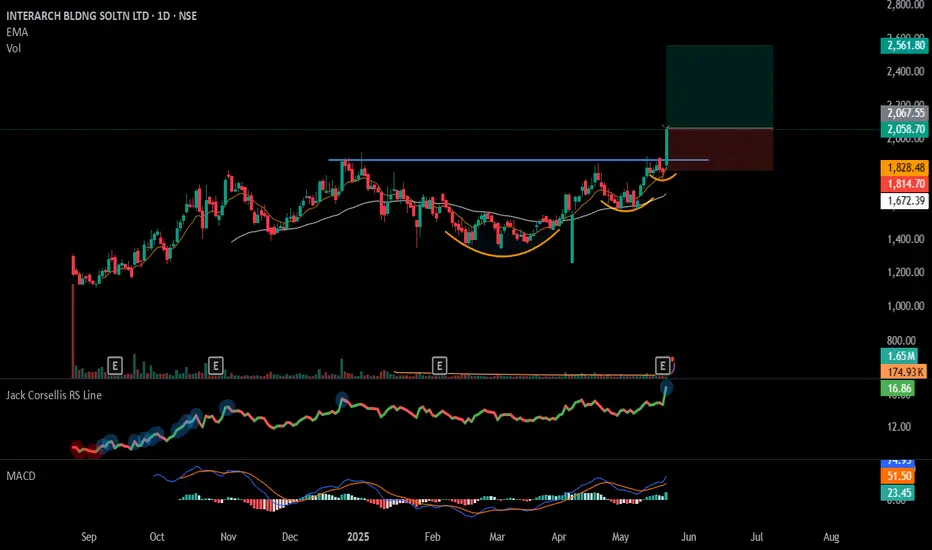
#INTERARCH - VCP BreakOut in Daily Time Frame📊 Script: INTERARCH
Key highlights: 💡⚡
📈 VCP BreakOut in Daily Time Frame.
📈 Price consolidated near Resistance.
📈 Volume spike seen
📈 MACD Crossover
📈 Can go for a swing trade
BUY ONLY ABOVE 2075 DCB
⏱️ C.M.P 📑💰- 2058
🟢 Target 🎯🏆 – 24%
⚠️ Stoploss ☠️🚫 – 12%
️⚠️ Important: Market conditions are Okish, Position size 50% per Trade. Protect Capital Always
⚠️ Important: Always Exit the trade before any Event.
⚠️ Important: Always maintain your Risk:Reward Ratio as 1:2, with this RR, you only need a 33% win rate to Breakeven.
✅Like and follow to never miss a new idea!✅
Disclaimer: I am not SEBI Registered Advisor. My posts are purely for training and educational purposes.
Eat🍜 Sleep😴 TradingView📈 Repeat 🔁
Happy learning with MMT. Cheers!🥂
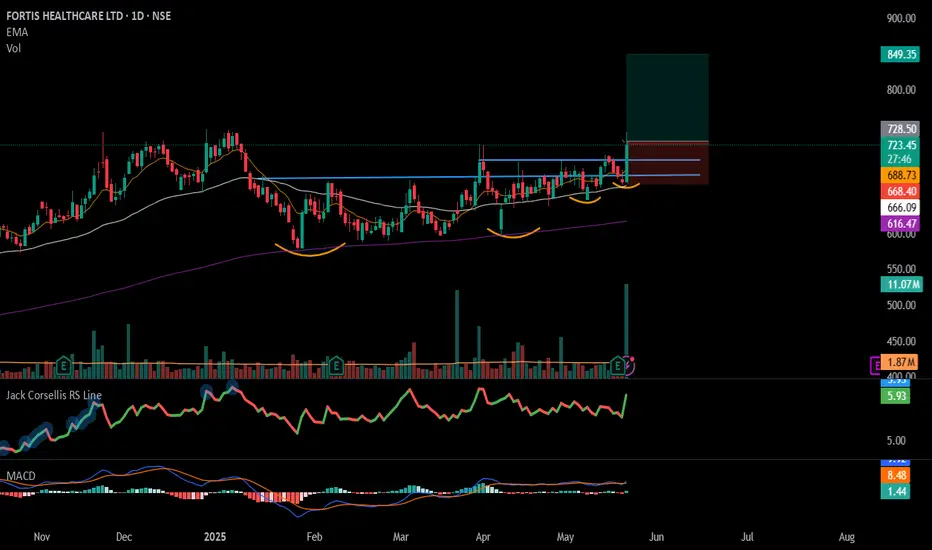
#FORTIS - VCP BreakOut in Daily Time Frame📊 Script: FORTIS
Key highlights: 💡⚡
📈 VCP BreakOut in Daily Time Frame.
📈 Price consolidated near Resistance.
📈 Volume spike seen
📈 MACD Crossover
📈 Can go for a swing trade
BUY ONLY ABOVE 728 DCB
⏱️ C.M.P 📑💰- 722
🟢 Target 🎯🏆 – 16%
⚠️ Stoploss ☠️🚫 – 8%
️⚠️ Important: Market conditions are Okish, Position size 50% per Trade. Protect Capital Always
⚠️ Important: Always Exit the trade before any Event.
⚠️ Important: Always maintain your Risk:Reward Ratio as 1:2, with this RR, you only need a 33% win rate to Breakeven.
✅Like and follow to never miss a new idea!✅
Disclaimer: I am not SEBI Registered Advisor. My posts are purely for training and educational purposes.
Eat🍜 Sleep😴 TradingView📈 Repeat 🔁
Happy learning with MMT. Cheers!🥂
Miss This Retest and You’ll Miss the Rally – CUPID Setup Explain🔴 A – Supply-Demand Conversion Zone
This is the heart of the setup. When price trades below this zone, we stay cautious or short on weak structures. But if it sustains above this, it becomes the launchpad for longs—provided all system conditions align
🟠 B – Ideal Retest Zone
We anticipate a retracement here. A healthy correction towards A zone to tap into fresh demand. This retest is essential to build a valid higher low before breaking out.
🟣 C – All-Time High (ATH) Supply Zone
The ultimate target and strong resistance zone. If our breakout from E happens cleanly, this becomes the next significant level to watch—potential partial booking zone.
🟡 D – Hidden Resistance (WTF)
Subtle yet powerful. This line isn’t obvious to many but holds weight in our top-down analysis. If price cleanly breaks this, it adds conviction to the momentum.
⚪ E – Weekly CT Line
The main trigger. We want price to pull back (B), form a strong base (A), and then break E with a power candle, backed by strong volume
📊 Current Status:
✅ Price above A (bullish tilt activated)
❌ No proper retest at B yet
🔜 Awaiting clean breakout of E post-retest
📌 Hidden resistance D and supply C remain above as Resistances / Hurdles after our Breakout

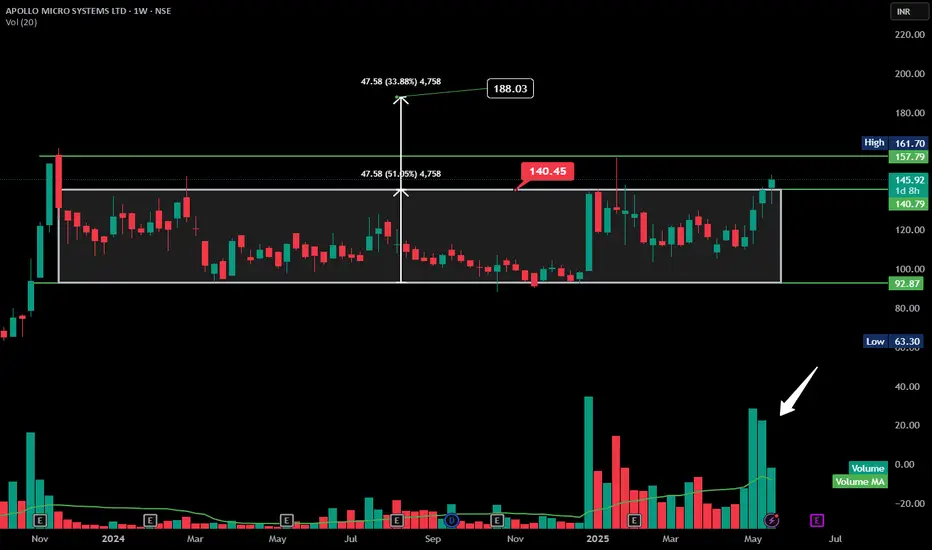
APOLLO rectangular consolidation Breakout - Good volumeHere’s a **technical analysis summary for APOLLO MICRO SYSTEMS LTD** based on the chart you provided:
---
### 📊 **APOLLO MICRO SYSTEMS LTD – Weekly Chart Summary**
* **Trend:** ✅ **Breakout Confirmed**
* Price has broken out above the rectangular consolidation zone after nearly a year of sideways movement.
* **Breakout Zone:**
* Resistance broken: **₹140.45**
* Consolidation range: ₹92.87 to ₹140.45
* **Target Projection (based on rectangle height):**
* Rectangle height = ₹47.58
* Projected Target = ₹140.45 + ₹47.58 = **₹188.03**
* **Current Price:** ₹145.92 (as of last weekly candle)
* **Volume Analysis:** 🔼
* Recent volume spikes confirm breakout strength.
* Volume > average, indicating institutional interest.
* **Support Levels:** * Lower: ₹92.87 (bottom of range)
---
### 📌 **Technical View:**
**Bullish outlook.** The breakout from a long accumulation phase with strong volume is a classic bullish signal. Price may face resistance around ₹157.79 and ₹161.70, but overall sentiment favors upside towards ₹188.
---
$AKT Could Be the Next 10x AI Coin – Here’s Why I’m Bullish Now!CSEMA:AKT Could Be the Next 10x AI Coin – Here’s Why I’m Bullish Now!
Looking to buy CSEMA:AKT in the $1.50–$1.20 zone — strong support + FVG. If price dips, I’ll accumulate.
➡️ Support: $1.50–$1.20
➡️ Resistance: $2 — breakout could send it flying
➡️ Targets: $5 / $10 / $15
➡️ Invalidation: Below $0.80 = bearish shift
Why I’m Bullish:
Decentralized cloud disrupting big tech. Surging demand from AI workloads. Now supports NVIDIA GPUs, and gaining strong traction in AI & Cosmos communities.
A breakout above $2 could lead to massive upside and High Chances to Hit $10+
— DYOR | NFA
