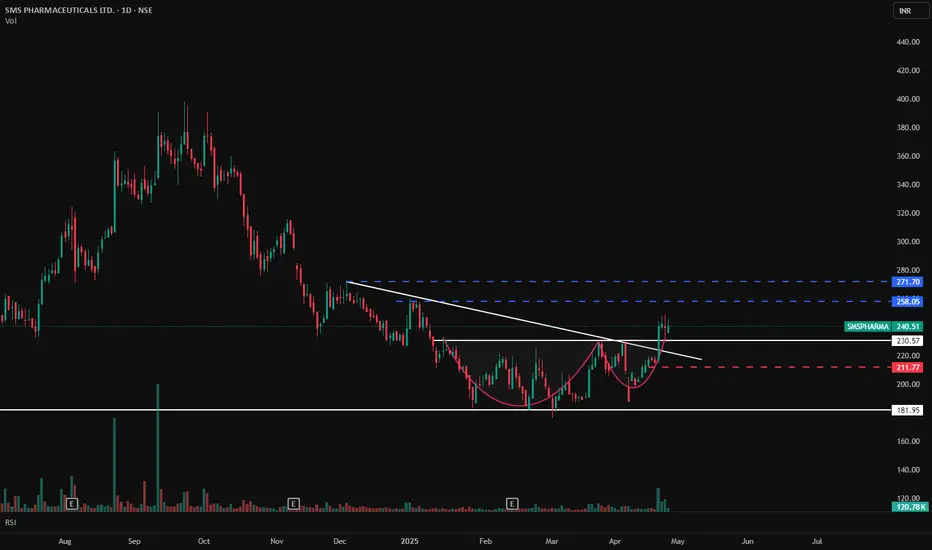
SMS PHARMA - Cup & Handle Breakout with Volume Confirmation📊 SMS PHARMA – Cup & Handle Breakout with Volume Confirmation
🕰️ Timeframe: 1D | 📐 Pattern: Cup & Handle Formation
🔍 Technical Setup:
SMS Pharma has formed a classic Cup & Handle pattern, which is a bullish continuation pattern. The breakout has occurred above the neckline resistance with a clean breakout candle, confirming bullish momentum.
The falling trendline resistance has also been decisively broken, adding further confidence to the breakout strength.
🔑 Key Levels to Watch:
🔵 Resistance (Upside Targets):
₹258.05
₹271.70
🔴 Support Zones:
₹230.57 (neckline support)
₹211.77 (handle base)
₹181.95 (major horizontal support zone)
📊 Volume & Indicators:
🔺 Volume Surge at breakout confirms strength and participation — a good sign for trend continuation.
📈 RSI: 64.58 — close to overbought zone, but still indicating strength. Minor consolidation near ₹240 would be healthy before further up move.
🧠 Bias: Bullish
📉 Any pullback to ₹230–₹235 can offer a good entry opportunity with risk managed below ₹211.
⚠️ Disclaimer: This is an educational analysis and not investment advice. Do your own research before making any trading decisions.
📈 Follow @PriceAction_Pulse for more breakout setups and swing trading ideas!
💬 Drop your thoughts in the comments — will this Cup & Handle breakout hit the ₹270 zone?
Breakout
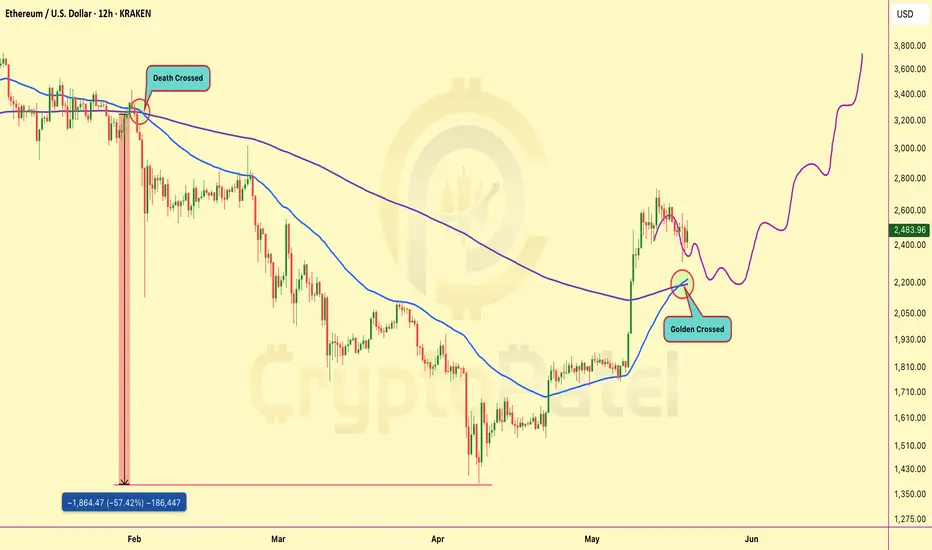
Ethereum Golden Crossed so What Next? $5000?🚨 CHART ALERT: CRYPTOCAP:ETH just flashed a GOLDEN CROSS on the 12H after months of bleeding!
Last time we saw a DEATH CROSS, #Ethereum crashed -57%.
Now it's doing the opposite — this could be the start of a massive pump! 🚀
TARGET? Maybe $3,800-$5000+ soon! 📈
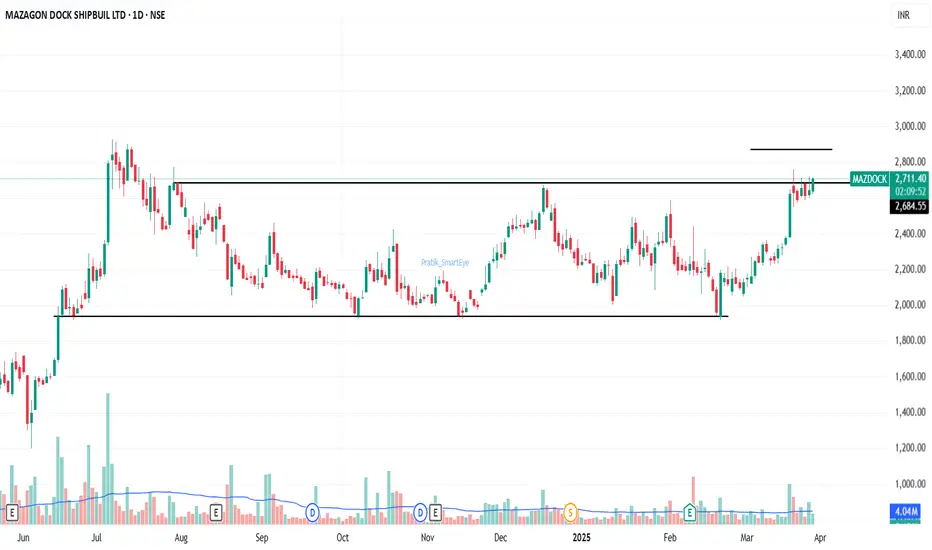
Mazagaon Dock - Consolidation BreakoutMazagon Dock Shipbuilders Ltd. CMP 2700. Attempting a consolidation range breakout. Resistance at all time high levels.
Syrma SGS Tech. at Buy Breakout#Syrma SGS Technology Ltd. Breakout above 570 sustained closing basis. CMP 574.
Resistance 595/685. Expected Level 765. Mid-Long Term.
View negated below 519.
#TMPV #EMS #BreakoutStock #StockInvesting #SmartEye

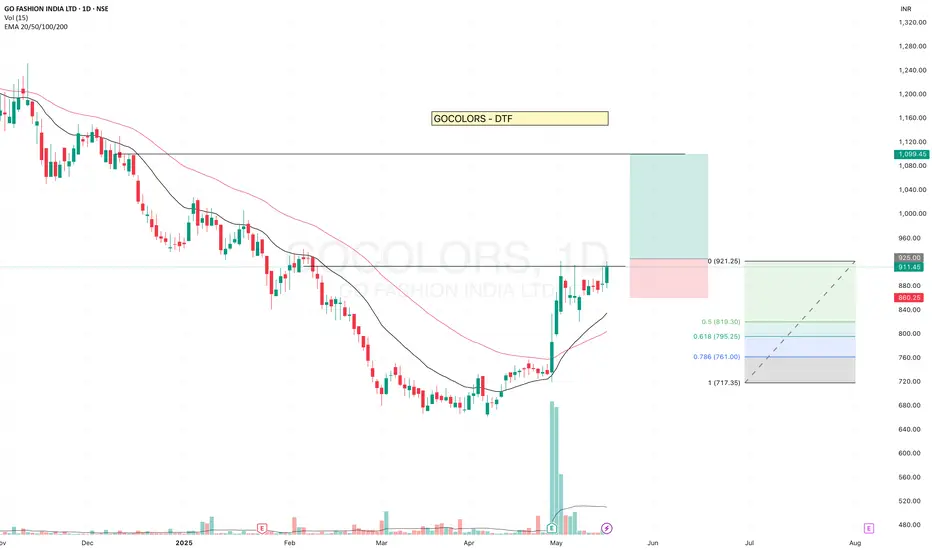
GOCOLORS - Getting ReadyGOCOLORS is getting ready and has been testing the resistance level.
- It is consistently trading above the 20 EMA. Recent high-volume candles suggest clear institutional participation. Although volume is currently drying up, the price is sustaining — a positive sign.
- The stock reversed after touching the 0.5 Fibonacci retracement level, indicating strength.
✅ If you like my analysis, please follow me as a token of appreciation :)
in.tradingview.com/u/SatpalS/
📌 For learning and educational purposes only, not a recommendation. Please consult your financial advisor before investing.
Heavy Accumulation Complete: $ARTY Is Ready to Explode-Don’t MovAMEX:ARTY Chart Looks Perfect – Breakout Coming Soon?
After months of heavy accumulation and technical compression, AMEX:ARTY has officially bottomed out and is now looking extremely undervalued. I’ve personally Bullish at these levels — and here’s why I believe AMEX:ARTY is a massive opportunity before the storm.
Why I Am Bullish on AMEX:ARTY :
✅ Price Action Reversal: The downtrend is broken. AMEX:ARTY has reclaimed key structure and is now sitting firmly in an accumulation zone.
✅ Super Low Market Cap: With a micro-cap valuation and over 80% of tokens already in circulation, this is not just scarce — it’s primed for a supply shock.
✅ Growing Holder Base: On-chain metrics show a steadily increasing number of AMEX:ARTY holders, a strong signal of organic adoption.
✅ Major Catalysts Ahead: Artyfact isn’t just another token — it’s building a next-gen GameFi ecosystem with upcoming launches on PlayStation, Xbox, AppStore, and Google Play. This will potentially attract millions of users globally.
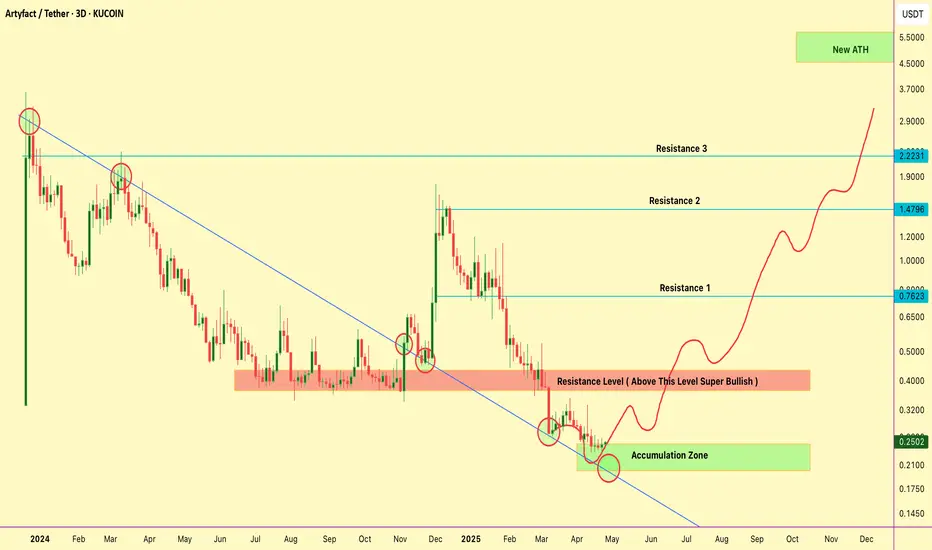
Technical Setup
▶️ Accumulation Zone: $0.20–$0.25 (current entry range)
▶️ Breakout Level (Super Bullish above): $0.37
▶️ Resistance Targets: $0.76/$1.47/$2.22 ( Resistance = Targets)
▶️ Bullrun Target: $5+ — once it clears major resistance, the chart shows high probability for a parabolic run toward new ATHs.
Vascon Engineers – Weekly CT BreakoutA clean Weekly CT breakout supported by strong volume (19M+), signaling strength. Key levels and structure:
🔍 Technical Breakdown:
📏 CT Line (White): Clean breakout from weekly closing-based counter-trendline
🕵️ Hidden Line (Dotted White): Secondary hidden resistance cleared
🟧 ₹45.49 Zone: Major gap-up area on DTF – key retracement demand zone
🔵 200 DEMA (Blue Line): Historical resistance now flipped – strength confirmed
🟥 Supply Zone (₹78–₹83): Overhead resistance – long-term target zone
📈 Volume: 🔥 Spiked to 19M+ – highest since Jan ‘24 – confirms breakout strength

ASTRAMICRO in Bullish modeHey Family, here’s another stock showing a strong technical setup! 🚀
📈 Stock: Astra Microwave Ltd (NSE: ASTRA)
🔍 Key Observations:
📊 Chart Pattern:
The chart shows a Horizontal Breakout from a long-term consolidation zone. This is a bullish continuation setup, signaling potential for further upside as the stock breaks above key resistance levels.
📈 Recent Price Action:
• The stock broke out last week, showing strong bullish momentum.
• This week’s price action indicates a healthy consolidation above the breakout level, suggesting buyer strength and continued interest.
• Volume activity supports the move, adding conviction to the breakout.
💡 Trading Recommendation:
Aggressive Entry:
• Enter based on current price structure to ride the breakout early.
• Use a stop-loss according to your risk tolerance and trading capacity.
Conservative Entry:
• Wait for a decisive move above the highlighted supply zone for confirmation.
• This approach helps minimize risk and confirms sustained strength.
🧠 Rationale:
The breakout from horizontal resistance, backed by solid price and volume structure, suggests a high-probability bullish continuation. Choose an entry style that aligns with your trading plan and risk profile.
🚨 Disclaimer: This is not financial advice. All views are shared for educational purposes only. Always do your own research and manage risk responsibly before making any trading decisions.
What is your view please comment it down and also boost the idea this help to motivate us.

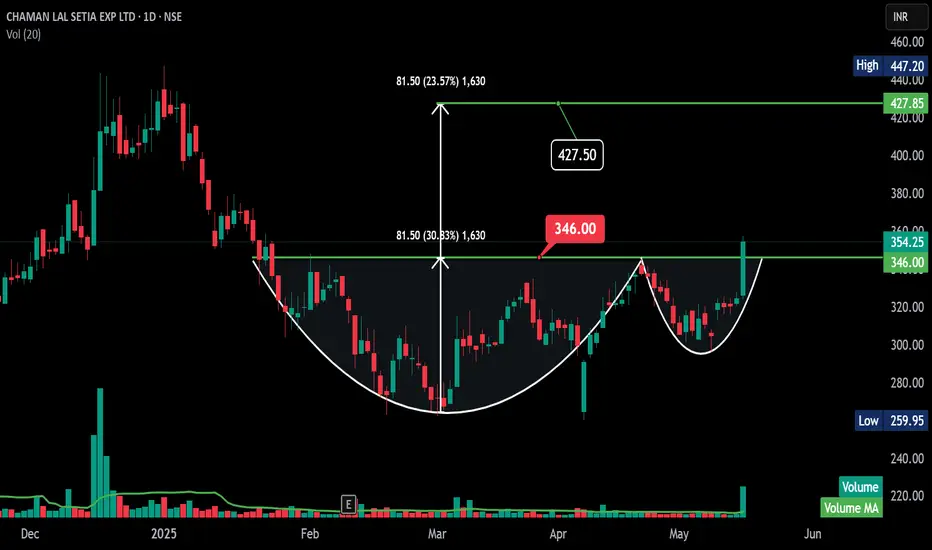
CLSEL -Daily - Cup and Handle -Breakout -Good Volume CHAMAN LAL SETIA EXP LTD daily chart definitely presents a compelling case for a **cup and handle breakout**.
Here's what aligns with your observation:
* **Clear Cup and Handle:** The chart shows a well-formed rounded bottom (the cup) followed by a smaller, slightly downward-sloping consolidation (the handle).
* **Neckline Breakout:** Today's price action (May 17, 2025) shows a strong bullish candle that has decisively broken above the neckline you've identified at ₹346.00.
* **Good Volume:** Importantly, the volume bar for today is significantly higher than the recent average volume, indicating strong buying pressure accompanying the breakout. This adds significant credence to the validity of the breakout.
* **Target:** Your target of ₹427.50 aligns well with the typical measurement for a cup and handle pattern. The depth of the cup (roughly from the low around ₹265 to the neckline at ₹346, which is ₹81) added to the breakout level (₹346) gives a target of ₹427.
**In summary, this looks like a textbook cup and handle breakout for CHAMAN LAL SETIA EXP LTD, supported by good volume, increasing the likelihood of the price reaching your target of ₹427.50.**
It's always wise to consider potential resistance levels along the way and to have a stop-loss in place, but the initial signs here are quite bullish.
BSE Ltd - Breakout Setup, Move is ON...#BSE trading above Resistance of 4169
Next Resistance is at 6645
Support is at 2586
Here is previous chart:
Chart is self explanatory. Levels of breakout, possible up-moves (where stock may find resistances) and support (close below which, setup will be invalidated) are clearly defined.
Disclaimer: This is for demonstration and educational purpose only. This is not buying or selling recommendations. I am not SEBI registered. Please consult your financial advisor before taking any trade.

Mazagon Dock Shipbuilders - Breakout Setup, Move is ON...#MAZDOCK trading above Resistance of 4315
Next Resistance is at 6033
Support is at 2955
Here are previous charts:
Chart is self explanatory. Levels of breakout, possible up-moves (where stock may find resistances) and support (close below which, setup will be invalidated) are clearly defined.
Disclaimer: This is for demonstration and educational purpose only. This is not buying or selling recommendations. I am not SEBI registered. Please consult your financial advisor before taking any trade.

Major Breakout Loading? $LTC Holding Strong at Key SupportMajor Breakout Loading? NYSE:LTC Holding Strong at Key Support
NYSE:LTC is currently consolidating around the $98 level, showing a minor pullback after a failed breakout above the key resistance zone ($101–$128). This red zone has historically acted as a major supply area, rejecting price multiple times.
Key Observations:
➡️ Strong ascending trendline support remains intact since 2019.
➡️ Price retraced from resistance and is hovering near the re-entry zone ($79–$94).
➡️ If LTC reclaims $115+ with volume, a breakout towards $150–$230 is likely.
➡️ Rejection from this zone could lead to another retest of the green re-entry area.
Strategy:
➡️ Watch for bullish confirmation above $115 to aim for mid-term targets.
➡️ Aggressive buyers may consider scaling in between $79–$94 with a tight SL.
➡️ Long-term target remains around $229, $389, and beyond if macro trend continues.

$ETH Pullback Loading: Is $1,800 the Next Big Buy Zone?Ethereum (ETH/USDT) Technical Outlook – Dip Analysis
After a strong bullish impulse breaking the downtrend, ETH is now entering a corrective phase.
Key Observation: Price has filled a major FVG (Fair Value Gap) near $2,500 and is showing signs of rejection.
🔻 Short-Term Bias: Bearish Retracement
We anticipate a pullback into the lower FVG zone between $1,854–$2,186, aligning with the +OB (Order Block) at ~$1,854-$1790 — a strong demand zone.
🟩 Buyers may step in here, making it a potential accumulation zone before the next leg up.
If this zone holds, ETH could resume its uptrend targeting the upper OB/FVG zone near $3,400–$3,600.
Strategy: Watch for bullish confirmation in the $1,800–$2,000 zone for potential long setups.

Explosive Price Action in Premier Explosives – The Name Says It 🧠 Key Technical Insights:
✅ Main Counter-Trendline (CT) Breakout:
A clean breakout above the white CT line with a strong, high-volume bullish candle. This confirms a reversal of the prior corrective structure.
✅ Hidden Resistance Cleared:
The breakout also pierced a WTF hidden line (dotted white), further validating momentum.
✅ SD Conversion Zone Flip:
The green zone highlights a supply-to-demand flip. Price has respected this zone multiple times and now turned it into strong demand support — a textbook S→D conversion.
✅ Candle Structure:
The breakout candle not only has volume and size, but also follows a healthy higher low structure — signifying smart accumulation.

Grasim - Inverted Head and Shoulder Breakout Grasim, posted strong numbers !
A nice Inverted H&S pattern breakout done.
Buy @ 2825-2800
SL 2630
Target : 3250++
RSI is above 60+
MACD is Positive and giving a cross over
along with DMI showing Strength
Stocks looks super strong!

HEROMOTOCO | Weekly Breakout Analysis📉 Yellow Line — Weekly Counter-Trendline (WTF CT) resistance finally broken with conviction. This line guided the entire downtrend and its breach signals a strong structural shift.
📈 Red Parallel Channel — A hidden resistance channel formed during the recent consolidation phase. Price climbed within this tight range and has now broken out, confirming internal strength and directional intent.
🟧 Orange Horizontal Line — Major Monthly Time Frame (MTF) resistance, which now acts as the next crucial target. The breakout candle has enough space to breathe before testing this overhead level.
⚪ White Dotted Line — Daily Time Frame (DTF) counter-trendline that had already been broken earlier, providing early signs of reversal. Serves as a great precursor to the higher timeframe breakout.
📊 Volume: Weekly breakout accompanied by ~5.57M volume — exceeding the 50K benchmark required for WTF breakout validation. Strong institutional interest is evident.
🟩 Structure: Price has formed a higher low base and broke out cleanly above all marked resistances — a sign of strength across all timeframes.

HDFCAMC - Inverted head and shoulder - Breakouttechnical analysis of the HDFC AMC LTD chart you've shared.
Looking at the price action, potential Inverted head and should pattern forming, which is generally considered a bullish sign.
Here's a simplified breakdown:
Head: Notice the rounded bottom shape that formed roughly between Dec 2024 and early April 2025. This suggests a period of consolidation before a potential upward move.
Handle: After reaching a high around ₹4,607, the price has pulled back and is now consolidating in a smaller downward sloping channel (highlighted by the yellow lines). This pullback is forming the "handle" of the pattern.
Breakout Level: The horizontal line you've drawn around ₹4,705 acts as a resistance or neckline. A sustained break above this level could signal the completion of the cup and handle pattern.
Target: Potential target around ₹5,901. This target is often estimated by measuring the depth of the head and adding it to the breakout level.
In simple terms:
The stock price went down, formed a rounded bottom (the head), then went up and is now taking a small dip (the handle). If it breaks above the ₹4,700 level, it might head towards the ₹5,901 area.
Overall, this chart suggests a potential upward move for HDFC AMC if the cup and handle pattern is confirmed with a breakout above ₹4,700.
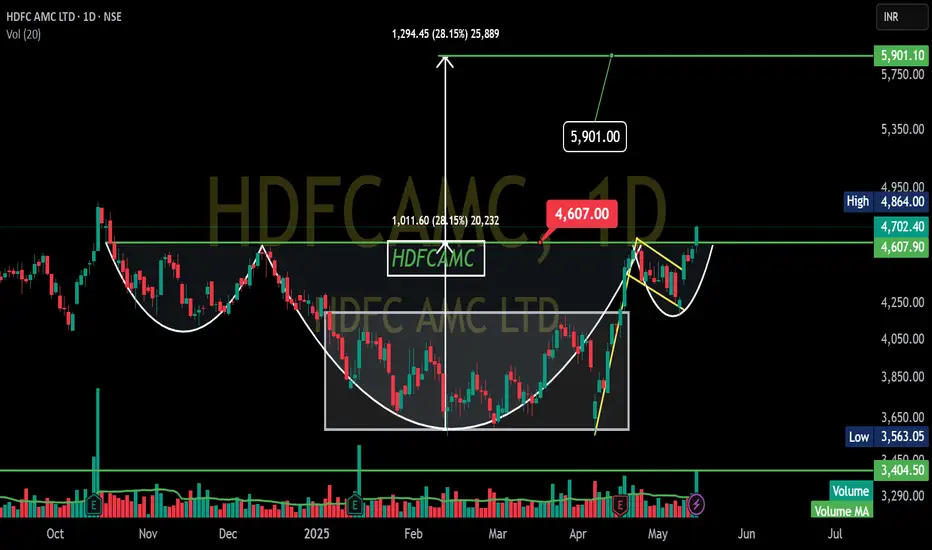
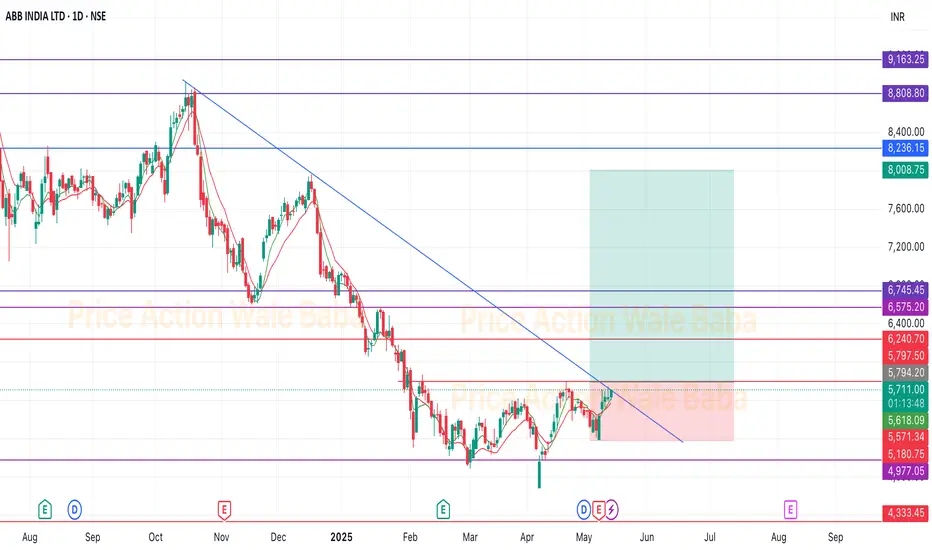
ABB India - BreakoutABB India
Stock is trading near trendline and above the breakout we can see target levels of 7500-8000.
Good to buy and hold for the next 5-12 years to achieve the target.
Buy on dips.
SARDAEN - Breakout WatchlistWhy This Stock?
✅ Base Breakout – Breaking above ₹526.2 with strong volume confirmation (4-5x past trading sessions).
✅ Trading Above Key DMAs – Strong price structure with good RSI.
✅ No Left-Side Resistance – Clean chart structure with potential for an uptrend.
✅ Formation of W Pattern + VCP – Classic bullish continuation setup.
✅ Resisted Market Fall – Showcasing relative strength despite overall weakness.
Safe traders wait for a weekly close above the break-out level ₹526.2.
Key Levels
📌 Entry: ₹538.50
📌 SL (Closing Basis): ₹423.10
📌 Breakout Level: ₹526.2
Fundamentals (Key Metrics)
Market Cap: ₹18,979 Cr.
Stock P/E: 27.9
ROCE: 15.3%
ROE: 14.1%
Sales Growth (YoY): Improving
OPM % YoY Improving
EPS YoY: Improving.
What Could Go Wrong?
⚠️ Overall Market Trend is Bearish – Any weakness in broader indices can drag the stock down.
⚠️ Sectoral Index is Weak – Lack of sectoral strength may limit upside potential.
⚠️ High SL Probability – Strong pullbacks can invalidate the breakout; hence, buy test quantities only.
⚠️ Deep SL
Why This is Worth Watching?
📈 Stocks that Fell Less in Correction – Often become early movers when the market stabilizes.
📈 Volume Picking Up – A good sign that institutional interest might be present.
🚨 Disclaimer: This is not a trade recommendation but a watchlist alert. Do your own research before making any trading decisions. 🚨

Apno Ka BankRBL BANK -
Incorporated in 1943,RBL Bank is a banking company engaged in providing specialized services under five business verticals namely: Corporate Banking, Commercial Banking, Branch & Business Banking, Retail Assets and Treasury & Financial Markets Operations.
CMP 209
This is just to boost my confidence. No Suggestions for buying.
Disclosure: I am not SEBI registered. The information provided here is for educational purposes only. I will not be responsible for any of your profit/loss with these suggestions. Consult your financial advisor before making any decisions.

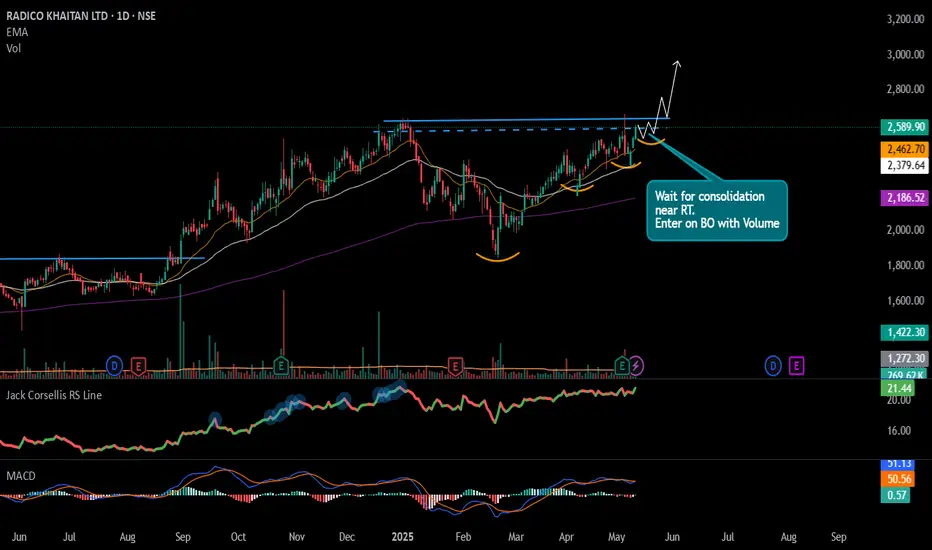
#RADICO - Potential Breakout Keep in WL📊 Script: RADICO
Key highlights: 💡⚡
📈 Roiunding Bottom Pattern / VCP Set up in Daily Time Frame.
📈 Wait for price consolidating near Resistance.
📈 Can Enter on BO with Volume spike or Wait for Pullback
📈 MACD Nutral
📈 One can go for Swing Trade.
BUY ONLY ABOVE NA DCB
⏱️ C.M.P 📑💰- 2589
🟢 Target 🎯🏆 – NA%
⚠️ Stoploss ☠️🚫 – NA%
️⚠️ Important: Market conditions are Okish, Position size 50% per Trade. Protect Capital Always
⚠️ Important: Always Exit the trade before any Event.
⚠️ Important: Always maintain your Risk:Reward Ratio as 1:2, with this RR, you only need a 33% win rate to Breakeven.
✅Like and follow to never miss a new idea!✅
Disclaimer: I am not SEBI Registered Advisor. My posts are purely for training and educational purposes.
Eat🍜 Sleep😴 TradingView📈 Repeat 🔁
Happy learning with MMT. Cheers!🥂
MAN INDUSTRIES – Explosive CT Breakout with Volume Cluster Surge🔴 CT Breakout: The red trendline marks a major weekly CT, now decisively breached by a strong bullish candle.
📈 Volume Cluster Breakout: This is not a one-week spike — it's a cluster of multiple high-volume weeks, indicating consistent accumulation before the breakout. Current volume stands tall at 2.23M+, validating this move.
🟢 Demand Zones Respected: Price respected key demand zones (green boxes) on multiple occasions, forming a strong base with higher lows.
⚪ Hidden Resistances Cleared: Two dotted white hidden resistance lines have been cleanly taken out, suggesting deeper supply has been absorbed.
🟥 Supply Zone Ahead: The next visible hurdle, giving the current move significant open air to run.

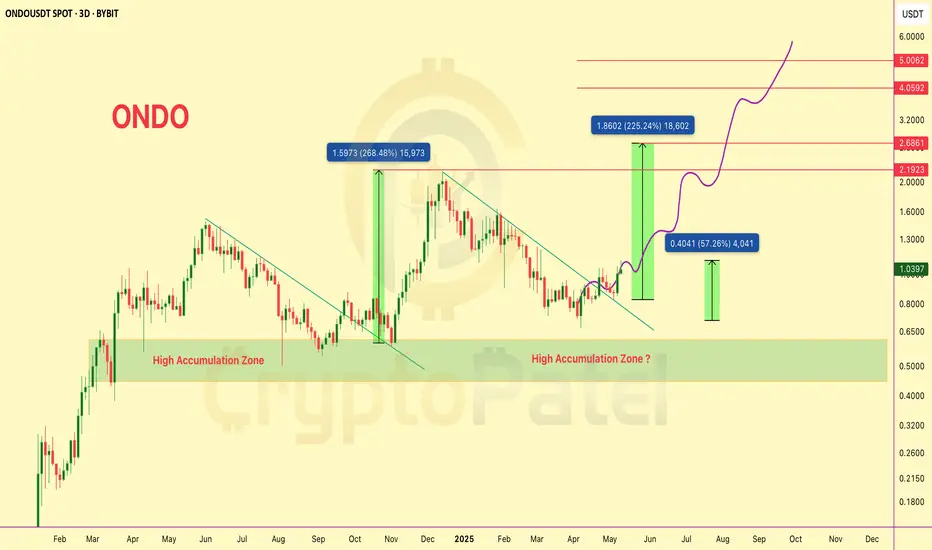
$ONDO/USDT Technical Analysis – Next Move Loading?$ONDO/USDT Technical Analysis – Next Move Loading?
#ONDO just broke out of a long-term descending trendline resistance and is now preparing for its next major wave.
We already shared the dip-entry below $0.80 — and it’s now up 57% from that zone!
Hope you're enjoying the ride.
Chart Highlights:
▶️ Clear breakout from multi-month downtrend.
▶️ Price bounced strongly from the High Accumulation Zone ($0.80-$0.50).
▶️ Previous breakouts resulted in +268% and +225% rallies.
▶️ Short-term move toward $1.30–$1.40 possible if support holds.
▶️ Targets: $2.19 → $2.68 → $4.05 → $5.00+
A healthy pullback or consolidation above $1 could offer the next breakout leg toward $2+.
Stay alert. Accumulation looks complete, and momentum is shifting bullish fast.