Laurus Labs Limited - Breakout Setup, Move is ON...#LAURUSLABS trading above Resistance of 1091
Next Resistance is at 1512
Support is at 806
Here are previous charts:
Chart is self explanatory. Levels of breakout, possible up-moves (where stock may find resistances) and support (close below which, setup will be invalidated) are clearly defined.
Disclaimer: This is for demonstration and educational purpose only. This is not buying or selling recommendations. I am not SEBI registered. Please consult your financial advisor before taking any trade.
Breakout

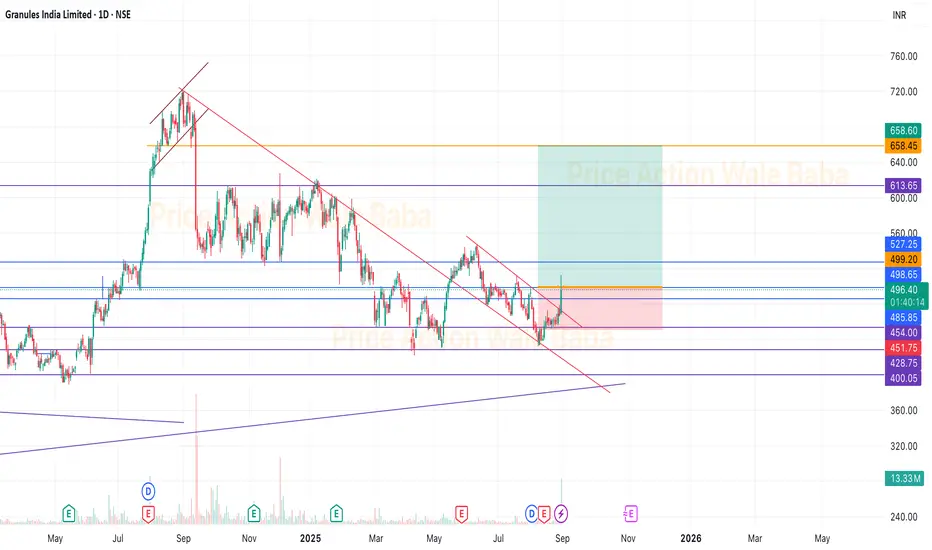
Granules - BreakoutGranules has give good breakout with volume and proper consolidation.
Above 520, we can see proper rally in the stock and good to hold for the long term.
Keep buying on every dip and wait for the next 3-6 months for the good returns.
TATA Elxsi on 1W TFHello Traders,
TATA Elxsi had taken support in April 2025 and bounced back from around 4800 levels.
After that, it has been in Sideways to bearish trend and have agin tested support zone last month.
There was strong pull back seen in the week of 15th Dec 2025. Also this week's closing is with Dragonfly canclestick with less volume.
It seems this is and consolidation phase and it may get trendy after the breakout after closing above 5600 on weekly basis.
Let's see how this stock moves further from current zone.
Note: This post is for information purpose only. Please do not consider this as Trading or investment recommendation.

Breakout and Retest | 1000 + Soon Breakout reistance level of 950 which is now retest level of of this stock .Retest is now going good and stock is ready for four digit move and more after the new high .

360One WAM breakout pattern IIFL all companies are in trend, 360one in capital market section is also doing wonders. risk reward mentioned on the chart, strong breakout expected. pattern is very good

BUY TODAY SELL TOMORROW for 5% - BTST STOCK OPTIONDON’T HAVE TIME TO MANAGE YOUR TRADES?
- Take BTST Stock Option trades at 3:25 pm every day
- Try to exit by taking 4-7% profit of each trade
- Head & Shoulder Breakout in IIFL
BUY TODAY, SELL TOMORROW for 5%

BUY TODAY SELL TOMORROW for 5%DON’T HAVE TIME TO MANAGE YOUR TRADES?
- Take BTST trades at 3:25 pm every day
- Try to exit by taking 4-7% profit of each trade
- SL can also be maintained as closing below the low of the breakout candle
Now, why do I prefer BTST over swing trades? The primary reason is that I have observed that 90% of the stocks give most of the movement in just 1-2 days and the rest of the time they either consolidate or fall
Resistance Breakout in KIRIINDUS
BUY TODAY SELL TOMORROW for 5%

$BNB Technical Analysis: Why $10,000 Is On The RadarBNB Technical Analysis: Why $10,000 Is On The Radar
1️⃣ Historical Precedent
2021 Bull Run: +1,950%
2027 Projection: +1,900% (based on same chart pattern & price structure)
Repeating patterns suggest massive green candles could follow.
2️⃣ Key Support Zones
Strong long-term support: $500 & $200 ( Accumulation zone )
Support is holding, signaling a high-probability base for a breakout.
3️⃣ Price Targets
Short-term: $2,000 → $5,000
Long-term: $10,000 🎯
This aligns with historical price mechanics and measured growth potential.
4️⃣ Risk Management
Accumulate gradually; avoid FOMO buys
Always DYOR & understand support/resistance levels before entering
TA Insight:
BNB shows a pattern identical to previous bull cycles. Breaking current resistance levels could trigger an explosive upward trajectory.
CRYPTOCAP:BNB is technically primed. If you’re strategic now, you’re positioning for multi-year gains.
NFA & DYOR

BUY TODAY SELL TOMORROW for 5%DON’T HAVE TIME TO MANAGE YOUR TRADES?
- Take BTST trades at 3:25 pm every day
- Try to exit by taking 4-7% profit of each trade
- SL can also be maintained as closing below the low of the breakout candle
Now, why do I prefer BTST over swing trades? The primary reason is that I have observed that 90% of the stocks give most of the movement in just 1-2 days and the rest of the time they either consolidate or fall
Resistance Breakout in BIGBLOC
BUY TODAY SELL TOMORROW for 5%

Graphite India - Triangle PatternGraphite India looks good above 645 to buy and hold for the long time.
Targets are 715-815-940.
Buy and accumulate for long time, buy on every dips.
Company doing good work and giving better profit.

Piramal Enterprises – Swing Trade Idea🟢 Trade Setup (Swing)
Buy Zone:
➡️ Near ₹1640 (support + demand area)
Targets:
🎯 T1: ₹1783
🎯 T2: ₹1840
Stop Loss:
⛔ ₹1600
🔍 Technical Reasons
Price respecting 20 & 50 EMA
Recent pullback with low selling volume
RSI holding above 50 → strength intact
Previous resistance now acting as support
Risk–Reward ≈ 1:4

Gold (XAUUSD) – 4H Chart Update | Breakout → Pullback Phase!Hello Everyone,, i hope you all will be doing good, let's check the updates of Gold as it has already done the hard part, the breakout above the previous resistance is in place. After the breakout, price pushed higher and is now doing what strong markets usually do: a pullback.
This pullback is not a sign of weakness yet. In fact, it is a healthy reaction, where the market is testing whether the old resistance can act as new support. This phase decides continuation or failure.
As long as Gold holds above the marked support zone, the structure remains positive, and continuation toward higher levels stays open. What we want to see here is price stabilizing, not panic selling.
If support fails and price starts accepting below it, then the breakout thesis weakens. Until that happens, this move should be treated as a normal post-breakout retest.
Key Levels to Watch
Breakout Level / New Support: Around 4330–4340
Immediate Support Zone: Pullback base area
Upside Continuation: Possible if support holds
Bias: Neutral-to-Bullish above support
Well Guys Most traders get confused during pullbacks. Strong moves rarely go straight up, continuation usually comes after patience, not after chasing candles.
Disclaimer: This analysis is for educational purposes only and should not be taken as financial advice. Please do your own research or consult your financial advisor before investing.
Give likes and comment your thought on my analysis, thankyou everyone!

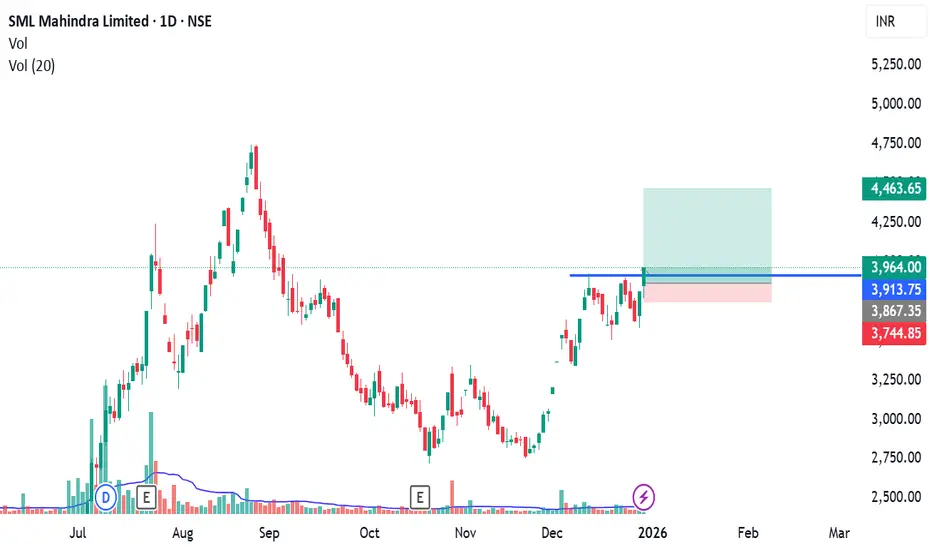
SMLMAH TRADE | SWING SETUPTrade Type: Swing Trade
Time Frame: Short–Medium Term
Bias: Bullish
Trend: Uptrend continuation
KPI Strength Factors ✅
🔹 Price above key EMAs (20/50/100) → bullish structure intact
🔹 Higher high–higher low formation → trend continuation
🔹 Strong bullish candle with good close → buyer control
🔹 Volume expansion on upside → confirmation of strength
🔹 Holding above breakout / demand zone → no distribution signs
Swing Trade Plan:
Buy Zone: Near current levels / minor pullbacks
Targets:
🎯 T1: Previous swing high
🎯 T2: Next resistance zone (positional extension)
Stop Loss: Below recent swing low / demand zone
Swing View:
As long as price holds above the breakout base, SMLMAH is likely to continue its upward move with higher targets in the coming sessions.
For AU Small Finance Bank (AUBANK), the technical setup as of DeFor AU Small Finance Bank (AUBANK), the technical setup as of December 30, 2025, shows the stock is testing a critical psychological and technical resistance zone. The price is hovering near its 52-week highs, suggesting a "buy on breakout" or "buy on dips" strategy.
Technical Snapshot
• Current Price: ~₹975 – ₹986
• Trend: Bullish (Trading above short-term and long-term moving averages)
• RSI: Entering the overbought zone but showing room for a final leg up toward the ₹1,000 mark.
• Key Resistance: ₹985 (Immediate) | ₹1,007 (52-week High)
• Key Support: ₹965 – ₹970 (Strong immediate base) | ₹945 (Major Support)

BUY TODAY SELL TOMORROW for 5%DON’T HAVE TIME TO MANAGE YOUR TRADES?
- Take BTST trades at 3:25 pm every day
- Try to exit by taking 4-7% profit of each trade
- SL can also be maintained as closing below the low of the breakout candle
Now, why do I prefer BTST over swing trades? The primary reason is that I have observed that 90% of the stocks give most of the movement in just 1-2 days and the rest of the time they either consolidate or fall
Resistance Breakout in SASKEN
BUY TODAY SELL TOMORROW for 5%

Bitcoin Is Quiet Again — That’s Usually When Big Moves BeginBitcoin spent multiple sessions moving sideways inside a clearly defined accumulation range.
This kind of price behavior usually signals one thing, strong hands are building positions while weak hands get shaken out.
Sideways markets are not random. They are preparation phases.
Price remained compressed inside the accumulation zone, showing balance between buyers and sellers with declining volatility.
The breakout candle was decisive and impulsive, indicating acceptance above the range rather than a fake move.
After breakout, price pulled back into the prior range high, which is a classic bullish retest behavior.
As long as price holds above the breakout base, the structure favors continuation toward the expansion zone marked on the chart.
A failure back inside the range, would invalidate the breakout and shift momentum back to neutral.
If this helped you read price better, like, follow, or comment, more clean structure studies coming.
⚠️ DISCLAIMER: This analysis is for educational purposes only and is not financial advice. Markets involve risk. Always manage your position size and do your own analysis.

Is $MONAD Bullish? Technical Structure Suggests 10x PotentialPrice is Consolidating in a range-bound Structure Between Well-Defined Support and Resistance, indicating active Accumulation.
🟦 Demand Zone: $0.020–$0.022
🟥 Supply Zone: $0.025–$0.027
A Confirmed Breakout and close above Resistance Would signal a Bullish Structure Shift and Continuation of the Uptrend.
Trend Remains Bullish above $0.016, the recent swing low. A breakdown below invalidates the setup.
Based on Structure and Expansion Potential, 10x Upside is possible in a Strong Altseason.
Volatility remains High, Risk Management is Mandatory.
NFA & DYOR

BUY TODAY SELL TOMORROW for 5%DON’T HAVE TIME TO MANAGE YOUR TRADES?
- Take BTST trades at 3:25 pm every day
- Try to exit by taking 4-7% profit of each trade
- SL can also be maintained as closing below the low of the breakout candle
Now, why do I prefer BTST over swing trades? The primary reason is that I have observed that 90% of the stocks give most of the movement in just 1-2 days and the rest of the time they either consolidate or fall
Resistance Breakout in HINDZINC
BUY TODAY SELL TOMORROW for 5%

BUY TODAY SELL TOMORROW for 5%DON’T HAVE TIME TO MANAGE YOUR TRADES?
- Take BTST trades at 3:25 pm every day
- Try to exit by taking 4-7% profit of each trade
- SL can also be maintained as closing below the low of the breakout candle
Now, why do I prefer BTST over swing trades? The primary reason is that I have observed that 90% of the stocks give most of the movement in just 1-2 days and the rest of the time they either consolidate or fall
Cup & Handle Breakout in INFOBEAN
BUY TODAY SELL TOMORROW for 5%

BUY TODAY SELL TOMORROW for 5%DON’T HAVE TIME TO MANAGE YOUR TRADES?
- Take BTST trades at 3:25 pm every day
- Try to exit by taking 4-7% profit of each trade
- SL can also be maintained as closing below the low of the breakout candle
Now, why do I prefer BTST over swing trades? The primary reason is that I have observed that 90% of the stocks give most of the movement in just 1-2 days and the rest of the time they either consolidate or fall
Trendline Breakout in ASHAPURMIN
BUY TODAY SELL TOMORROW for 5%

Vishnu Chemicals: Bullish - long consolidation breakout at 575Vishnu Chemicals: CMP 547.95
Trend: Bullish - long consolidation breakout levels.
Resistance: 560/575/638/755
Support: 531/512/500
Sustained breakout above 560-575 levels supported with volumes can give a up move.

BUY TODAY SELL TOMORROW for 5% - BTST STOCK OPTIONDON’T HAVE TIME TO MANAGE YOUR TRADES?
- Take BTST Stock Option trades at 3:25 pm every day
- Try to exit by taking 4-7% profit of each trade
- Head & Shoulder Breakout in IIFL
BUY TODAY, SELL TOMORROW for 5%

BUY TODAY SELL TOMORROW for 5%DON’T HAVE TIME TO MANAGE YOUR TRADES?
- Take BTST trades at 3:25 pm every day
- Try to exit by taking 4-7% profit of each trade
- SL can also be maintained as closing below the low of the breakout candle
Now, why do I prefer BTST over swing trades? The primary reason is that I have observed that 90% of the stocks give most of the movement in just 1-2 days and the rest of the time they either consolidate or fall
Cup & Handle Breakout in ASIAN TILES
BUY TODAY SELL TOMORROW for 5%
