XAUUSD (Gold) | Bull vs Bear Scenerio | 28th Jan'2026XAUUSD (Gold) | Technical Outlook | 28 Jan 2026
Gold (XAU/USD) is trading near 5,291, maintaining a strong bullish trend across intraday, daily, and higher timeframes. Price is holding firmly above all major moving averages (MA5–MA200), confirming trend strength. Momentum indicators (MACD, ADX, ROC, Bull/Bear Power) support further upside, while oscillators (RSI, Stoch RSI, CCI, Williams %R) remain overbought, indicating strong momentum with chances of short-term pullbacks. Volatility remains high (ATR ~59), so key levels are crucial.
Key Levels
Support: 5,232 | 5,198 | 5,135 | 5,101
Resistance: 5,295 | 5,330 | 5,392
Intraday Pivot: 5,232
Breakout & Breakdown
Bullish (Breakout):
Buy Above: 5,295
Targets: 5,330 → 5,392 → 5,400
Trend continuation above resistance
Bearish (Breakdown):
Sell Below: 5,232
Targets: 5,198 → 5,135
Below 5,100 → 5,000–4,950 (correction zone)
Conclusion
Overall trend remains bullish. Buy-on-dips above support is preferred, but avoid chasing near highs due to overbought conditions. Trade strictly on breakout or breakdown confirmation with proper risk management.
Disclaimer :For educational purposes only. Gold trading involves high risk. Always use stop-loss and trade as per your risk appetite.
Breakoutsignal

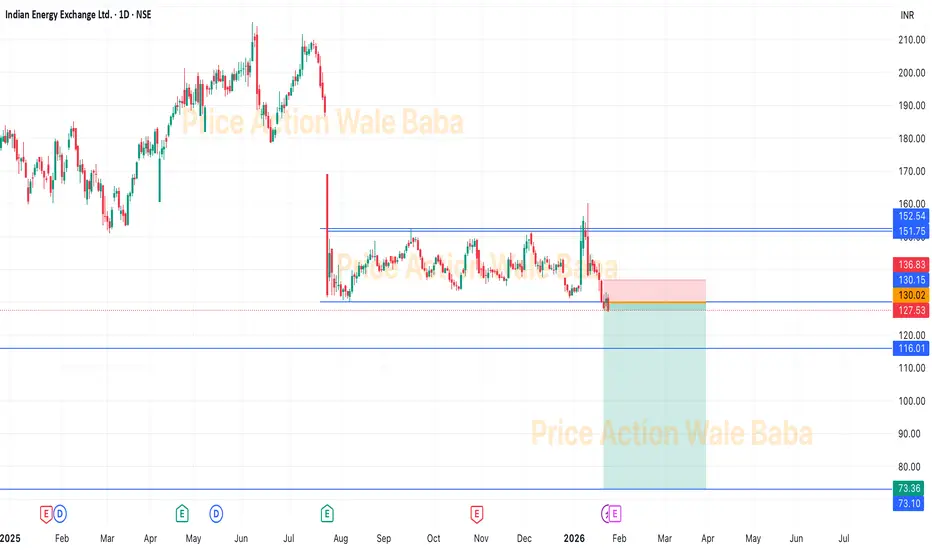
IEX - Box BreakoutIEX was consolidating in the box from the long time and now it's out of the box.
It is good to short IEX and hold for the target of 115-110
Although, you can keep in the hold for the target of 80-75 as we know government policy are comes against IEX's monopoly.
iifl finance 5min chart pe clean bullish breakout iifl finance 5min chart pe clean bullish breakout dikh raha hai
price ne descending trendline ke upar strong breakout diya hai with volume support. consolidation ke baad higher highs & higher lows ban rahe hain, jo bullish continuation signal hai.
🔹 trade plan (intraday / short-term swing)
buy above: 651
stop loss: 639
targets:
t1: 6500
t2: 6530
🔹 technical view
trendline breakout confirmed
price vwap ke upar sustain kar raha hai
volume spike breakout candle pe visible
retest zone near 645–647 holding strong
jab tak price 639 ke upar hold karta hai, bullish bias intact rahega. below 639 close aane par setup invalidate ho jayega.
risk reward approx 1:2+

groww incredible trade groww buy@163
sl @160 target @175
📈 Trade Description – GROWW (VCP Setup #1)
GROWW is forming a textbook Volatility Contraction Pattern after a strong prior up-move.
Price is holding above key moving averages and volatility is shrinking with each pullback, indicating institutional accumulation.
A high-volume breakout above the contraction high can trigger a fresh momentum leg.
Bias: Bullish
Strategy: Buy on breakout with volume confirmation
Risk: Low (tight stop below last contraction low)

BSE cmp 2790.60 by Daily Chart viewBSE cmp 2790.60 by Daily Chart view
- Support Zone 2570 to 2670 Price Band
- Resistance Zone 2790 to 2915 Price Band
- Bullish "W" Double Bottom by Support Zone base
- Rising Support Trendline well sustained and respected
- Falling Resistance Zone Trendline Breakout been attempted
- Volumes spiked today with good sync with the avg traded qty

Engineers India Ltd (EIL) – Range Base Breakout StudyStudy Overview:
Price has been consolidating in a strong demand zone for a long time.
Despite previous selling pressure, no aggressive sell volume is visible.
RSI is holding above mid-zone, showing strength and accumulation.
MACD is gradually turning positive, hinting at a momentum shift.
What to watch:
🔹 Short-term opportunity on a clean breakout above the range.
🔹 Long-term hold potential if price sustains above resistance with volume.
🔹 Structure suggests smart money accumulation rather than distribution.
📌 This setup looks more like controlled consolidation before a possible upside breakout.
⚠️ Note: This is a technical study for educational purposes only, not a buy/sell recommendation.

Piramal Enterprises – Swing Trade Idea🟢 Trade Setup (Swing)
Buy Zone:
➡️ Near ₹1640 (support + demand area)
Targets:
🎯 T1: ₹1783
🎯 T2: ₹1840
Stop Loss:
⛔ ₹1600
🔍 Technical Reasons
Price respecting 20 & 50 EMA
Recent pullback with low selling volume
RSI holding above 50 → strength intact
Previous resistance now acting as support
Risk–Reward ≈ 1:4

For AU Small Finance Bank (AUBANK), the technical setup as of DeFor AU Small Finance Bank (AUBANK), the technical setup as of December 30, 2025, shows the stock is testing a critical psychological and technical resistance zone. The price is hovering near its 52-week highs, suggesting a "buy on breakout" or "buy on dips" strategy.
Technical Snapshot
• Current Price: ~₹975 – ₹986
• Trend: Bullish (Trading above short-term and long-term moving averages)
• RSI: Entering the overbought zone but showing room for a final leg up toward the ₹1,000 mark.
• Key Resistance: ₹985 (Immediate) | ₹1,007 (52-week High)
• Key Support: ₹965 – ₹970 (Strong immediate base) | ₹945 (Major Support)

MIDHANI — Base Breakout After Prolonged Consolidation seing this from 13nov First entry @1120 50-60% gain
thinking to hold untill big green or red candel apears indicating operator exit what do you think about this

Neogen Chemicals Ltd — Base Breakout After Capitulation Sell-OffNeogen Chemicals witnessed a sharp capitulation decline followed by high-volume demand emergence, signaling potential exhaustion of sellers. After forming a V-shaped recovery from the lows, the stock is now reclaiming a key demand zone near ₹1,150–1,165, which earlier acted as strong support.
Price has successfully closed above the base, indicating:
✔️ Change in character (ChoCH)
✔️ Short-term trend reversal
✔️ Acceptance above demand
The structure suggests a range expansion move toward the next supply zone if the breakout sustains.
📊 Technical Highlights
Strong volume spike near the bottom → institutional absorption
Higher low formation → buyers gaining control
Break & hold above base → low-risk entry zone
Upside projection toward ₹1,300–1,360
Risk well-defined below ₹1,100
🧠 Fundamental Context
Neogen Chemicals operates in the specialty chemicals and lithium-based intermediates space, catering to high-value, niche segments with export exposure. The company benefits from:
Growing demand from pharma, agrochemicals, and advanced chemistry
Strong positioning in custom synthesis
Long-term tailwinds from EV and battery chemistry themes
While short-term price volatility existed, the business fundamentals remain intact, making this technical base formation more meaningful.

Titan breaout sustained above levelsTitan breaout sustained above levels it is an evergreen stock to buy for investing and for stort term also

BUY TODAY SELL TOMORROW for 5%DON’T HAVE TIME TO MANAGE YOUR TRADES?
- Take BTST trades at 3:25 pm every day
- Try to exit by taking 4-7% profit of each trade
- SL can also be maintained as closing below the low of the breakout candle
Now, why do I prefer BTST over swing trades? The primary reason is that I have observed that 90% of the stocks give most of the movement in just 1-2 days and the rest of the time they either consolidate or fall
Trendline Breakout in BSOFT
BUY TODAY SELL TOMORROW for 5%

BUY TODAY SELL TOMORROW for 5%DON’T HAVE TIME TO MANAGE YOUR TRADES?
- Take BTST trades at 3:25 pm every day
- Try to exit by taking 4-7% profit of each trade
- SL can also be maintained as closing below the low of the breakout candle
Now, why do I prefer BTST over swing trades? The primary reason is that I have observed that 90% of the stocks give most of the movement in just 1-2 days and the rest of the time they either consolidate or fall
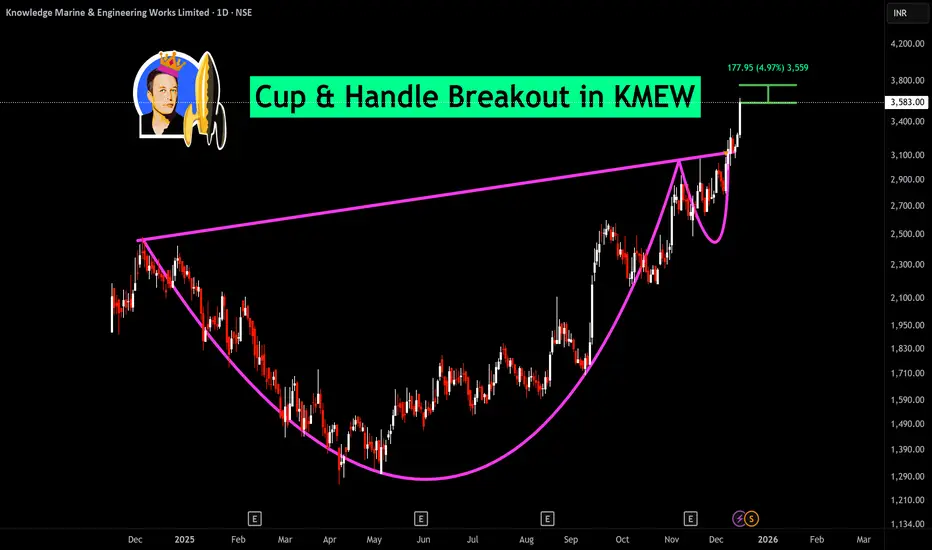
Cup & Handle Breakout in KMEW
BUY TODAY SELL TOMORROW for 5%
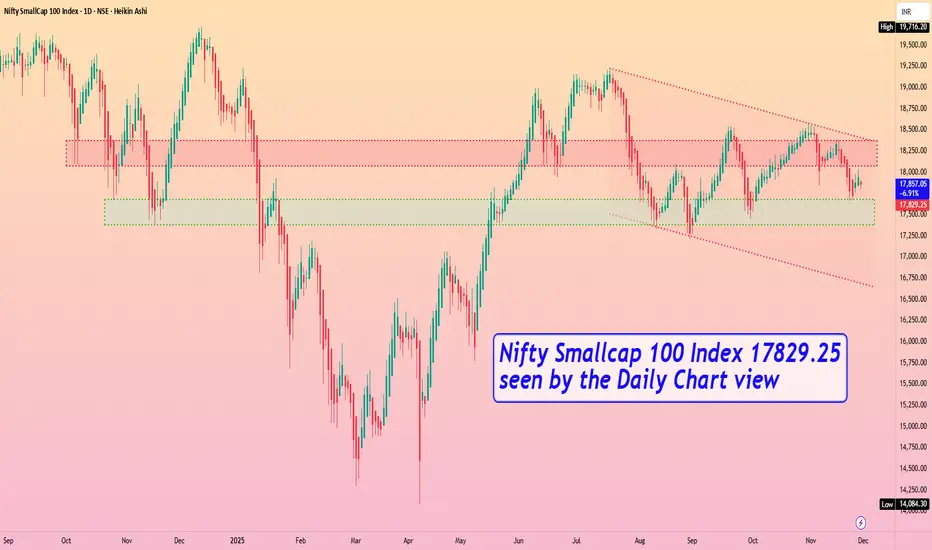
Nifty Smallcap 100 Index 17829.25 by Daily Chart viewNifty Smallcap 100 Index 17829.25 by Daily Chart view
- Support Zone 17375 to 17675 Index Band
- Resistance Zone to 18075 to 18375 Index Band
- Index formed Lower High Lower Lows since mid of July 2025
- Current status indicating Support Zone shoulder for probable upside
- Let us all hope for the best to happen and keep our fingers crossed 🤞🏽🤞🏽🤞🏽🤞🏽🤞🏽
- IF ..... next full week we see closure above Support Zone with breach into Resistance Zone then fresh upside breakout may be anticipated.
BUY TODAY SELL TOMORROW for 5%DON’T HAVE TIME TO MANAGE YOUR TRADES?
- Take BTST trades at 3:25 pm every day
- Try to exit by taking 4-7% profit of each trade
- SL can also be maintained as closing below the low of the breakout candle
Now, why do I prefer BTST over swing trades? The primary reason is that I have observed that 90% of the stocks give most of the movement in just 1-2 days and the rest of the time they either consolidate or fall
Cup & Handle Breakout in KTKBANK
BUY TODAY SELL TOMORROW for 5%

BUY TODAY SELL TOMORROW for 5%DON’T HAVE TIME TO MANAGE YOUR TRADES?
- Take BTST trades at 3:25 pm every day
- Try to exit by taking 4-7% profit of each trade
- SL can also be maintained as closing below the low of the breakout candle
Now, why do I prefer BTST over swing trades? The primary reason is that I have observed that 90% of the stocks give most of the movement in just 1-2 days and the rest of the time they either consolidate or fall
Resistance Breakout in AIMTRON
BUY TODAY SELL TOMORROW for 5%

BUY TODAY SELL TOMORROW for 5%DON’T HAVE TIME TO MANAGE YOUR TRADES?
- Take BTST trades at 3:25 pm every day
- Try to exit by taking 4-7% profit of each trade
- SL can also be maintained as closing below the low of the breakout candle
Now, why do I prefer BTST over swing trades? The primary reason is that I have observed that 90% of the stocks give most of the movement in just 1-2 days and the rest of the time they either consolidate or fall
Round Bottom & Retested Breakout in
HEMIPROP
BUY TODAY SELL TOMORROW for 5%

BUY TODAY SELL TOMORROW for 5%DON’T HAVE TIME TO MANAGE YOUR TRADES?
- Take BTST trades at 3:25 pm every day
- Try to exit by taking 4-7% profit of each trade
- SL can also be maintained as closing below the low of the breakout candle
Now, why do I prefer BTST over swing trades? The primary reason is that I have observed that 90% of the stocks give most of the movement in just 1-2 days and the rest of the time they either consolidate or fall
Resistance Breakout in PSPPROJECT
BUY TODAY SELL TOMORROW for 5%

BUY TODAY SELL TOMORROW for 5%DON’T HAVE TIME TO MANAGE YOUR TRADES?
- Take BTST trades at 3:25 pm every day
- Try to exit by taking 4-7% profit of each trade
- SL can also be maintained as closing below the low of the breakout candle
Now, why do I prefer BTST over swing trades? The primary reason is that I have observed that 90% of the stocks give most of the movement in just 1-2 days and the rest of the time they either consolidate or fall
Resistance Breakout in POWERINDIA
BUY TODAY SELL TOMORROW for 5%

BUY TODAY SELL TOMORROW for 5%DON’T HAVE TIME TO MANAGE YOUR TRADES?
- Take BTST trades at 3:25 pm every day
- Try to exit by taking 4-7% profit of each trade
- SL can also be maintained as closing below the low of the breakout candle
Now, why do I prefer BTST over swing trades? The primary reason is that I have observed that 90% of the stocks give most of the movement in just 1-2 days and the rest of the time they either consolidate or fall
Trendline Breakout in LATENTVIEW
BUY TODAY SELL TOMORROW for 5%

BUY MAX HEALTHCARE FOR TRADINGMax healthcare gives a breakout on weekly as well as daily time frame to consider a buy call for short term trading perspective with strictly stoploss. 1:2 Risk Reward Ratio. if All Time High break out than i repeat my targets in next few days. Stay Tuned. This is only for educational purposes do not consider as a recommendation. do your home work first not guarantee return.

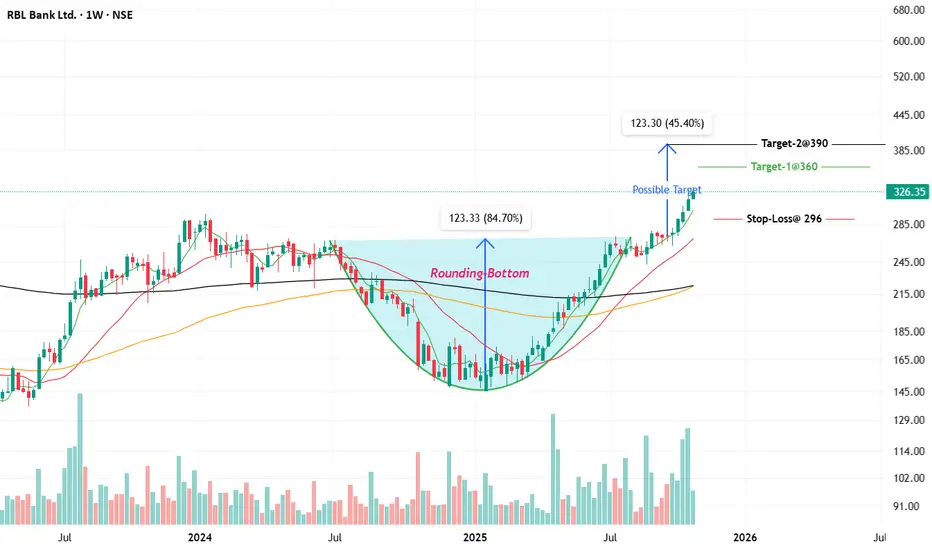
RBL Bank on the Verge: Weekly Chart Signals a Fresh Trend BreakRBL Bank has shown strong bullish momentum in its weekly chart, supported by rising price, strong moving averages, and a robust uptrend. The stock is currently trading near its 52-week high at around ₹326, indicating significant strength in the ongoing trend.
Technical Indicator Analysis
• Price and Trend: The stock has risen over 42% in the past year and over 7% in the last month, supported by strong volume and positive sentiment.
• Moving Averages: The 50-week and 200-week moving averages are sloping upwards, and the price is trading well above both, which is a bullish sign.
• Relative Strength: RSI (implied by the breakout and new highs) likely remains in bullish territory, confirming momentum.
• Support and Resistance: The stock has immediate support near ₹300 and strong resistance is seen at the recent high of ₹331.50.
Chart Pattern and Target
• Pattern Observed: A continuation breakout, possibly following a flag or rounding bottom pattern, is implied. The price action has broken past key resistances, and the trend remains strong.
• Entry Point: New entries can be considered on minor pullbacks toward ₹310-315, or on a weekly close above ₹331.50 for momentum traders.
• Target: Immediate target is the all-time range toward ₹350 . If momentum continues, longer-term targets could be in the ₹380–400 zone, using previous swing projections and extension from current levels.
• Stop Loss: Suggested stop-loss for positional trades is below ₹296 on a closing basis to protect gains and manage downside risk.
Overall, the weekly technical for RBL Bank support a bullish stance with buy-on-dip and breakout strategies, as long as the price remains above the key moving averages and stop-loss.
📌 Thanks a ton for checking out my idea! Hope it sparked some value for you.
🙏 Follow for more insights
👍 Boost if you found it helpful
✍️ Drop a comment with your thoughts below!
BUY TODAY SELL TOMORROW for 5%DON’T HAVE TIME TO MANAGE YOUR TRADES?
- Take BTST trades at 3:25 pm every day
- Try to exit by taking 4-7% profit of each trade
- SL can also be maintained as closing below the low of the breakout candle
Now, why do I prefer BTST over swing trades? The primary reason is that I have observed that 90% of the stocks give most of the movement in just 1-2 days and the rest of the time they either consolidate or fall
Resistance Breakout in IDBI
