Garuda Construction – Cup & Handle Breakout | Swing Trade PlanGaruda Construction has given a textbook Cup & Handle breakout backed by strong volume and solid fundamentals.
Technical Analysis
A Cup & Handle pattern has formed with a neckline breakout above ₹200.
Stock closed strongly at ₹216.33 (+9.66%) with massive volume (7.5M vs 3.1M avg) - confirms institutional buying.
Price is trading above 20 EMA (₹200) and 50 EMA (₹188) → strong uptrend.
Weekly timeframe also shows a fresh breakout, adding higher timeframe confluence.
Structure remains bullish as long as it holds above ₹200 demand zone.
Fundamental key area
Construction & Engineering segment seeing strong order inflows, aiding medium-term growth. Strong QoQ Growth: Latest quarter (Jun-25) revenue jumped 55% to ₹125 Cr.
ROE ~29%, OPM ~29% → excellent efficiency.
Balance Sheet: Debt levels appear very low, improving stability.
Valuation: Mid-cap with growth momentum, attractive vs large-cap peers.
Swing Trade Plan
Entry Zone: ₹212–216
Stop Loss: ₹198 (below neckline + demand zone)
Targets:
T1: ₹225 (early booking)
T2: ₹240 (swing continuation)
T3: ₹260 (Cup & Handle measured move)
Risk–Reward: Up to 1:2.4
Note: This is an educational swing trade analysis based on price action + fundamentals. Not financial advice — do your own due diligence before trading.
Breakoutstock

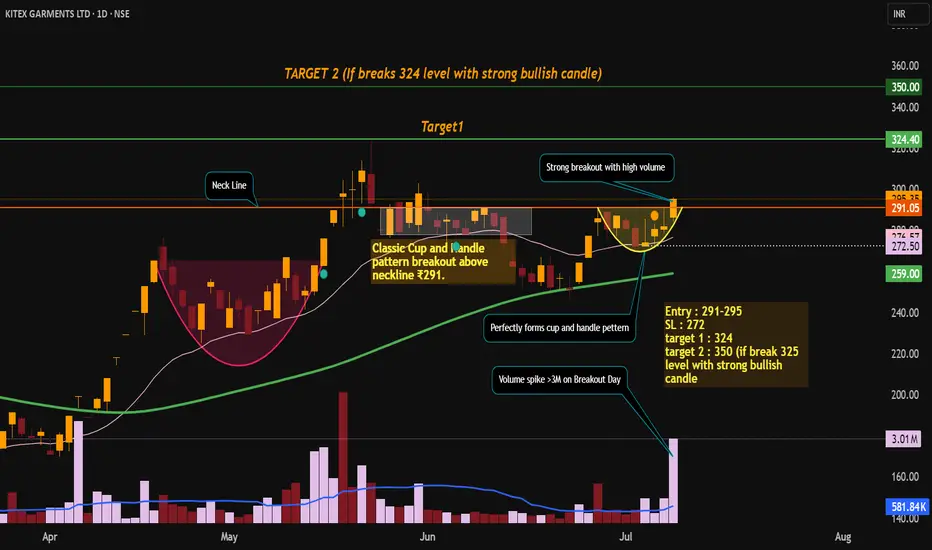
KITEX GARMENTS LTD – SWING TRADE PLANKITEX GARMENTS has delivered a volume-backed breakout from a bullish cup & handle pattern. The technicals are aligned with improving fundamentals, making this a high-probability swing trade setup.
✅ Cup & Handle Breakout 💥
📈 Entry: ₹291–₹295 | 🎯 Target: ₹324 / ₹350 | 🔐 SL: ₹272
🧠 Strong volume + solid fundamentals
Technical Analysis
Classic Cup and Handle pattern breakout above neckline ₹291.
Strong bullish close at ₹295.35 with high volume (3.01M vs avg 580K).
Price above 20(276) & 50 (259) EMA which confirms confirms bullish trend. Both the EMAs slopping upward which shows positive trend structure.
price can take support near ₹274–₹276 (handle + 20 EMA).
Resistance ₹324 (Target) (swing high), ₹350 (measured move target).
Volume spike confirms real breakout, not a fake breakout.
Demand zone breakout with institutional interest.
FUNDAMENTAL KEYS WHICH SUPPORT STOCK FOR BULLISH TREND.
KITEX is financially sound with low debt, stable returns, and improving growth. Fundamentals support bullish technical setup. High promoter confidence (>60%). Consistently company's sales growth is improving Q-o-Q.
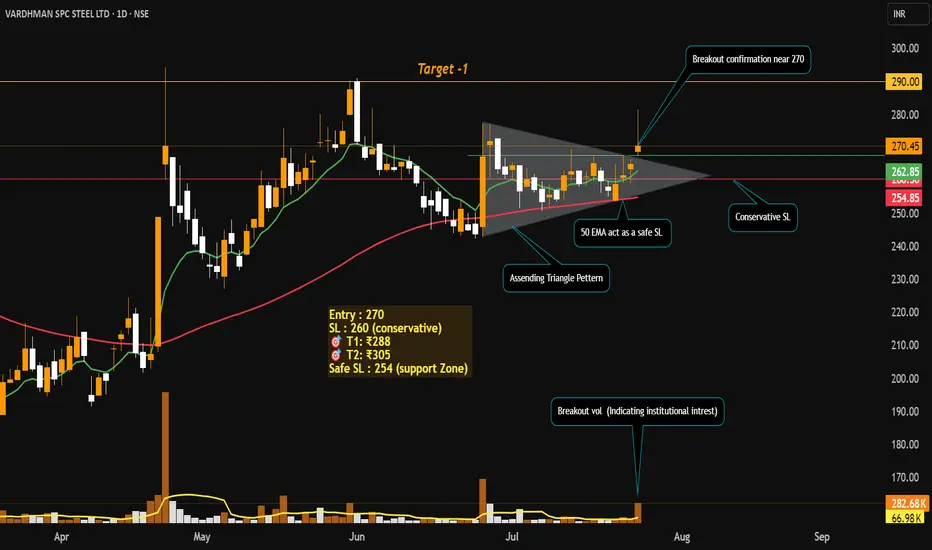
Swing Trade Idea: Vardhman Special Steels Ltd (NSE: VSSL)Technical Setup
Ascending Triangle Breakout on Daily Timeframe
Volume Spike 4x average volume on breakout day — strong institutional confirmation.
both the EMAs Bullish crossover (Price trading above both the EMAs).
RSI showing bullish momentum (60-65).
Price Action Strategy
Price broke out from resistance zone with strong bullish candle and closed near the high.
Previous resistance of ₹270 now acts as support.
Fundamentals
Promoter Holding: High, backed by Aichi Steel (Toyota Group).
Debt/Equity: Low (~0.12) → Strong solvency.
Strong financials: ROE / ROCE ~12.4% / ~17.8%
Revenue Growth: Consistent YoY
Valuation: Reasonable P/E (~18–20x)
My View: Entered at breakout with strong confirmation. Trail SL and book profits step-by-step. Holding for higher targets as long as price respects 9 EMA.
Chemfab Alkalis Ltd. at Buy Support. CMP 1124Chemfab Alkalis Ltd. at Buy Support. CMP 1124.
Breakout above 1183.50 closing basis.
Expected levels of 1466.
Reversal from strong support zone with volumes.

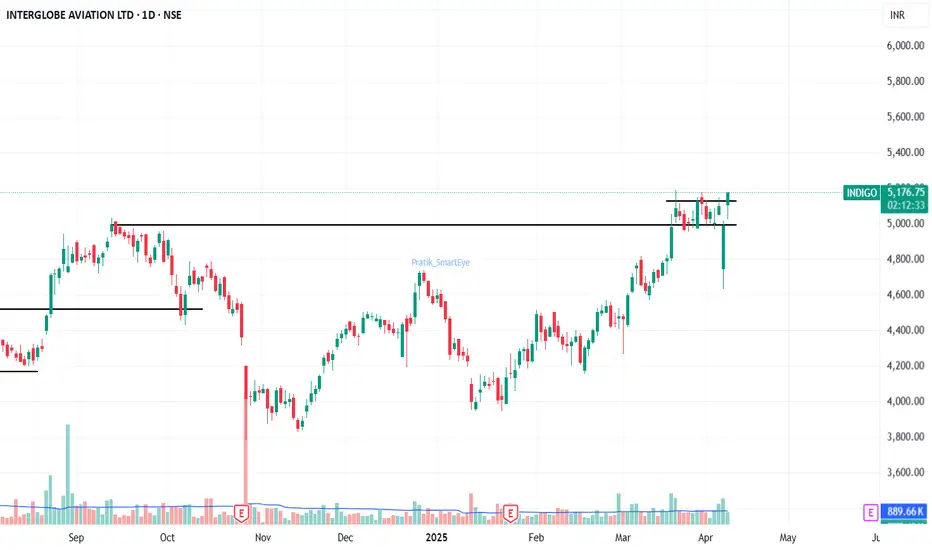
Indigo - Breakout of flag pattern. CMP 5150.Indigo - Breakout of flag pattern. CMP 5150.
After a rounding bottom breakout the stock traded in a small zone and breaking above the zone today. sustained close above the flag line can give a good up-move.
SL 5000 closing basis.
ELECTCAST : Swing Trade#ELECTCAST #ThreeWhiteSoldiers #fairvaluegap #stage1breakout #breakoutstock #Trendingstock
ELECTCAST : Swing Trade
>> Low PE Stock
>> Stage 1 Breakout & Retest done
>> TWS & FVG Visble
>> Liquidity Sweep Visible
>> Volumes Dried up
>> Stock gaining strength
Swing Traders can lock profit at 10% and keep Trailing
Please Boost, comment and follow us for more Learnings.
Note : Markets are still Tricky and can go either ways so don't be over aggressive while choosing & planning your Trades, Calculate your Position sizing as per the Risk Reward you see and most importantly don't go all in
Disc : Charts shared are for learning purpose only, not a Trade recommendation. Do your own research and consult your financial advisor before taking any position.

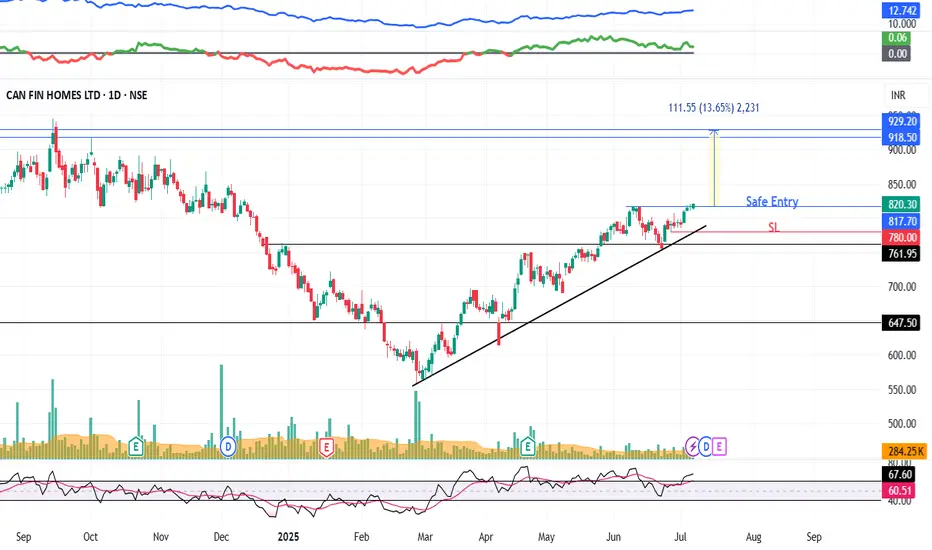
CANFINHOME : Swing Trade#CANFINHOME #swingtrade #trendingstock #swingtrading #breakoutstock
CANFINHOME : Swing Trade
>> Trending stock
>> Breakout Candidate
>> Good strength & Volumes
>> Good Risk Reward
Swing Traders can lock profit at 10% and keep Trailing
Please Boost, comment and follow us for more Learnings.
Disc : Charts shared are for learning purpose only, not a Trade recommendation. Do your own research and consult your financial advisor before taking any position.
WCIL - H&S Pattern | Breakout Above Resistance | Daily Chart📊 WCIL – Breakout Above Resistance | RSI Bullish | Strong Volume | Fibonacci Levels | Daily Chart
📅 Chart Date: June 27, 2025
📈 CMP: ₹114.43 (+3.42%)
📍 Ticker: NSE:WCIL
🔍 Technical Analysis Summary
🔺 Breakout From Trendline & Resistance
WCIL has broken out above horizontal resistance at ₹113.50 and long-term descending trendline, indicating strong bullish momentum
Golden neckline breakout of a potential inverse head & shoulder / V-recovery formation
📊 Volume Spike
Massive increase in volume (7.09M) confirms buying interest and validates the breakout
📈 RSI Indicator (14, Close)
RSI at 70.85, trending upward and entering bullish territory
Multiple Bullish RSI crossover signals provide confluence for the uptrend
🌀 Fibonacci Retracement Levels
38.2% – ₹107.94
50.0% – ₹121.13 (next key level)
61.8% – ₹134.31
100% – ₹177.00 (full retracement potential)
📍 Key Price Levels
✅ Breakout Zone: ₹113.50
🔼 Immediate Resistance: ₹121.13
🎯 Target Levels: ₹121 → ₹134 → ₹153+
🛡️ Support Levels: ₹107.9 → ₹100 → ₹91
💡 Trade Idea
Entry: Above ₹114 on confirmation with volume
SL: Below ₹107.50 (close below previous resistance)
Targets: ₹121 → ₹134 → ₹153
Risk-Reward: High conviction due to structure and volume
⚠️ Disclaimer
This chart analysis is for educational purposes only. Always DYOR (Do Your Own Research) and consult a financial advisor before making investment decisions.

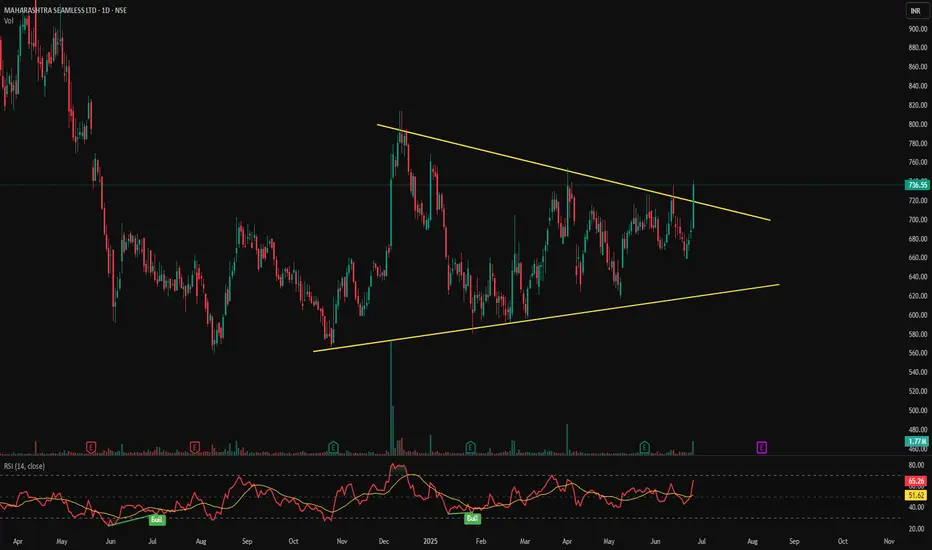
MAHSEAMLES - Symmetrical Triangle Breakout📊 MAHSEAMLES – Symmetrical Triangle Breakout | RSI Bullish | Volume Surge | Daily Timeframe
📅 Chart Date: June 26, 2025
📈 CMP: ₹736.55 (+7.20%)
📍 Ticker: NSE:MAHSEAMLES
🔍 Technical Analysis Overview
🔺 Symmetrical Triangle Breakout
After months of consolidation within a symmetrical triangle pattern, MAHSEAMLES has broken out with a strong bullish candle
Breakout level: Above ₹725, confirmed with strong price momentum
Breakout marks potential trend reversal and beginning of new bullish phase
📊 Volume
Volume spike to 1.77M, significantly higher than recent average – validates breakout strength
📈 RSI Indicator (14)
RSI at 65.26, trending upwards – bullish zone
Previous RSI Bullish signals noted at key turning points, providing confluence
📍 Key Technical Levels
✅ Breakout Level: ₹725
🚀 Potential Upside Targets (based on pattern height projection):
₹770
₹800
₹840+
🛡️ Support Zones:
₹700 (retest zone)
₹670 (lower trendline support)
₹635 (triangle base)
💡 Trade Setup Idea
Entry: On breakout close above ₹725 with confirmation
Stop Loss: Below ₹695 (just under triangle resistance)
Targets: ₹770 → ₹800 → ₹840+
Risk-Reward: Favorable with pattern breakout and rising momentum
⚠️ Disclaimer
This chart analysis is for educational purposes only. Always DYOR (Do Your Own Research) and consult a financial advisor before making investment decisions.
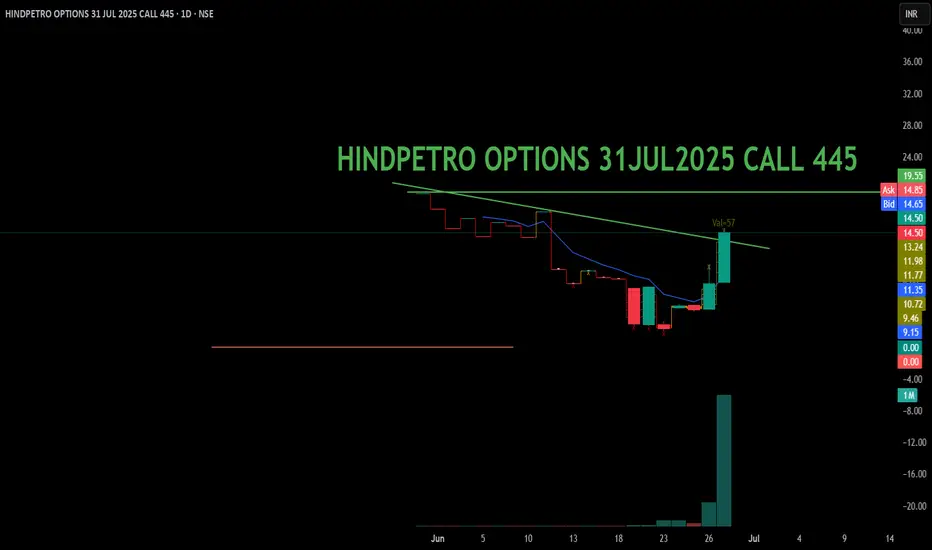
HINDPETRO OPTIONS 31JUL2025 CALL 445HINDPETRO 445 CE – 31 July 2025 Expiry 🔥
Stock showing strong momentum with good volume.
Technical setup looks bullish above key levels.
Keep on radar for potential breakout move. 📈
Disclaimer: This is not a buy recommendation. Please do your own research before taking any position.
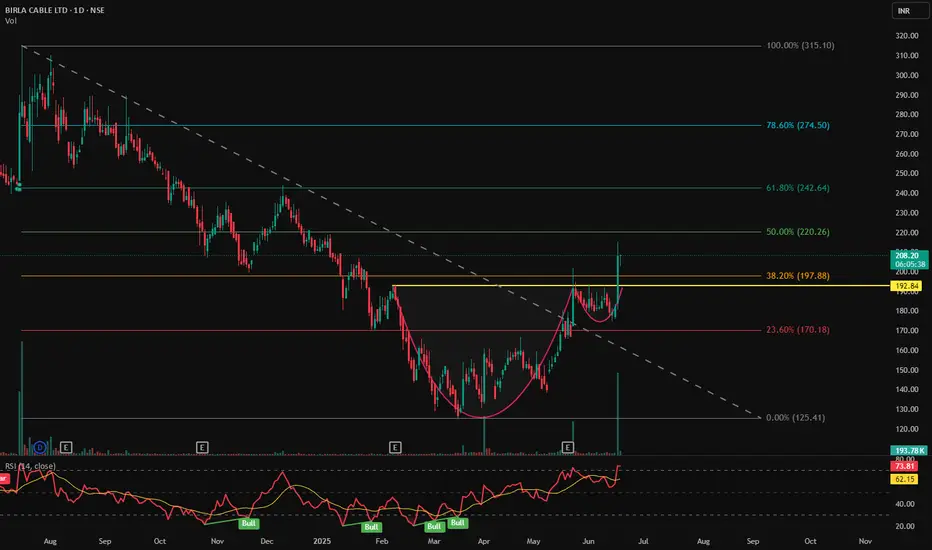
BIRLACABLE - Cup & Handle Breakout | Daily Chart📊 BIRLA CABLE LTD (BIRLACABLE) – Cup & Handle Breakout with Fibonacci Targets | RSI Overbought | Volume Spike | Daily Chart
📅 Chart Date: June 18, 2025
📈 CMP: ₹208.05 (+14.11%)
📍 Ticker: NSE:BIRLACABLE
🔍 Technical Chart Breakdown
☕ Cup & Handle Pattern Breakout
BIRLACABLE has confirmed a Cup & Handle breakout above the neckline at ₹197.88 (also 38.2% Fibonacci retracement level), suggesting bullish continuation after a long consolidation. The breakout is clean with a wide bullish candle.
📐 Fibonacci Retracement Levels (from swing high ₹315.10 to swing low ₹125.41)
38.2% (Breakout Zone): ₹197.88 ✅
50.0%: ₹220.26
61.8%: ₹242.64
78.6%: ₹274.50
Target: 100% Fibonacci: ₹315+
💹 RSI & Momentum
RSI at 73.75, entering overbought territory 🔼
Multiple RSI bullish crossovers visible during base formation
RSI suggests strong buying momentum, ideal for trend continuation
📉 Trendline Breakout
Downtrend resistance (dotted line) broken along with horizontal neckline
Aligns with volume-based breakout, confirming strength
🕯️ Volume Confirmation
Huge spike in volume (4.44M) on breakout day — highest in months
Suggests institutional or smart money activity
📍 Key Price Levels
✅ Breakout Level: ₹197.88
🚀 Fibonacci Targets:
₹220.26 → 50%
₹242.64 → 61.8%
₹274.50 → 78.6%
₹315+ → 100% (Full target)
🛡️ Support Levels:
₹197 (neckline support)
₹170.18 (23.6% Fib)
₹150 (handle base)
💡 Trading Idea
Entry: Close above ₹198 or on retest of neckline
Stop Loss: Below ₹185 or ₹170
Targets: ₹220 → ₹243 → ₹275 → ₹315
Risk-Reward: Favorable with strong confirmation
PEL : Swing Pick#PEL #trendingstock #breakoutstock #Momentumstock
PEL : Swing Trade
>> Trending setup
>> Breakout candidate
>> Stock in Momentum
>> Rounding bottom in formation
>> Low Risk High Reward Trade
Swing Traders can lock profit at 10% and keep trailing
Disc : Charts shared are for Learning purpose and not a Trade recommendation
Consult a SEBI Registered Advisor before taking position in it.
The Above Stock analysis is done purely on the technical basis only & Technical analysis is also 100% full proof. so i reserve the right to be wrong, if thats d case it will be learning experience.

SBIN : Swing Trade#SBIN #swingtrade #threewhitesoldier #trendingsetup #breakoutstock #momentumstock
SBIN : Swing Trade
>> TWS Visible
>> Trending setup
>> Cup and Handle formation
>> Breakout Candidate
>> Good Strength & Volume
>> Good Risk Reward Trade
Swing Traders can lock profit at 10% and keep trailing
Disc : Charts shared are for Learning purpose not a Trade recommendation.
Consult a SEBI Registered Advisor before taking position in it.

Syrma SGS Tech. at Buy Breakout#Syrma SGS Technology Ltd. Breakout above 570 sustained closing basis. CMP 574.
Resistance 595/685. Expected Level 765. Mid-Long Term.
View negated below 519.
#TMPV #EMS #BreakoutStock #StockInvesting #SmartEye

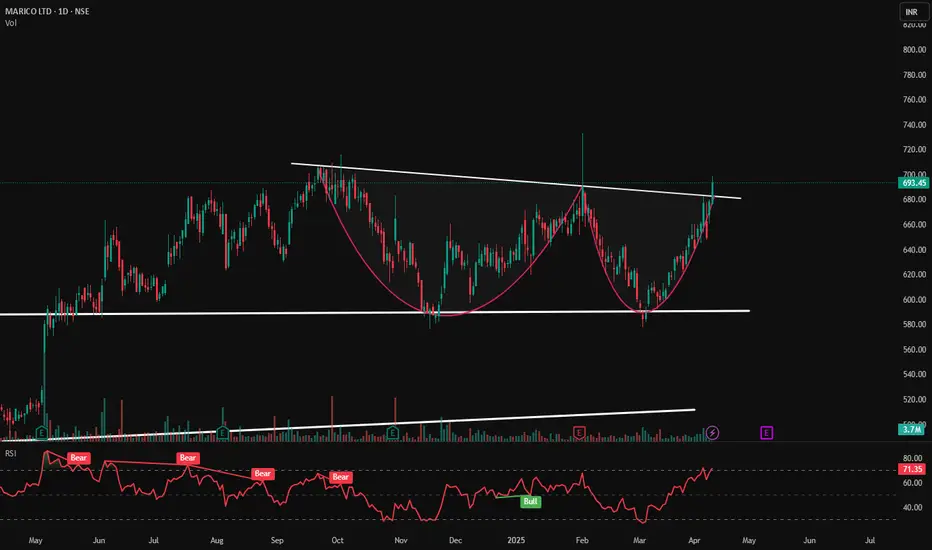
Marico Ltd- Cup & Handle Breakout Forming?Marico Ltd.—Cup & Handle Breakout Forming? ☕️📈
📆 Date: April 10, 2025
📊 Chart Analysis:
Marico is showing a classic "cup & handle" pattern, a bullish continuation setup. The price has successfully broken above the neckline resistance, indicating a potential for upward continuation if volume sustains.
📌 Key Levels:
🛑 Resistance (neckline—now flipped to support): ₹685
✅ Support (Base of Cup): ₹580
🔼 Immediate Resistance Targets: ₹710 ➡️ ₹735 ➡️ ₹765
📈 Indicators & Technicals:
☕ Cup & Handle Pattern clearly visible with a rounded bottom and breakout above resistance.
🔍 RSI at 71.35 shows bullish momentum but is slightly overbought —a sign of strength with caution.
💹 Volume steadily increasing — confirms accumulation phase and breakout intent.
🟥 Multiple "Bear" RSI icons (prior weakness) followed by a ✅ "Bull" label hinting at a momentum shift.
📉 Bearish divergence in RSI is now getting invalidated by price strength and pattern breakout.
🧠 Trade Plan:
📌 Entry near ₹685–₹695 breakout zone
🎯 Targets: ₹710 ➡️ ₹735 ➡️ ₹765
❌ SL: ₹670 (below neckline)
📌 Disclaimer: For educational purposes only. Do your own research or consult with a SEBI-registered advisor before trading or investing
Godrej Agrovet: at Base Breakout levelsGodrej Agrovet: at Base Breakout levels of 791 after a long consolidation. CMP 791.
Resistance at 820/865.
Sustained close needed.

Ujjivan Small Finance Bank-Breakout from Downtrend!Ujjivan Small Finance Bank—Breakout from Downtrend! 🔥
📆 Date: April 9, 2025
📊 Chart Analysis:
UJJIVANSFB has convincingly broken out of a long-standing falling trendline, indicating renewed bullish momentum. The breakout is supported by a strong bullish candle and above-average volume, suggesting a potential trend reversal.
📌 Key Levels:
🛑 Resistance (Breakout Zone): ₹38
✅ Support (Base Formation): ₹30.95
🔼 Immediate Resistance Levels: ₹42, ₹46, ₹50
📈 Indicators & Observations:
📉 Downtrend line broken after multiple rejections—a bullish sign.
🔍 RSI at 67.5—approaching the overbought zone but showing strong momentum.
📊 Volume surge at 32.46M suggests institutional interest and confirmation of breakout.
📌 RSI Bullish Label (Green “Bull” icon) confirms momentum strength earlier.
🧠 Strategy Ideas:
Retesting near the ₹37–₹38 zone can be a buy-on-dip opportunity.
Targets: ₹42 ➡️ ₹46 ➡️ ₹50
SL: Below ₹36 (trendline)
📌 Disclaimer: This analysis is for educational purposes only. Always do your own research or consult a SEBI-registered advisor before investing

RBL Bank Ltd- Range Breakout + Trendline Break!RBL Bank Range Breakout + Trendline Break! 💥🚀
📅 Published on: April 16, 2025
📊 Chart Insight:
RBLBANK has given a dual breakout—piercing above a long-standing descending trendline and breaking out of a rectangle consolidation zone. This combo setup indicates a potential trend reversal or continuation rally from here on.
🔍 Technical Highlights:
🔺 Pattern: Rectangle range breakout + descending trendline breakout
🟪 Consolidation Range: ₹148–₹178 (marked in purple)
📈 Breakout Candle Close: ₹181.57
📊 Volume Surge: 218.23K—strong bullish confirmation
📌 Support & Resistance Levels:
🟢 Immediate Support: ₹178 (top of the rectangle zone)
🟢 Next Strong Support: ₹164 (middle of the rectangle)
🔴 Resistance Levels to Watch:
₹188 (trendline zone retest)
₹198
₹212 (gap fill level)
📈 Trendline Analysis:
Price has broken above the major descending trendline from April 2024 highs.
This trendline had been acting as dynamic resistance and is now a potential trend shifter.
🧠 Trade Idea/Strategy:
💹 Entry: Near ₹178–₹181 (post-breakout retest ideal)
🛑 Stop-loss: Below ₹164
🎯 Targets: ₹188 ➡ ₹198 ➡ ₹212
📍 Visual Indicators Used:
✅ Rectangle drawn to capture sideways accumulation
✅ Trendline from previous highs marking resistance
✅ Volume spike indicating strong buying interest
📘 Note: Multiple timeframe confirmation is advised. Volume and structure align well with bullish bias.
🔔 Disclaimer: Educational post only. Always do your own research or consult with a SEBI-registered advisor

SHRIRAMFIN - Breakout Stock SHRIRAMFIN – Breakout Stock Analysis
🔹 Strong Momentum – The stock is showing a robust upward movement, indicating sustained buying interest and bullish sentiment.
🔹 Volume Surge – A significant increase in volume confirms strong participation, validating the breakout and signaling potential continuation of the trend.
🚨 Disclaimer: This analysis is for educational purposes only and not a recommendation to buy or sell. Please conduct your own research before making any investment decisions.

Prataap Snacks Ltd. BreakoutPrataap Snacks Ltd. Breakout closing above 1171.
CMP 1171. Expected level of 1400.
Momentum is strong, needs volume to support the move. Keep strict SL as per your risk plan.

Lupin Breakout: A New Highs Journey Begins!Hello everyone, i hope you all will be doing good in your life and your trading as well. Today i have a Lupin stock which has caught the market's attention with a powerful breakout from its resistance zone. Backed by increasing volume and bullish momentum, this pharmaceutical giant is showing signs of a potential rally. Let's dive into the chart to explore the opportunities.
1. Chart Overview
The chart appears to be for LUPIN LTD on a daily timeframe (1D).
The key focus is on price action with clearly defined support and resistance zones.
Indicators used include the RSI (Relative Strength Index) at the bottom of the chart.
The price is currently trading at ₹2,311.35, up by +3.75% for the day.
2. Key Levels Highlighted
Support Zone (Grey Band)
The support zone is marked around the ₹2,000–₹2,100 level, acting as a base where buyers consistently step in.
The price bounced off this zone multiple times, confirming its strength.
Resistance Zone (Grey Band)
The resistance zone is marked around ₹2,300–₹2,350, where sellers have historically prevented price from moving higher.
The recent breakout indicates strong bullish momentum.
Stop Loss (₹2,222)
A stop loss is suggested at ₹2,222, slightly below the resistance zone.
This is to manage risk in case the breakout fails and the price reverses.
Targets
1st Target: ₹2,490 : This is a realistic level based on previous price action and the measured move.
2nd Target: ₹2,678: This is a more optimistic target if the price continues its uptrend.
3. Price Action
Breakout: The price has broken above the resistance zone with strong bullish momentum, as seen by the large green candle and increased volume. This breakout suggests a potential continuation of the uptrend.
4. Volume Analysis
Volume Surge: There is a noticeable increase in volume during the breakout, indicating strong buying interest. Volume confirmation is a good sign that the breakout is genuine.
5. RSI Analysis
Current RSI: 71.94
The RSI is above 70, indicating an overbought condition. While this signals strong momentum, it may also suggest caution as a short-term pullback is possible.
Previous Bearish Divergences: Marked in red, showing past instances where the RSI was high but price reversed.
Bullish Confirmation: Marked in green, showing that RSI and price are aligned with the current uptrend.
6. What Does This Mean?
The breakout above resistance indicates a potential shift in market sentiment, favoring buyers.
The targets suggest significant upside potential, but the RSI warns of possible short-term profit booking.
7. Possible Outcomes
Bullish Scenario:
If the price holds above the resistance zone and sustains higher levels, it could move towards the 1st and 2nd targets.
Bearish Scenario:
If the price closes below ₹2,222 (stop loss), it may revisit the support zone around ₹2,000–₹2,100.
8. Suggested Actions
Entry: On sustained breakout above ₹2,311 (current level).
Stop Loss: Strictly at ₹2,222 to minimize losses.
Profit Booking: Gradual booking at ₹2,490 and ₹2,678.
Lupin has broken out of its resistance zone with strong momentum, signaling a potential uptrend. With solid fundamentals and technical confirmation, the stock looks poised for higher levels. Keep an eye on the targets and manage your risk with the defined stop-loss. Happy Trading!
Disclaimer:- Please always do your own analysis or consult with your financial advisor before taking any kind of trades.
Dear traders, If you like my work then do not forget to hit like and follow me, and guy's let me know what do you think about this idea in comment box, i would be love to reply all of you guy's.
Thankyou.

Near & Clean Breakout seen in Mankind Pharma Greetings to all. I trust that you are all well. Today, I would like to present a stock that has recently experienced a clear and significant breakout, and it is currently trading above the breakout levels. This stock possesses the potential to yield returns in the range of 15% to 19% in the near term, making it an excellent candidate for a positional trade. I have meticulously marked all relevant levels on the accompanying chart. This stock is characterized by its aggressive nature, indicating a high probability of achieving a 15% momentum in a very short timeframe.
Disclaimer:- It is essential to conduct your own analysis or seek advice from a financial advisor prior to engaging in any trading activities.
Dear traders, if you appreciate my contributions, kindly show your support by liking and following my work. I welcome your thoughts on this idea in the comments section and would be pleased to respond to each of you. Thank you.

Kovai Medical: at Long Consolidation BreakoutKovai Medical: at Long Consolidation Breakout with strong momentum supported with volumes from strong support zone in daily timeframe. CMP 5839.
