HLE Glascoat cmp 436.50 by Daily Chart viewHLE Glascoat cmp 436.50 by Daily Chart view
- Support Zone 406 to 433 Price Band
- Resistance Zone 467 to 494 Price Band
- Volumes in close sync with average traded quantity
- Falling Resistance Trendline Breakout seems sustained
- Darvas Box setup repeated, hope for price trend upside
Breakoutstocks

TORNTPHARM - STWP Equity SnapshotSTWP Equity Snapshot – TORNTPHARM (Educational | Chart-Based Interpretation)
📌 Intraday Reference Levels (Structure-based)
Reference Price Zone: 4,104.8
Risk Reference (Structure Invalidation): 3,828.54
Observed Upside Zones: 4,436.31 → 4,657.31
📌 Swing Reference Levels (Hybrid Model | 2–5 days | Observational)
Reference Price Zone: 4,104.8
Risk Reference (Structural Breakdown): 3,607.54
Higher Range Projection (If trend sustains): 5,099.32 → 5,845.21
Key Levels Daily TF
Support: 3983 | 3875 | 3815
Resistance: 4152 | 4213 | 4321
🔍 STWP Market Read
Torrent Pharmaceuticals Ltd is displaying strong momentum continuation within an established uptrend, supported by a clean ascending structure and recent price expansion. The breakout candle reflects decisive participation, with volume expanding sharply above recent averages — indicating institutional involvement rather than speculative noise.
Momentum indicators are stretched, with RSI near 80.95, highlighting short-term euphoria and overextension risk. Trend strength remains intact as price continues to hold above prior consolidation zones, but at elevated levels, risk management and patience become more important than anticipation.
📊 Chart Structure & Indicator Summary
Structure: Ascending channel with higher highs and higher lows
Trend: Developing upward bias
Momentum: Strong, impulsive phase
RSI: Overbought — momentum-driven, not mean-reversion yet
MACD & ADX: Trend strength confirmation
Volume: High conviction participation, breakout-backed
📈 Final Outlook (Condition-Based)
Momentum: Strong
Trend: Up
Risk: High (overbought / euphoric zone)
Volume: High, conviction-led
💡 STWP Learning Note
Strong trends do not require prediction — they demand structure awareness, controlled risk, and disciplined review. Momentum rewards patience, not urgency.
⚠️ Disclaimer:
This is an educational market interpretation based on chart structure and publicly available data. It is not a recommendation, advice, or solicitation. Equity markets involve risk. Please consult a SEBI-registered financial advisor before taking any investment or trading decision.
📘 STWP Approach:
Observe momentum. Respect risk. Let structure guide decisions.
💬 Did this add value?
🔼 Boost to support structured learning
✍️ Share your views or questions in the comments
🔁 Forward to traders who value disciplined analysis
👉 Follow for clean, probability-driven STWP insights
🚀 Stay Calm. Stay Clean. Trade With Patience.
Trade Smart | Learn Zones | Be Self-Reliant 📊

Breakout and Retest | 1000 + Soon Breakout reistance level of 950 which is now retest level of of this stock .Retest is now going good and stock is ready for four digit move and more after the new high .

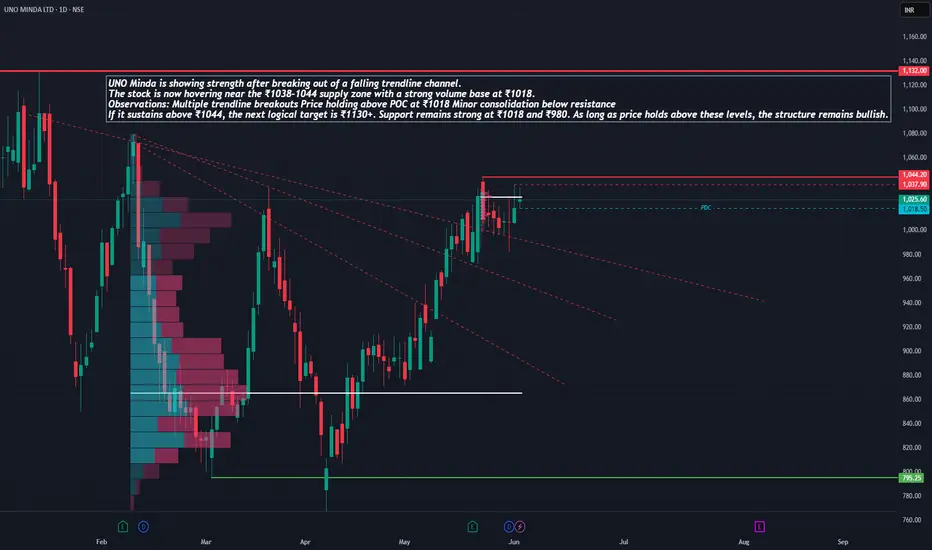
UNO MINDA – Ready to Revisit All-Time Highs?UNO Minda is showing strength after breaking out of a falling trendline channel. The stock is now hovering near the ₹1038–1044 supply zone with a strong volume base at ₹1018.
Observations:
Multiple trendline breakouts
Price holding above POC at ₹1018
Minor consolidation below resistance
If it sustains above ₹1044, the next logical target is ₹1130+. Support remains strong at ₹1018 and ₹980. As long as price holds above these levels, the structure remains bullish.
Like, comment your thoughts, and share this post
Explore more stock ideas on the right hand side your feedback means a lot to me!
Disclaimer: This post is for educational purposes only and should not be considered a buy/sell recommendation.
BUY TODAY SELL TOMORROW for 5%DON’T HAVE TIME TO MANAGE YOUR TRADES?
- Take BTST trades at 3:25 pm every day
- Try to exit by taking 4-7% profit of each trade
- SL can also be maintained as closing below the low of the breakout candle
Now, why do I prefer BTST over swing trades? The primary reason is that I have observed that 90% of the stocks give most of the movement in just 1-2 days and the rest of the time they either consolidate or fall
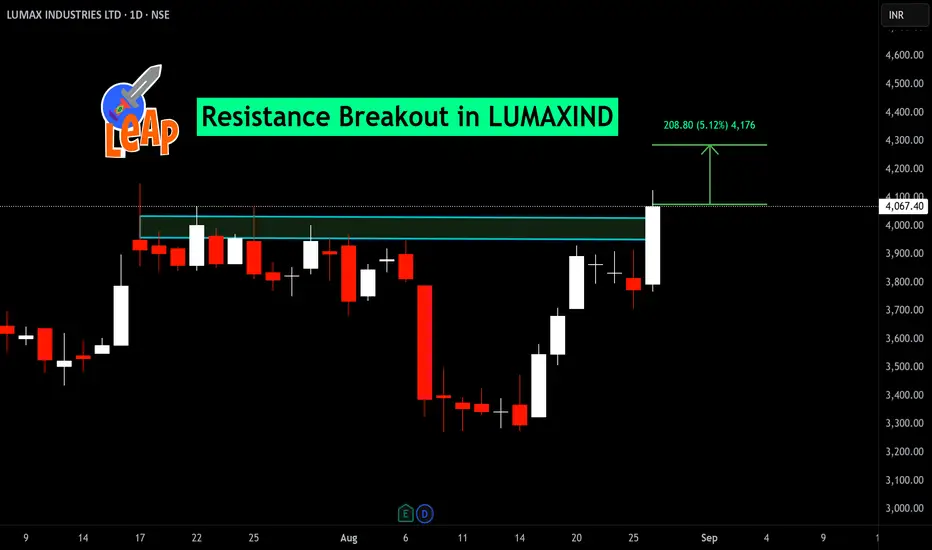
Resistance Breakout in SMCGLOBAL
BUY TODAY SELL TOMORROW for 5%

DRAGONFLY INCDRAGONFLY INC, as per chart view it formed FALLING WEDGE PATTERN and made breakout with entry level $6.88 with EMA crossover. We can expect the Final target to $13.

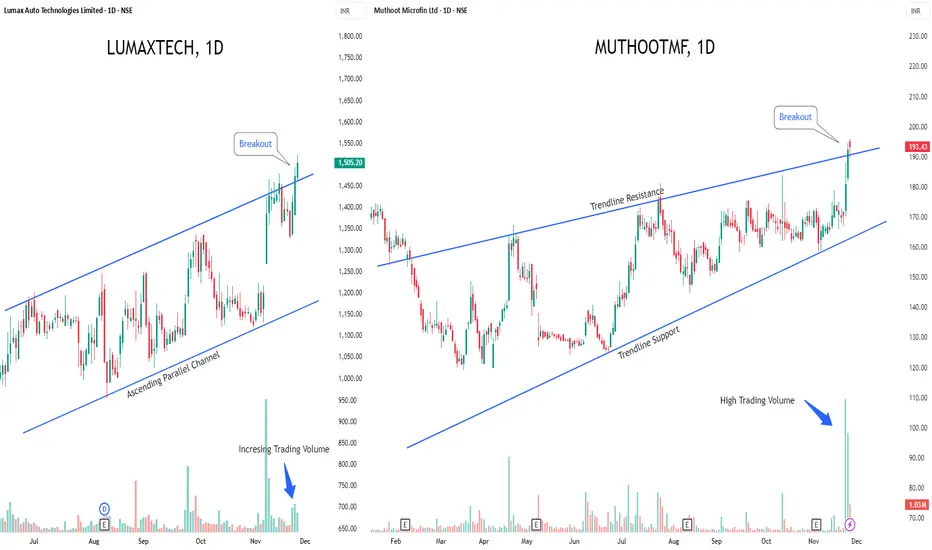
LUMAXTECH & MUTHOOTMF - Breakout Stocks to Watch This Week!1️⃣ Lumax Auto Technologies NSE:LUMAXTECH — Fresh Breakout Alert
Lumax is riding a strong uptrend and has cleanly broken above the upper boundary of its ascending parallel channel.
If this breakout sustains, the stock could see a sharp upside rally ahead.
Rising volumes are confirming strong buyer interest, giving this move an extra edge.
2️⃣ Muthoot Microfin NSE:MUTHOOTMF — Failed Rising Wedge, Strong Reversal Setup
A failed rising wedge pattern is playing out as the price has broken above the trendline resistance, flipping the structure into a bullish signal.
Even better — heavy volume buildup is reinforcing the strength of this emerging reversal.
⚡Both counters show early signs of momentum — watch for follow-through!
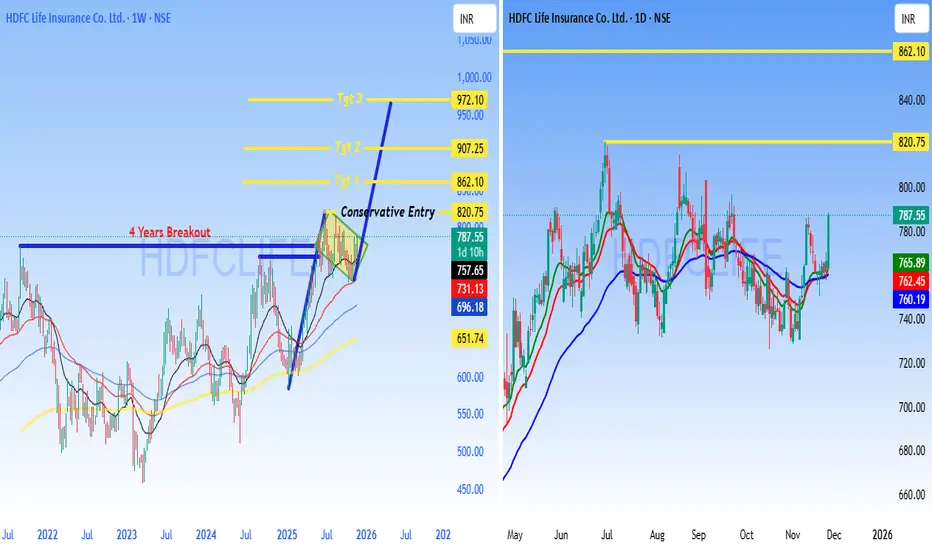
HDFCLIFE - BUY - Technical AnalysisHDFC Life Insurance - 4-Year Breakout Setup
HDFCLIFE (NSE) Current Price: 787.55
Date: November 27, 2025
Key Highlight: 4-YEAR BREAKOUT CONFIRMED
HDFC Life has broken out from a **4-year consolidation zone** around 787, signaling a major technical development with significant upside potential.
Technical Setup
4-Year Resistance Breakout - Stock cleared multi-year hurdle
Strong Volume Confirmation - Breakout supported by buying interest
Higher Highs Pattern - Bullish structure on daily chart
Moving Averages Aligned - Trending above key EMAs
Price Targets
Target 1: 862.10
Target 2: 907.25
Target 3: 972.10
Conservative Entry: 820.75 (post-retest confirmation)
Trading Plan
Entry Zone: 787-820
Stop Loss: Below 757 (breakout invalidation)
Risk:Reward: 1:3+ favorable setup
Strategy: Long-term breakout traders can accumulate; conservative traders wait for pullback to ₹820 zone.
- 4-year resistance breakouts often lead to sustained rallies
- Insurance sector showing strength
- Strong institutional interest in HDFC Life
- Technical + fundamental alignment
Risk Management
- Use stop loss below 757
- Position size: Risk only 1-2% capital
- Trail stop loss as targets are achieved
- Monitor broader market conditions
DISCLAIMER
**NOT investment advice. For educational purposes only.** I am NOT a SEBI registered analyst. This is technical analysis based on chart patterns. Trading involves substantial risk. Do your own research (DYOR). Consult a financial advisor before investing. Trade at your own risk.
**#HDFCLIFE #Breakout #StockMarket #NSE #TechnicalAnalysis #Insurance #Trading #IndianStocks #ChartAnalysis #SwingTrading #BreakoutTrading #TradingView #StockAlert #BullishSetup #PriceAction**
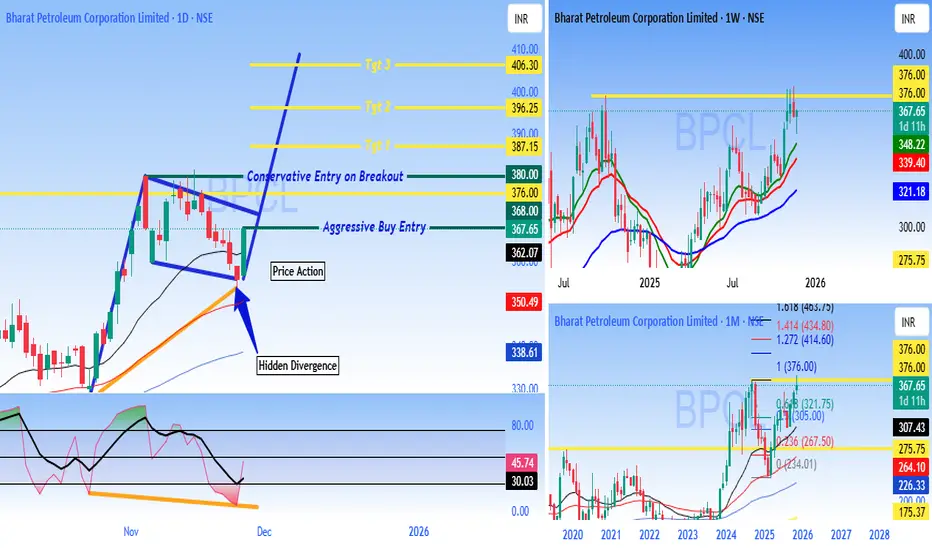
BPCL - Buy - ATH breakout - Technical Analysis#Bharat Petroleum Corporation Limited (BPCL) - #Technical Analysis Report
Current Price: 356.80 (Daily)
Multi-Timeframe Technical Analysis:
BPCL is displaying strong bullish momentum across multiple timeframes with a compelling technical setup featuring **Hidden Divergence** and a clear breakout structure on the daily chart.
Daily Chart Analysis - Key Technical Patterns:
1. Hidden Divergence Confirmed
- Classic Trend continuation signal indicating the uptrend is likely to resume with strength
2. Breakout Structure
- Stock has broken out from a consolidation zone around ₹362
- Currently trading above key resistance turned support
3. Trade Entry:
Aggressive Buy Entry:
As #Priceaction has formed already for traders who want immediate entry Buy will be active above 367.65
Conservative Entry on Breakout:
Initiate trades on candle close above 380
Price Targets
Target 1: 387.15
Target 2: 396.25
Target 3: 406.30
These targets are based on Fibonacci extensions and resistance zones from the pattern structure.
Weekly & Monthly Chart Context
Weekly Chart Shows:
- Strong uptrend since 2024 lows
- Stock trading near multi-year highs around 367-370 zone
- Higher highs and higher lows pattern intact
- Moving averages well-aligned in bullish configuration
Monthly Chart Indicates:
- Long-term recovery from 2020-2023 correction phase
- Breaking out from multi-year resistance zone
- Potential for extended rally toward ₹376-400 zone
Momentum Indicators
- Hidden divergence on daily timeframe = Bullish continuation
- Price action showing strength above key moving averages
- Volume expansion on breakout candles (positive sign)
- RSI/Momentum indicators supporting the upward move
The combination of bullish patterns and momentum indicators suggests potential for continuation toward higher targets. Traders should maintain strict risk management and adjust positions based on price action at key levels.
DISCLAIMER
This analysis is for educational and informational purposes only and should NOT be considered as investment advice or a recommendation to buy, sell, or hold any securities - I am NOT a SEBI registered analyst or investment advisor - This is purely a technical analysis based on chart patterns, indicators, and price action - Past performance and technical patterns do not guarantee future results - Trading and investing in stocks involves substantial risk of loss and may not be suitable for all investors - Always conduct your own research, due diligence, and analysis before making any investment decisions - Consult with a qualified financial advisor before taking any investment positions - The author/analyst holds no responsibility for any profits or losses incurred based on this analysis - Risk management is crucial - never invest more than you can afford to lose - Stop losses are mandatory for capital protection - Markets can remain irrational longer than you can remain solvent
Trade/Invest at your own risk. DYOR (Do Your Own Research).
#BPCL #TechnicalAnalysis #StockMarket #NSE #IndianStocks #Trading #HiddenDivergence #Breakout #OilAndGas #PSU #ChartAnalysis #TradingView #SwingTrading #DayTrading #PriceAction #StockTrading #MarketAnalysis #OMC #EnergyStocks #BullishSetup
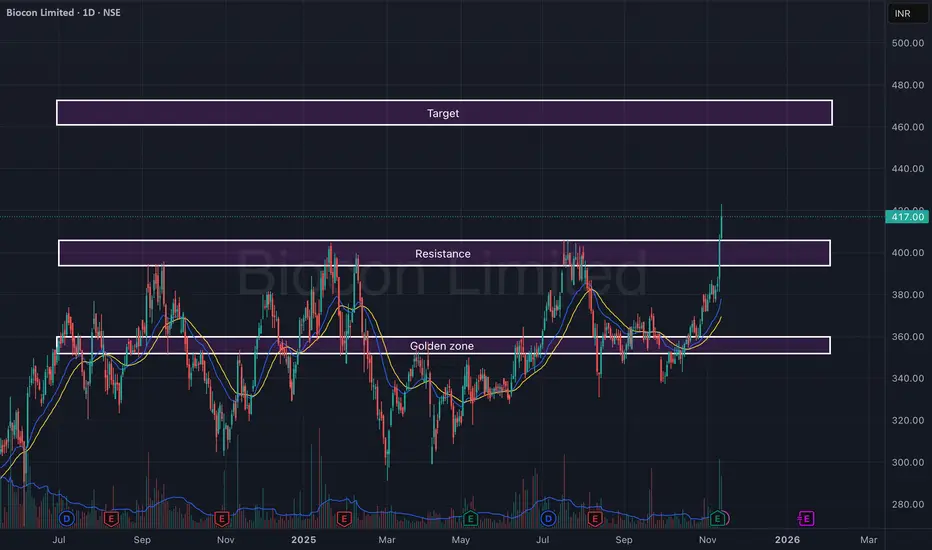
Biocon Ltd – Breakout from Resistance with Strong Volume SurgeBiocon has delivered a powerful breakout above its key resistance zone of ₹395–₹405, backed by a sharp volume expansion and strong follow-through candles. After months of consolidation within the golden zone (₹355–₹370), the stock has finally regained momentum, suggesting a potential trend reversal.
The structure now favors continuation toward the upper target zone, with EMAs aligning positively and momentum indicators supporting strength.
🎯 Key Levels:
CMP: ₹417.00 (+2.73%)
Golden Zone (Base Support): ₹355 – ₹370
Resistance (Now Support): ₹395 – ₹405
Target Zone: ₹460 – ₹475
Stop-Loss: ₹385 (on daily close basis)
📊 Technical View:
Resistance breakout with strong bullish candle and high volume.
EMA crossover (20 > 50) confirms short-term bullish trend.
Sustaining above ₹405 may lead to a momentum rally toward ₹460+.
Golden zone remains a reliable base for any pullback opportunities.
🧠 View:
Biocon has confirmed a breakout after a prolonged consolidation phase. Sustained momentum above ₹405 could lead to a steady move toward ₹470 levels in the short to medium term.
Sharing my Secret Trading Mindset with Price actionIn this 18 minute video I will try to change the way you trade by sharing my trading experience using charts older than 3 months .

Privi Speciality Chemicals Ltd – Weekly Breakout SetupPrivi has shown a clean breakout from a long consolidation zone, backed by steady volume expansion. After months of range-bound action, the stock finally broke above ₹2,600 and is now sustaining well above its breakout zone — indicating the start of a new upward leg.
Price action shows strong bullish candles supported by the 10- and 20-week EMAs, signaling trend confirmation.
🎯 Key Levels:
CMP: ₹2,903 (+2.55%)
Breakout Zone: ₹2,500 – ₹2,600
Target Zone: ₹3,150 – ₹3,250
Stop-Loss: ₹2,700 (weekly close basis)
📊 Technical View:
Weekly breakout from multi-month consolidation box.
Volume confirmation supports sustained momentum.
Price trading above both EMAs, confirming bullish trend continuation.
Minor resistance near ₹2,950; sustained move above can accelerate momentum.
🧠 View:
Privi Speciality Chemicals has completed a strong breakout after a long accumulation phase. Sustaining above ₹2,900 can push the stock towards ₹3,200 levels in the coming weeks.

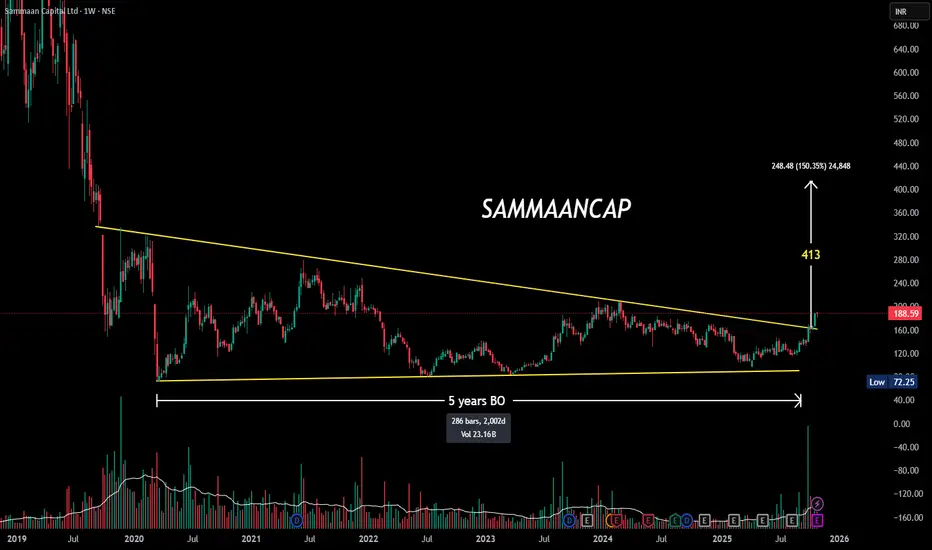
SAMMAANCAP | 5-Year Symmetrical Triangle Breakout at ₹165!📈 #SAMMAANCAP | #TechnicalAnalysis
💥 5-Year Symmetrical Triangle Breakout at ₹165!
After a long consolidation, price breaks out with rising volume — a strong sign of trend reversal despite current negative earnings.
🔹 Pattern: Symmetrical Triangle
🔹 Breakout Zone: ₹165
🔹 CMP: ₹188
🔹 P/E: -5.9 (Loss-making)
🔹 P/BV: 0.7
🔹 Sector: Finance
⚙️ Sustaining above ₹165 could open room toward ₹220–₹240 over the medium term.
#PriceAction #BreakoutStocks #TradingView #ChartPatterns #SwingTrading #StockMarketIndia #TechnicalAnalysis #VolumeBreakout
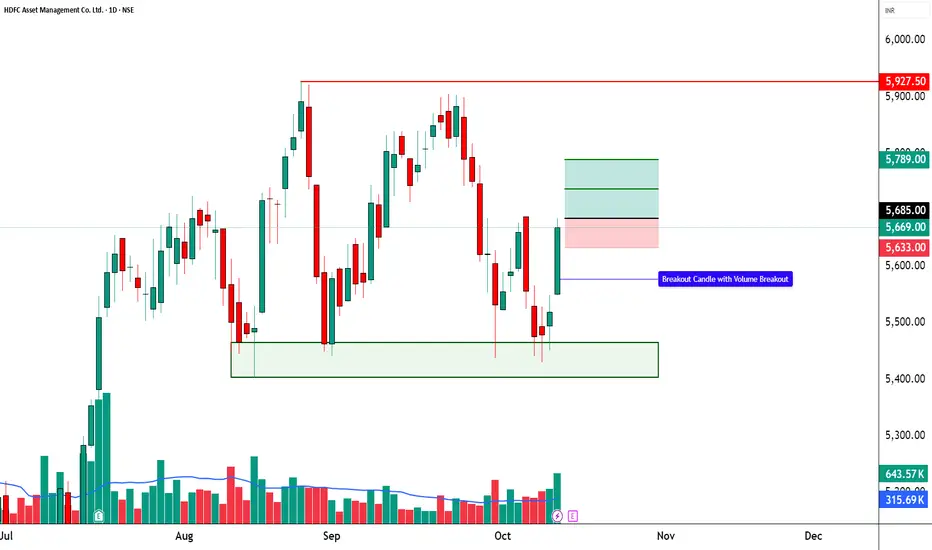
HDFC AMC LTD | Bullish Momentum + Possible Breakout📈 HDFC AMC LTD | Bullish Momentum + Possible Breakout 🚀
🔹 Bullish Breakout Zone: 5,660 – 5,685
🔹 Stop Loss: 5,633 (Risk ~₹52)
🔹 Supports: 5,584 / 5,499 / 5,448
🔹 Resistances: 5,719 / 5,770 / 5,855
🔑 Key Highlights
HDFC AMC has formed a strong bullish candle with a notable volume surge, clearly confirming aggressive buying interest. The RSI breakout signals a shift in momentum after a prolonged consolidation phase, indicating that the stock is gaining renewed strength. Additionally, a Bollinger Band Squeeze-Off pattern is visible, suggesting a potential volatility expansion and a short-term breakout on the upside. The spike in trading volume further reinforces the bullish sentiment, hinting at possible institutional participation behind this move.
🎯 STWP Trade View
📊 Price has reclaimed control above near-term resistances with improving momentum.
A sustained close above ₹5,719 can trigger a move toward ₹5,770–₹5,855 levels in the short term.
Pullbacks toward ₹5,640–₹5,660 may offer favorable entry zones with tight risk control.
⚠️ Supports at ₹5,584 and ₹5,499 remain crucial for maintaining the swing structure and protecting positions.
________________________________________
📊 Final Outlook
Momentum: 🔥 Strong
Trend: 📉 Bearish (but reversing)
Risk: 🟢 Low
Volume: 📈 High
________________________________________
💡 Learning Note
This setup demonstrates the power of confluence — RSI breakout + BB squeeze + volume surge.
Such multi-signal alignments often mark the start of a momentum phase, offering early entry opportunities before a confirmed breakout rally.
________________________________________
________________________________________
⚠️ Disclosure & Disclaimer – Please Read Carefully
The information shared here is meant purely for learning and awareness. It is not a buy or sell recommendation and should not be taken as investment advice. I am not a SEBI-registered investment adviser, and all views expressed are based on personal study, chart patterns, and publicly available market data.
Trading—whether in stocks or options—carries risk. Markets can move unexpectedly, and losses can sometimes exceed the money you have invested. Past performance or past setups do not guarantee future results.
If you are a beginner, treat this as a guide to understand how the market works and practice on paper trades before risking real money. If you are experienced, always assess your own risk, position sizing, and strategy suitability before entering trades.
Consult a SEBI-registered financial adviser before making any real trading decision. By engaging with this content, you acknowledge full responsibility for your trades and investments.
Position Status: No active position in HDFCAMC at the time of analysis.
Data Source: TradingView & NSE India (Past Chart Reference) (Historical levels)
💬 Found this useful?
🔼 Give this post a Boost to help more traders discover clean, structured learning.
✍️ Drop your thoughts, questions, or setups in the comments — let’s grow together!
🔁 Share with fellow traders and beginners to spread awareness.
👉 “If you liked this breakdown, follow for more clean, structured setups with discipline at the core.”
🚀 Stay Calm. Stay Clean. Trade With Patience.
Trade Smart | Learn Zones | Be Self-Reliant 📊
BUY TODAY SELL TOMORROW for 5%DON’T HAVE TIME TO MANAGE YOUR TRADES?
- Take BTST trades at 3:25 pm every day
- Try to exit by taking 4-7% profit of each trade
- SL can also be maintained as closing below the low of the breakout candle
Now, why do I prefer BTST over swing trades? The primary reason is that I have observed that 90% of the stocks give most of the movement in just 1-2 days and the rest of the time they either consolidate or fall
Resistance Breakout in LUMAXIND
BUY TODAY SELL TOMORROW for 5%
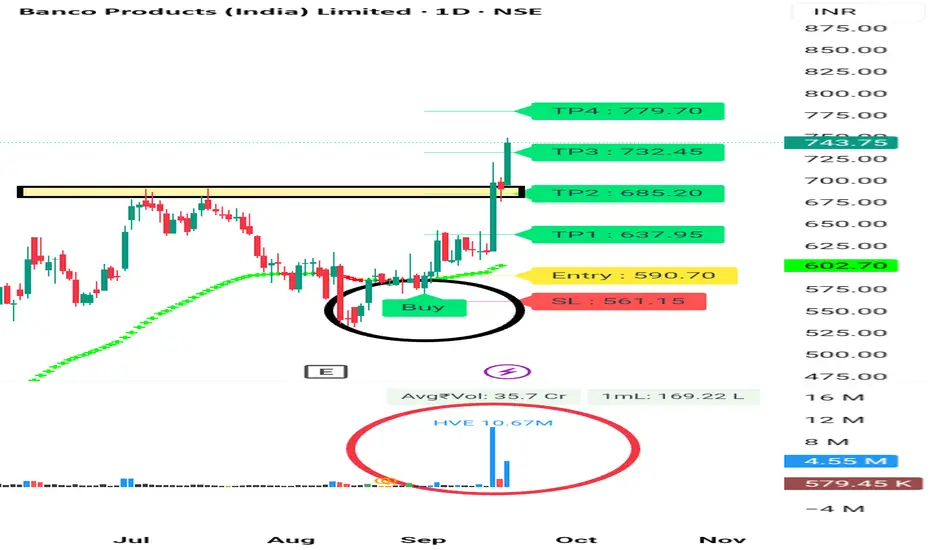
Breakout Stock For Swing Trading Banco india is a very good stock in his secret. It's given breakout with high volume.
It's looking good for Swing trading tgt 5 -8%
SL 5% . then Trail SL.
It's given good breakout.
You can Visit my Tradingview Profile for more information.
Consult your financial advisor before making any position in stock market.
Zota Healthcare Higher High Pattern Zota healthcare moving Up in a pattern . It's bullish Since many Months. You can Study Chart of last 2 Year. It's moving up in Pattern with Retracement. So it's very good.
You can make 5 -10% Easily in this Stocks. Keep SL 5%
It may be in Consolidation before moving up as u see same happened in last some days.
But it may move up with volume.
Visit my Tradingview Profile for more information.
Consult your financial advisor before making any position in stock market.

Bata India Weekly: Long-Term ₹1,000 Support Holds FirmThis weekly chart of Bata India Ltd. (NSE: BATAINDIA) sharply illustrates the critical long-term support level near ₹1,000, originally established during the Covid-19 crash of early 2020. The chart highlights a multi-year retest of this zone in 2025, reinforcing its importance as a key demand area. Notably, the recent volume surge at this support emphasizes a strong buying interest, suggesting accumulation and potential trend reversal.
The clear defense of this support, combined with price action holding above, points to a significant upside breakout opportunity above ₹1,250. Traders should watch for confirmation of a sustained reversal to capitalize on the favorable risk-to-reward scenario, with stop-losses logically placed just below this well-tested support.
This chart stands out by combining historical context, volume analysis, and precise annotations for a comprehensive technical setup. It’s a textbook example of supply-demand dynamics, providing actionable insights for swing traders and investors aiming for tactical entries on quality stocks.

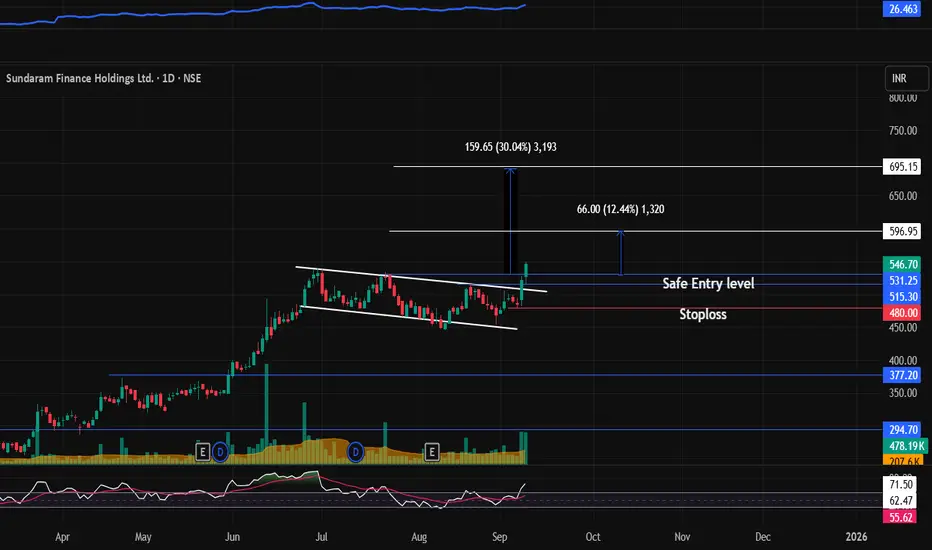
SUNDARMHLD : Breakout stock (Swing pick)#SUNDARMHLD #flagbreakout #breakoutstock #channelbreakout #swingtrading #momentumtrading
SUNDARMHLD : Swing / Short term (1-3 months)
>> Flag Breakout or Channel Breakout
>> Good Strength in stock
>> Volumes picking up
>> Low PE Stock
>> Swing Traders can Look for 10-12% Levels & Short term traders can go for Higher Levels
>> Enter at Retracement
Swing Traders can lock profit at 10% and keep Trailing
Please Boost, comment and follow us for more Learnings
Disc : Charts shared are for learning purpose only, not a Trade recommendation. Do your own research and consult your financial advisor before taking any position.
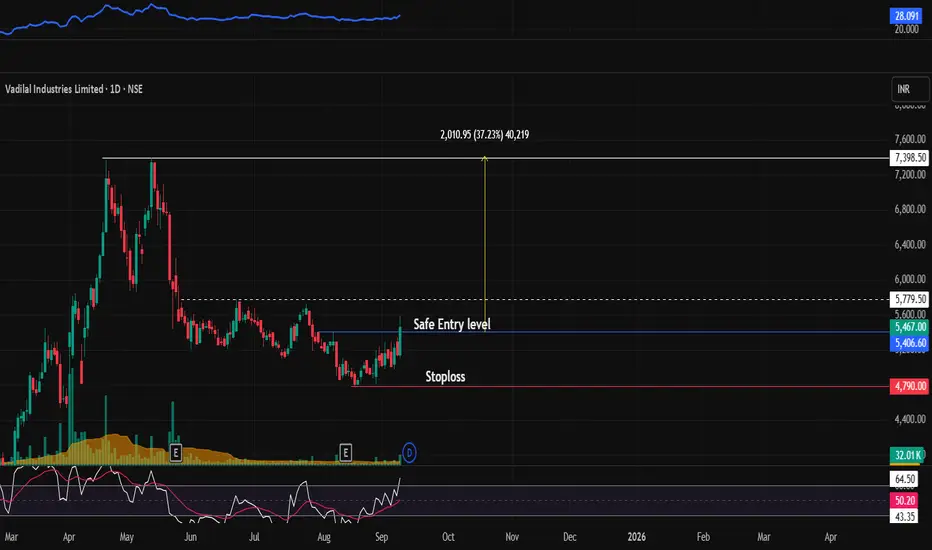
VADILALIND : Breakout Stock (Swing - Short Term)#VADILALIND #breakoutstock #Trendingstock
VADILALIND : Swing / Short term (1-3 months)
>> Strong Breakout candle
>> Good Strength in Stock
>> Volumes Picking up
>> Good upside potential
>> Low Risk High Reward
Swing Traders can lock profit at 10% and keep Trailing
Please Boost, comment and follow us for more Learnings.
Disc : Charts shared are for learning purpose only, not a Trade recommendation. Do your own research and consult your financial advisor before taking any position.
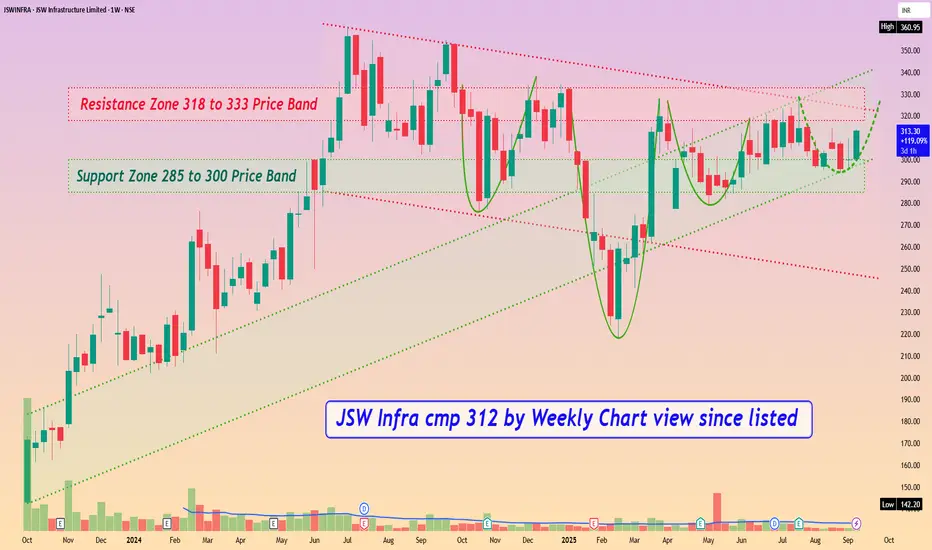
JSW Infra cmp 312 by Weekly Chart view since listedJSW Infra cmp 312 by Weekly Chart view since listed
- Support Zone 285 to 300 Price Band
- Resistance Zone 318 to 333 Price Band
- Bullish Rounding Bottoms repeated under the Resistance Zone neckline
- Stock making Higher High Lower High pattern within up-trending price channel momentum
- Stock traversing within Rising Support + Price Channel and attempting Falling Resistance + Price Channel Breakout
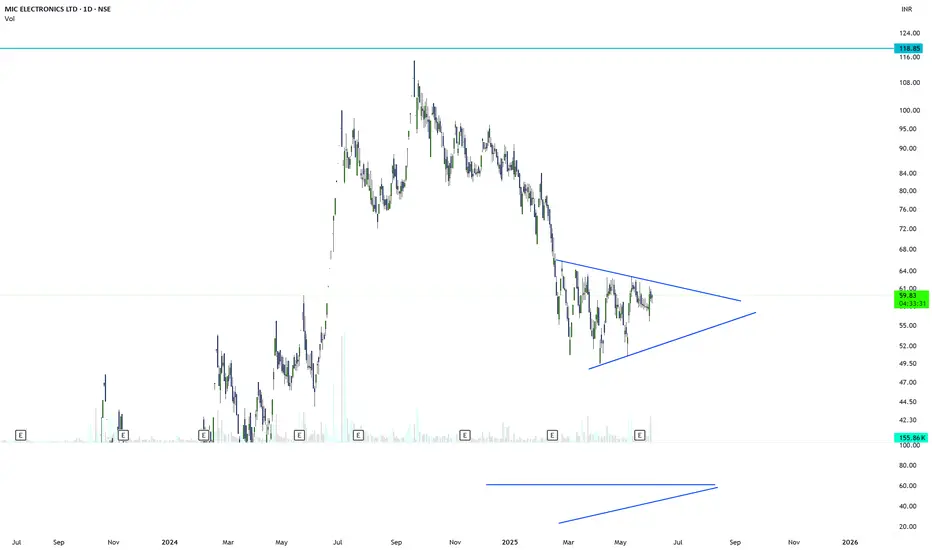
MICEL : another move in makingMICEL looks good on chart and RSI on Daily time frame is convincing a breakout candidate. Keep an eye on it and enter with a nominal Stoploss. Expecting 20% move soon.
NOTE : I'm not a SEBI REG. Study charts before investing.
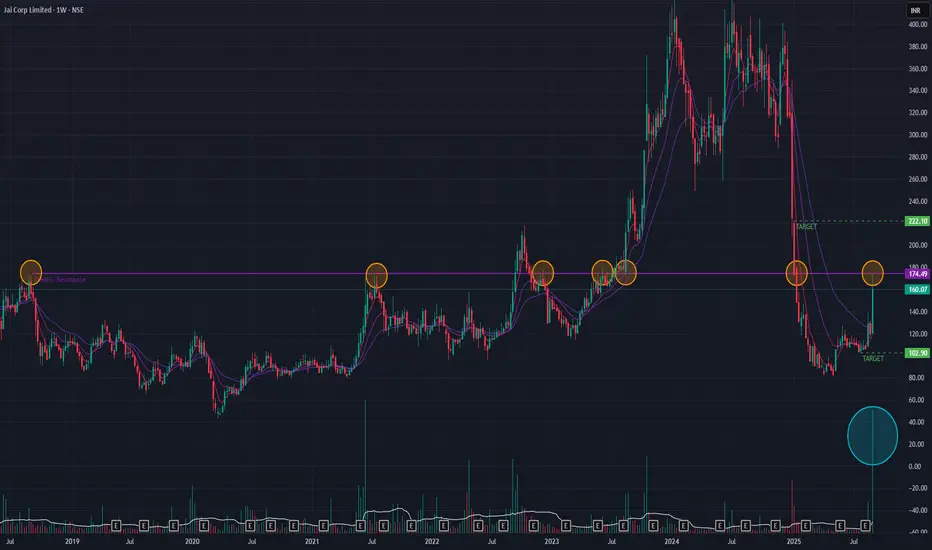
Jai Corp (Weekly Timeframe) - Is Jai on a bullish reversal?Overall the stock is in a sideways trend since 2009. The stock have been trying to Breakout of a major resistance but only succeeded once. Last week's stock spike accompanied with volume spike if sustained next week then it might be able to BreakOut of the resistance. The short-term EMAs are also in a Positive Cross-over state.
If the stock BreaksOut, then the upside target may be in the range of 222. If the stock is unable to BreakOut then on the downside we may expect it to go down to 102 range.
Keep monitoring the price-action during next week!!