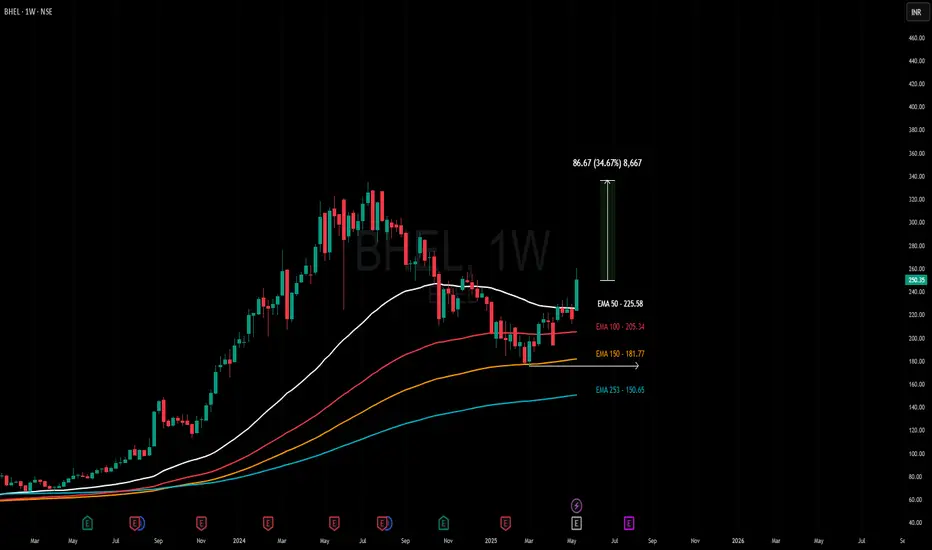
Amazing breakout on WEEKLY Timeframe - BHELCheck this stock which has made an all time low and high chances that it makes a "V" shaped recovery.
> Taking support at last years support or breakout level
> High chances that it reverses from this point.
> Volume dried up badly in last few months / days.
> Very high suspicion based analysis and not based on chart patterns / candle patterns deeply.
> VALUABLE STOCK AVAILABLE AT A DISCOUNTED PRICE
> OPPURTUNITY TO ACCUMULATE ADEQUATE QUANTITY
> MARKET AFTER A CORRECTION / PANIC FALL TO MAKE GOOD INVESTMENT
DISCLAIMER : This is just for educational purpose. This type of analysis is equivalent to catching a falling knife. If you are a warrior, you throw all the knives back else you will be sorrow if it hits SL. Make sure to do your analysis well. This type of analysis only suits high risks investor and whose is willing to throw all the knives above irrespective of any sectoral rotation. BE VERY CAUTIOUS AS IT IS EXTREME BOTTOM FISHING.
HOWEVER, THIS IS HOW MULTIBAGGERS ARE CAUGHT !
STOCK IS AT RIGHT PE / RIGHT EVALUATION / MORE ROAD TO GROW / CORRECTED IV / EXCELLENT BOOKS / USING MARKET CRASH AS AN OPPURTUNITY / EPS AT SKY.
LET'S PUMP IN SOME MONEY AND REVOLUTIONIZE THE NATION'S ECONOMY!
Breakouttrading
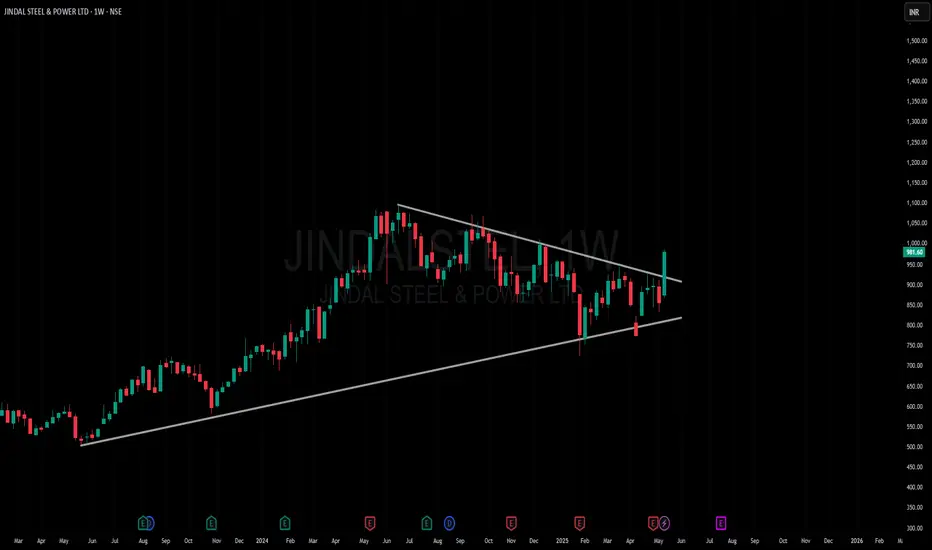
Amazing breakout on WEEKLY Timeframe - JINDALSTELCheckout an amazing breakout happened in the stock in Weekly timeframe, macroscopically seen in Daily timeframe. Having a great favor that the stock might be bullish expecting a staggering returns of minimum 25% TGT. IMPORTANT BREAKOUT LEVELS ARE ALWAYS RESPECTED!
NOTE for learners: Place the breakout levels as per the chart shared and track it yourself to get amazed!!
#No complicated chart patterns
#No big big indicators
#No Excel sheet or number magics
TRADE IDEA: WAIT FOR THE STOCK TO BREAKOUT IN WEEKLY TIMEFRAME ABOVE THIS LEVEL.
Checkout an amazing breakout happened in the stock in Weekly timeframe.
Breakouts happening in longer timeframe is way more powerful than the breakouts seen in Daily timeframe. You can blindly invest once the weekly candle closes above the breakout line and stay invested forever. Also these stocks breakouts are lifelong predictions, it means technically these breakouts happen giving more returns in the longer runs. Hence, even when the scrip makes a loss of 10% / 20% / 30% / 50%, the stock will regain and turn around. Once they again enter the same breakout level, they will flyyyyyyyyyyyy like a ROCKET if held in the portfolio in the longer run.
Time makes money, GREEDY & EGO will not make money.
Also, magically these breakouts tend to prove that the companies turn around and fundamentally becoming strong. Also the magic happens when more diversification is done in various sectors under various scripts with equal money invested in each N500 scripts.
The real deal is when to purchase and where to purchase the stock. That is where Breakout study comes into play.
Check this stock which has made an all time low and high chances that it makes a "V" shaped recovery.
> Taking support at last years support or breakout level
> High chances that it reverses from this point.
> Volume dried up badly in last few months / days.
> Very high suspicion based analysis and not based on chart patterns / candle patterns deeply.
> VALUABLE STOCK AVAILABLE AT A DISCOUNTED PRICE
> OPPURTUNITY TO ACCUMULATE ADEQUATE QUANTITY
> MARKET AFTER A CORRECTION / PANIC FALL TO MAKE GOOD INVESTMENT
DISCLAIMER : This is just for educational purpose. This type of analysis is equivalent to catching a falling knife. If you are a warrior, you throw all the knives back else you will be sorrow if it hits SL. Make sure to do your analysis well. This type of analysis only suits high risks investor and whose is willing to throw all the knives above irrespective of any sectoral rotation. BE VERY CAUTIOUS AS IT IS EXTREME BOTTOM FISHING.
HOWEVER, THIS IS HOW MULTIBAGGERS ARE CAUGHT !
STOCK IS AT RIGHT PE / RIGHT EVALUATION / MORE ROAD TO GROW / CORRECTED IV / EXCELLENT BOOKS / USING MARKET CRASH AS AN OPPURTUNITY / EPS AT SKY.
LET'S PUMP IN SOME MONEY AND REVOLUTIONIZE THE NATION'S ECONOMY!
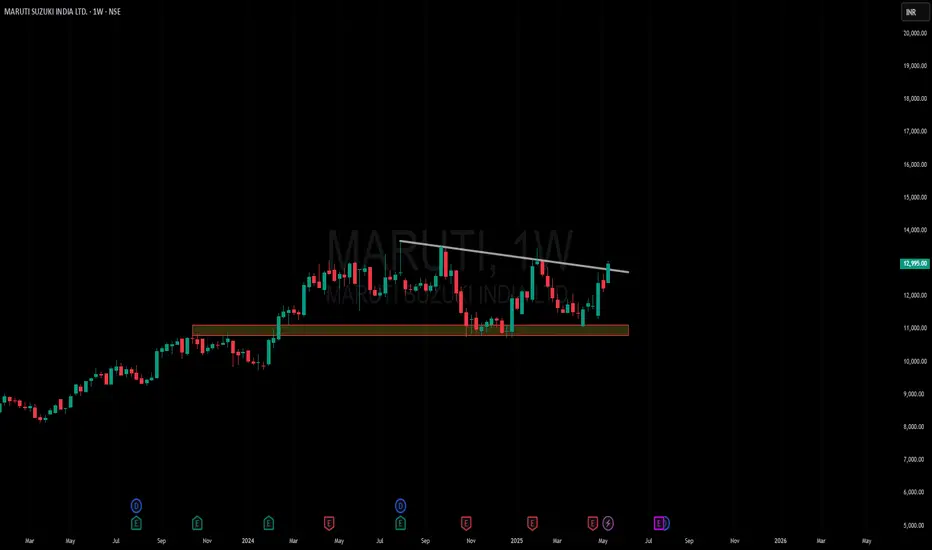
Amazing breakout on WEEKLY Timeframe - MARUTICheckout an amazing breakout happened in the stock in Weekly timeframe, macroscopically seen in Daily timeframe. Having a great favor that the stock might be bullish expecting a staggering returns of minimum 25% TGT. IMPORTANT BREAKOUT LEVELS ARE ALWAYS RESPECTED!
NOTE for learners: Place the breakout levels as per the chart shared and track it yourself to get amazed!!
#No complicated chart patterns
#No big big indicators
#No Excel sheet or number magics
TRADE IDEA: WAIT FOR THE STOCK TO BREAKOUT IN WEEKLY TIMEFRAME ABOVE THIS LEVEL.
Checkout an amazing breakout happened in the stock in Weekly timeframe.
Breakouts happening in longer timeframe is way more powerful than the breakouts seen in Daily timeframe. You can blindly invest once the weekly candle closes above the breakout line and stay invested forever. Also these stocks breakouts are lifelong predictions, it means technically these breakouts happen giving more returns in the longer runs. Hence, even when the scrip makes a loss of 10% / 20% / 30% / 50%, the stock will regain and turn around. Once they again enter the same breakout level, they will flyyyyyyyyyyyy like a ROCKET if held in the portfolio in the longer run.
Time makes money, GREEDY & EGO will not make money.
Also, magically these breakouts tend to prove that the companies turn around and fundamentally becoming strong. Also the magic happens when more diversification is done in various sectors under various scripts with equal money invested in each N500 scripts.
The real deal is when to purchase and where to purchase the stock. That is where Breakout study comes into play.
Check this stock which has made an all time low and high chances that it makes a "V" shaped recovery.
> Taking support at last years support or breakout level
> High chances that it reverses from this point.
> Volume dried up badly in last few months / days.
> Very high suspicion based analysis and not based on chart patterns / candle patterns deeply.
> VALUABLE STOCK AVAILABLE AT A DISCOUNTED PRICE
> OPPURTUNITY TO ACCUMULATE ADEQUATE QUANTITY
> MARKET AFTER A CORRECTION / PANIC FALL TO MAKE GOOD INVESTMENT
DISCLAIMER : This is just for educational purpose. This type of analysis is equivalent to catching a falling knife. If you are a warrior, you throw all the knives back else you will be sorrow if it hits SL. Make sure to do your analysis well. This type of analysis only suits high risks investor and whose is willing to throw all the knives above irrespective of any sectoral rotation. BE VERY CAUTIOUS AS IT IS EXTREME BOTTOM FISHING.
HOWEVER, THIS IS HOW MULTIBAGGERS ARE CAUGHT !
STOCK IS AT RIGHT PE / RIGHT EVALUATION / MORE ROAD TO GROW / CORRECTED IV / EXCELLENT BOOKS / USING MARKET CRASH AS AN OPPURTUNITY / EPS AT SKY.
LET'S PUMP IN SOME MONEY AND REVOLUTIONIZE THE NATION'S ECONOMY!
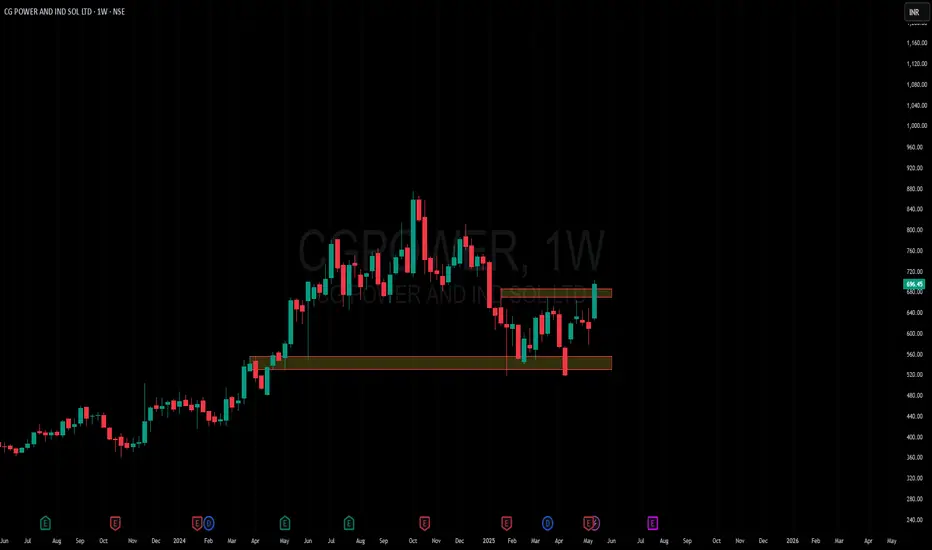
Amazing breakout on WEEKLY Timeframe - CGPOWERCheckout an amazing breakout happened in the stock in Weekly timeframe, macroscopically seen in Daily timeframe. Having a great favor that the stock might be bullish expecting a staggering returns of minimum 25% TGT. IMPORTANT BREAKOUT LEVELS ARE ALWAYS RESPECTED!
NOTE for learners: Place the breakout levels as per the chart shared and track it yourself to get amazed!!
#No complicated chart patterns
#No big big indicators
#No Excel sheet or number magics
TRADE IDEA: WAIT FOR THE STOCK TO BREAKOUT IN WEEKLY TIMEFRAME ABOVE THIS LEVEL.
Checkout an amazing breakout happened in the stock in Weekly timeframe.
Breakouts happening in longer timeframe is way more powerful than the breakouts seen in Daily timeframe. You can blindly invest once the weekly candle closes above the breakout line and stay invested forever. Also these stocks breakouts are lifelong predictions, it means technically these breakouts happen giving more returns in the longer runs. Hence, even when the scrip makes a loss of 10% / 20% / 30% / 50%, the stock will regain and turn around. Once they again enter the same breakout level, they will flyyyyyyyyyyyy like a ROCKET if held in the portfolio in the longer run.
Time makes money, GREEDY & EGO will not make money.
Also, magically these breakouts tend to prove that the companies turn around and fundamentally becoming strong. Also the magic happens when more diversification is done in various sectors under various scripts with equal money invested in each N500 scripts.
The real deal is when to purchase and where to purchase the stock. That is where Breakout study comes into play.
Check this stock which has made an all time low and high chances that it makes a "V" shaped recovery.
> Taking support at last years support or breakout level
> High chances that it reverses from this point.
> Volume dried up badly in last few months / days.
> Very high suspicion based analysis and not based on chart patterns / candle patterns deeply.
> VALUABLE STOCK AVAILABLE AT A DISCOUNTED PRICE
> OPPURTUNITY TO ACCUMULATE ADEQUATE QUANTITY
> MARKET AFTER A CORRECTION / PANIC FALL TO MAKE GOOD INVESTMENT
DISCLAIMER : This is just for educational purpose. This type of analysis is equivalent to catching a falling knife. If you are a warrior, you throw all the knives back else you will be sorrow if it hits SL. Make sure to do your analysis well. This type of analysis only suits high risks investor and whose is willing to throw all the knives above irrespective of any sectoral rotation. BE VERY CAUTIOUS AS IT IS EXTREME BOTTOM FISHING.
HOWEVER, THIS IS HOW MULTIBAGGERS ARE CAUGHT !
STOCK IS AT RIGHT PE / RIGHT EVALUATION / MORE ROAD TO GROW / CORRECTED IV / EXCELLENT BOOKS / USING MARKET CRASH AS AN OPPURTUNITY / EPS AT SKY.
LET'S PUMP IN SOME MONEY AND REVOLUTIONIZE THE NATION'S ECONOMY!
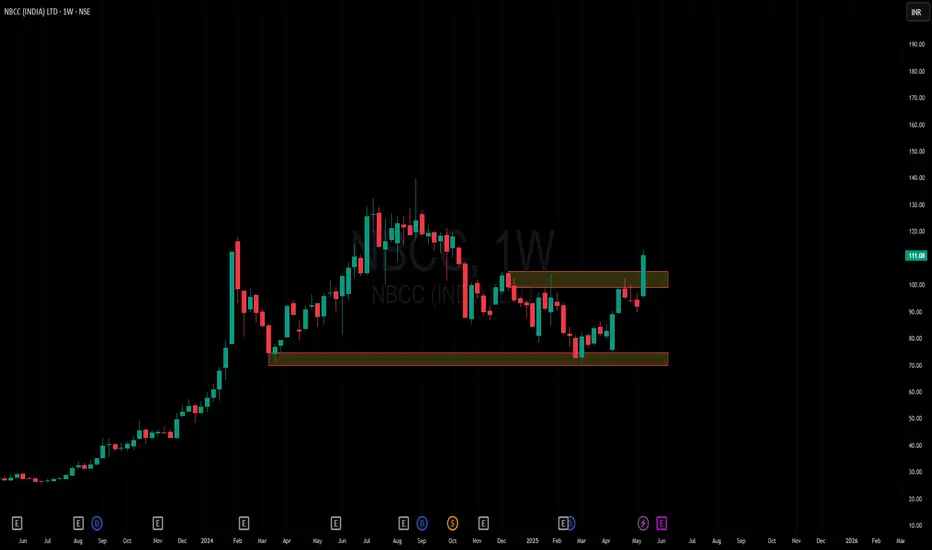
Amazing breakout on WEEKLY Timeframe - NBCCCheckout an amazing breakout happened in the stock in Weekly timeframe, macroscopically seen in Daily timeframe. Having a great favor that the stock might be bullish expecting a staggering returns of minimum 25% TGT. IMPORTANT BREAKOUT LEVELS ARE ALWAYS RESPECTED!
NOTE for learners: Place the breakout levels as per the chart shared and track it yourself to get amazed!!
#No complicated chart patterns
#No big big indicators
#No Excel sheet or number magics
TRADE IDEA: WAIT FOR THE STOCK TO BREAKOUT IN WEEKLY TIMEFRAME ABOVE THIS LEVEL.
Checkout an amazing breakout happened in the stock in Weekly timeframe.
Breakouts happening in longer timeframe is way more powerful than the breakouts seen in Daily timeframe. You can blindly invest once the weekly candle closes above the breakout line and stay invested forever. Also these stocks breakouts are lifelong predictions, it means technically these breakouts happen giving more returns in the longer runs. Hence, even when the scrip makes a loss of 10% / 20% / 30% / 50%, the stock will regain and turn around. Once they again enter the same breakout level, they will flyyyyyyyyyyyy like a ROCKET if held in the portfolio in the longer run.
Time makes money, GREEDY & EGO will not make money.
Also, magically these breakouts tend to prove that the companies turn around and fundamentally becoming strong. Also the magic happens when more diversification is done in various sectors under various scripts with equal money invested in each N500 scripts.
The real deal is when to purchase and where to purchase the stock. That is where Breakout study comes into play.
Check this stock which has made an all time low and high chances that it makes a "V" shaped recovery.
> Taking support at last years support or breakout level
> High chances that it reverses from this point.
> Volume dried up badly in last few months / days.
> Very high suspicion based analysis and not based on chart patterns / candle patterns deeply.
> VALUABLE STOCK AVAILABLE AT A DISCOUNTED PRICE
> OPPURTUNITY TO ACCUMULATE ADEQUATE QUANTITY
> MARKET AFTER A CORRECTION / PANIC FALL TO MAKE GOOD INVESTMENT
DISCLAIMER : This is just for educational purpose. This type of analysis is equivalent to catching a falling knife. If you are a warrior, you throw all the knives back else you will be sorrow if it hits SL. Make sure to do your analysis well. This type of analysis only suits high risks investor and whose is willing to throw all the knives above irrespective of any sectoral rotation. BE VERY CAUTIOUS AS IT IS EXTREME BOTTOM FISHING.
HOWEVER, THIS IS HOW MULTIBAGGERS ARE CAUGHT !
STOCK IS AT RIGHT PE / RIGHT EVALUATION / MORE ROAD TO GROW / CORRECTED IV / EXCELLENT BOOKS / USING MARKET CRASH AS AN OPPURTUNITY / EPS AT SKY.
LET'S PUMP IN SOME MONEY AND REVOLUTIONIZE THE NATION'S ECONOMY!
Amazing breakout on WEEKLY Timeframe - CUBCheckout an amazing breakout happened in the stock in Weekly timeframe, macroscopically seen in Daily timeframe. Having a great favor that the stock might be bullish expecting a staggering returns of minimum 25% TGT. IMPORTANT BREAKOUT LEVELS ARE ALWAYS RESPECTED!
NOTE for learners: Place the breakout levels as per the chart shared and track it yourself to get amazed!!
#No complicated chart patterns
#No big big indicators
#No Excel sheet or number magics
TRADE IDEA: WAIT FOR THE STOCK TO BREAKOUT IN WEEKLY TIMEFRAME ABOVE THIS LEVEL.
Checkout an amazing breakout happened in the stock in Weekly timeframe.
Breakouts happening in longer timeframe is way more powerful than the breakouts seen in Daily timeframe. You can blindly invest once the weekly candle closes above the breakout line and stay invested forever. Also these stocks breakouts are lifelong predictions, it means technically these breakouts happen giving more returns in the longer runs. Hence, even when the scrip makes a loss of 10% / 20% / 30% / 50%, the stock will regain and turn around. Once they again enter the same breakout level, they will flyyyyyyyyyyyy like a ROCKET if held in the portfolio in the longer run.
Time makes money, GREEDY & EGO will not make money.
Also, magically these breakouts tend to prove that the companies turn around and fundamentally becoming strong. Also the magic happens when more diversification is done in various sectors under various scripts with equal money invested in each N500 scripts.
The real deal is when to purchase and where to purchase the stock. That is where Breakout study comes into play.
Check this stock which has made an all time low and high chances that it makes a "V" shaped recovery.
> Taking support at last years support or breakout level
> High chances that it reverses from this point.
> Volume dried up badly in last few months / days.
> Very high suspicion based analysis and not based on chart patterns / candle patterns deeply.
> VALUABLE STOCK AVAILABLE AT A DISCOUNTED PRICE
> OPPURTUNITY TO ACCUMULATE ADEQUATE QUANTITY
> MARKET AFTER A CORRECTION / PANIC FALL TO MAKE GOOD INVESTMENT
DISCLAIMER : This is just for educational purpose. This type of analysis is equivalent to catching a falling knife. If you are a warrior, you throw all the knives back else you will be sorrow if it hits SL. Make sure to do your analysis well. This type of analysis only suits high risks investor and whose is willing to throw all the knives above irrespective of any sectoral rotation. BE VERY CAUTIOUS AS IT IS EXTREME BOTTOM FISHING.
HOWEVER, THIS IS HOW MULTIBAGGERS ARE CAUGHT !
STOCK IS AT RIGHT PE / RIGHT EVALUATION / MORE ROAD TO GROW / CORRECTED IV / EXCELLENT BOOKS / USING MARKET CRASH AS AN OPPURTUNITY / EPS AT SKY.
LET'S PUMP IN SOME MONEY AND REVOLUTIONIZE THE NATION'S ECONOMY!

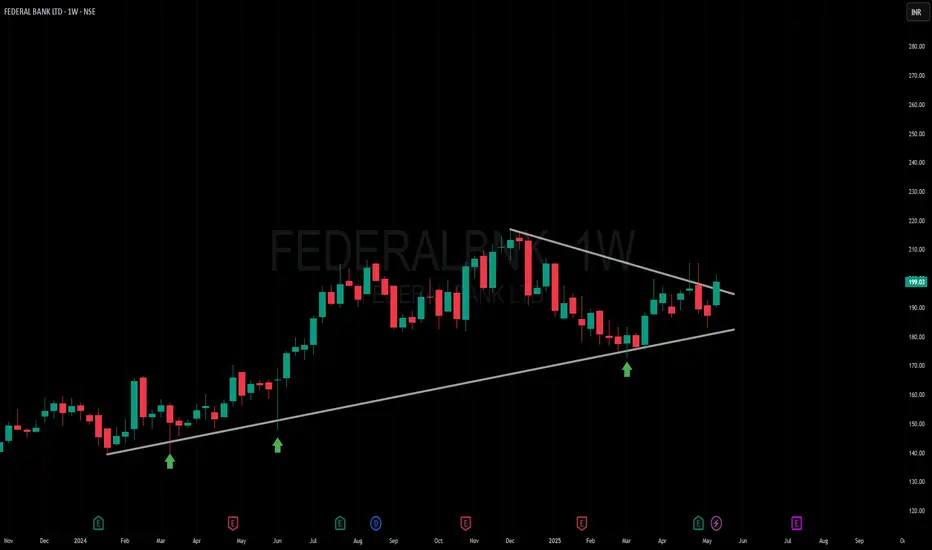
Amazing breakout on WEEKLY Timeframe - FEDERALBNKCheckout an amazing breakout happened in the stock in Weekly timeframe, macroscopically seen in Daily timeframe. Having a great favor that the stock might be bullish expecting a staggering returns of minimum 25% TGT. IMPORTANT BREAKOUT LEVELS ARE ALWAYS RESPECTED!
NOTE for learners: Place the breakout levels as per the chart shared and track it yourself to get amazed!!
#No complicated chart patterns
#No big big indicators
#No Excel sheet or number magics
TRADE IDEA: WAIT FOR THE STOCK TO BREAKOUT IN WEEKLY TIMEFRAME ABOVE THIS LEVEL.
Checkout an amazing breakout happened in the stock in Weekly timeframe.
Breakouts happening in longer timeframe is way more powerful than the breakouts seen in Daily timeframe. You can blindly invest once the weekly candle closes above the breakout line and stay invested forever. Also these stocks breakouts are lifelong predictions, it means technically these breakouts happen giving more returns in the longer runs. Hence, even when the scrip makes a loss of 10% / 20% / 30% / 50%, the stock will regain and turn around. Once they again enter the same breakout level, they will flyyyyyyyyyyyy like a ROCKET if held in the portfolio in the longer run.
Time makes money, GREEDY & EGO will not make money.
Also, magically these breakouts tend to prove that the companies turn around and fundamentally becoming strong. Also the magic happens when more diversification is done in various sectors under various scripts with equal money invested in each N500 scripts.
The real deal is when to purchase and where to purchase the stock. That is where Breakout study comes into play.
Check this stock which has made an all time low and high chances that it makes a "V" shaped recovery.
> Taking support at last years support or breakout level
> High chances that it reverses from this point.
> Volume dried up badly in last few months / days.
> Very high suspicion based analysis and not based on chart patterns / candle patterns deeply.
> VALUABLE STOCK AVAILABLE AT A DISCOUNTED PRICE
> OPPURTUNITY TO ACCUMULATE ADEQUATE QUANTITY
> MARKET AFTER A CORRECTION / PANIC FALL TO MAKE GOOD INVESTMENT
DISCLAIMER : This is just for educational purpose. This type of analysis is equivalent to catching a falling knife. If you are a warrior, you throw all the knives back else you will be sorrow if it hits SL. Make sure to do your analysis well. This type of analysis only suits high risks investor and whose is willing to throw all the knives above irrespective of any sectoral rotation. BE VERY CAUTIOUS AS IT IS EXTREME BOTTOM FISHING.
HOWEVER, THIS IS HOW MULTIBAGGERS ARE CAUGHT !
STOCK IS AT RIGHT PE / RIGHT EVALUATION / MORE ROAD TO GROW / CORRECTED IV / EXCELLENT BOOKS / USING MARKET CRASH AS AN OPPURTUNITY / EPS AT SKY.
LET'S PUMP IN SOME MONEY AND REVOLUTIONIZE THE NATION'S ECONOMY!
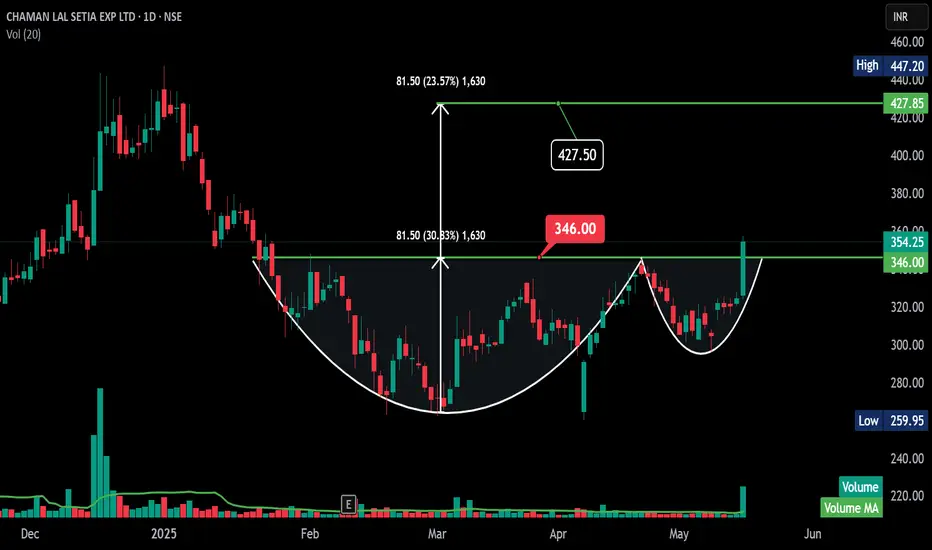
CLSEL -Daily - Cup and Handle -Breakout -Good Volume CHAMAN LAL SETIA EXP LTD daily chart definitely presents a compelling case for a **cup and handle breakout**.
Here's what aligns with your observation:
* **Clear Cup and Handle:** The chart shows a well-formed rounded bottom (the cup) followed by a smaller, slightly downward-sloping consolidation (the handle).
* **Neckline Breakout:** Today's price action (May 17, 2025) shows a strong bullish candle that has decisively broken above the neckline you've identified at ₹346.00.
* **Good Volume:** Importantly, the volume bar for today is significantly higher than the recent average volume, indicating strong buying pressure accompanying the breakout. This adds significant credence to the validity of the breakout.
* **Target:** Your target of ₹427.50 aligns well with the typical measurement for a cup and handle pattern. The depth of the cup (roughly from the low around ₹265 to the neckline at ₹346, which is ₹81) added to the breakout level (₹346) gives a target of ₹427.
**In summary, this looks like a textbook cup and handle breakout for CHAMAN LAL SETIA EXP LTD, supported by good volume, increasing the likelihood of the price reaching your target of ₹427.50.**
It's always wise to consider potential resistance levels along the way and to have a stop-loss in place, but the initial signs here are quite bullish.
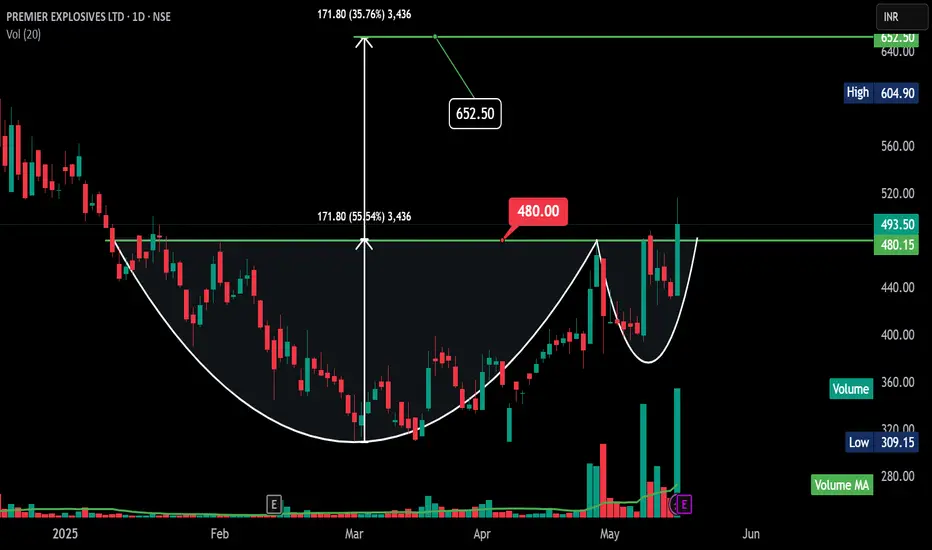
PREMEXPLN - Daily Chart - Cup and Handle PREMIER EXPLOSIVES LTD (PREMEXPLN) daily chart.
**cup and handle** pattern, suggesting potential bullish continuation.
Here's a simple breakdown:
* **Cup:** The rounded bottom formation appears to have taken place between roughly early January and late April 2025. This indicates a period of consolidation after a decline.
* **Handle (Potential):** After reaching a high around ₹480, the price has pulled back and is now showing signs of consolidating again in a smaller range (the potential handle) in early May 2025.
* **Breakout Level:** The horizontal line you've drawn around ₹480 acts as the potential neckline or resistance. A decisive break above this level would provide further confirmation of the pattern.
* **Target:** You've marked a potential target around ₹652.50. This target is typically estimated by measuring the depth of the cup and adding it to the breakout level.
**Things to watch out for:**
* **Handle Formation:** Observe if the current consolidation indeed forms a handle—a smaller, ideally slightly downward-sloping or sideways movement.
* **Breakout :** We need to see if it retests 480 and bounce it is a strong buy.
* **Volume on Breakout:** Increased volume on the breakout it is strength to the bullish signal.
BSE Ltd - Breakout Setup, Move is ON...#BSE trading above Resistance of 4169
Next Resistance is at 6645
Support is at 2586
Here is previous chart:
Chart is self explanatory. Levels of breakout, possible up-moves (where stock may find resistances) and support (close below which, setup will be invalidated) are clearly defined.
Disclaimer: This is for demonstration and educational purpose only. This is not buying or selling recommendations. I am not SEBI registered. Please consult your financial advisor before taking any trade.

Mazagon Dock Shipbuilders - Breakout Setup, Move is ON...#MAZDOCK trading above Resistance of 4315
Next Resistance is at 6033
Support is at 2955
Here are previous charts:
Chart is self explanatory. Levels of breakout, possible up-moves (where stock may find resistances) and support (close below which, setup will be invalidated) are clearly defined.
Disclaimer: This is for demonstration and educational purpose only. This is not buying or selling recommendations. I am not SEBI registered. Please consult your financial advisor before taking any trade.

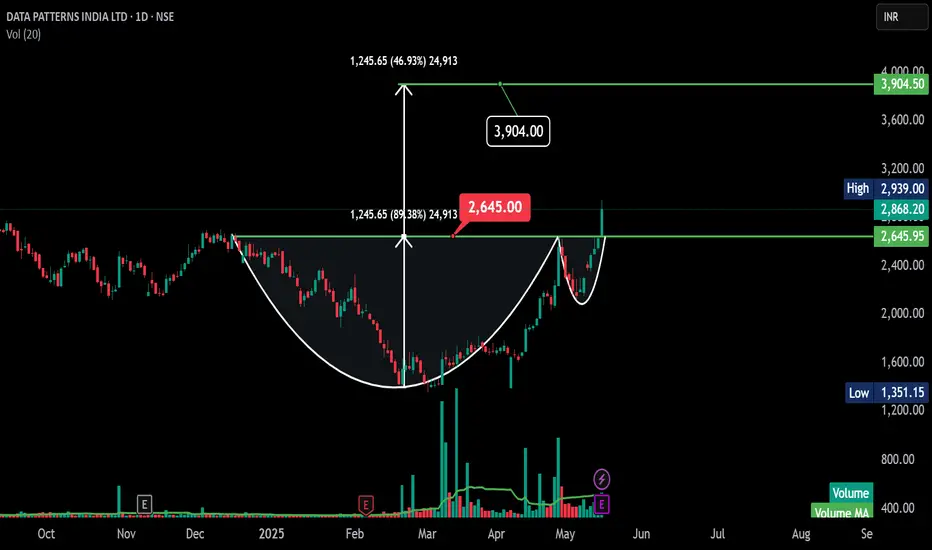
DATAPATTNS - Daily - Breakout -CnHDATA PATTERNS INDIA LTD daily chart.
The most prominent feature here is a well-defined **cup and handle** pattern, which is typically a bullish continuation signal.
Here's a simple breakdown:
* **Cup:** A rounded bottom formation that occurred roughly between early November 2024 and late April 2025. This suggests a period of price consolidation before a potential upward move.
* **Handle:** After reaching a high around ₹2,845.50, the price has pulled back and is consolidating in a smaller, slightly downward-sloping pattern (the handle) between late April and mid-May 2025.
* **Breakout Level:** The horizontal line around ₹2,845.50 acts as the neckline or resistance. A sustained break above this level would confirm the cup and handle pattern.
* **Target:** Potential target around ₹3,904.50. This target is often estimated by measuring the depth of the cup and adding it to the breakout level.
**In simple terms:**
The stock price formed a rounded bottom (the cup), then went up and is now in a smaller pullback (the handle). If it breaks above the ₹2,868 level, it could potentially move towards the ₹3,904 area.
**Things to watch out for:**
* **Breakout Confirmation:** We need to see a clear break above ₹2,868.20 with strong buying volume to confirm the pattern.
* **Handle Formation:** The handle should ideally be a relatively shallow and short-lived consolidation.
* **Volume on Breakout:** Increased volume during the breakout would add more confidence to the bullish scenario.
Overall, the chart for DATA PATTERNS INDIA LTD suggests a bullish outlook based on the cup and handle pattern, with a potential target around ₹3,904.50 upon a successful breakout above ₹2,868.20.
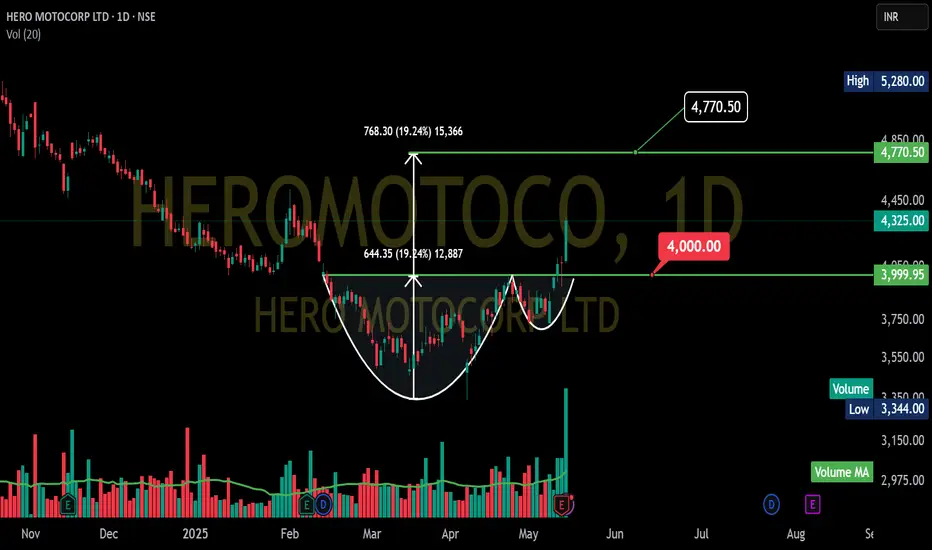
HEROMOTOCO - Daily Chart- CuP and HandleHERO MOTOCORP LTD daily chart, it seems like an interesting setup is forming.
It is potential cup and handle pattern. The "cup" portion appears to have formed between roughly early February and late April, and we might be seeing the beginning of the "handle" now.
Here's a breakdown of what I'm seeing:
Cup: The price has made a rounded bottom, suggesting a consolidation phase.
Handle (Potential): After reaching a high around ₹4,325, the price has pulled back slightly. If this pullback remains relatively shallow and trends upwards again, it could form the handle.
Breakout Level: Resistance level around ₹4,325. A decisive break above this level could signal the completion of the cup and handle pattern.
Target: Potential target around ₹4,770.50, which aligns with a common way to estimate the target of a cup and handle (measuring the depth of the cup and adding it to the breakout level). The calculation you've shown (₹4,325 + (₹4,325 - ₹3,680) ≈ ₹4,970) is slightly different but still in the same ballpark.
It's important to remember that this is just a potential pattern, and there's no guarantee it will play out. We need to see if the handle formation completes and if the price breaks out above that ₹4,325 level with good volume to confirm the pattern.
Keep an eye on the price action and volume in the coming days to see if this bullish setup materializes! Let me know if you have any other questions.
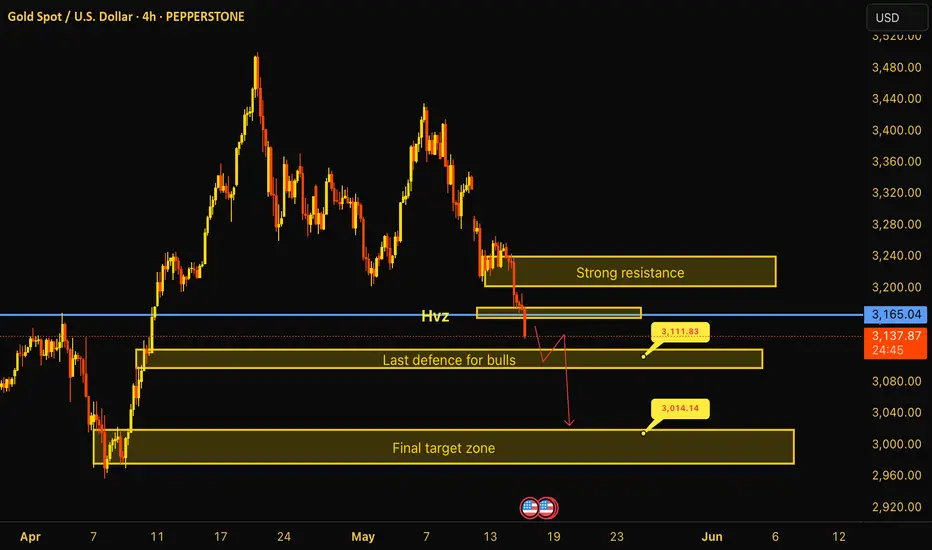
XAU/USD Medium-Term Breakdown: Market Structure Shift Confirmed!Gold has officially entered a bearish phase after decisively breaking below a key high-volume support zone around $3225, which now flips into a major resistance level. This wasn’t a minor flush — it was a clean structural break that reflects deeper underlying weakness.
⸻
Key Technical Highlights:
1. HVZ Breakdown – The Trend Flip Signal
The HVZ (High Volume Zone) at ~$3,165 was acting as a base where buyers previously absorbed sell pressure. But the recent breakdown with strong bearish candles confirms that buyers have lost control Still watch today close may15 -2025. Price attempted to hover above it for several sessions, but once it gave in, the breakdown was swift — signaling a shift in control from bulls to bears.
Now, any bounce back into the 3,150–3,165 range is likely to meet aggressive selling — this has now become a sell zone, not a support.
⸻
2. 3111 – The Last Stand for Bulls
The current trading region — around $3,111 —3120 is the final line of defense for buyers. This zone was an earlier demand pocket and acted as the origin of the strong April rally. If bulls can hold this, we may see short-term relief or a retest of HVZ.
But if this zone fails, especially on a candle close with volume, it would trigger another wave of liquidation, as this region is structurally thin and lacks strong historical support.
⸻
3. Projected Path – The Final Flush to $3,014–3,000
Once the 3111 level is broken, gold opens up downside space to the $3,014–3,000 zone — which is the final target as marked on the chart.
This zone is significant for three reasons:
• It marks the origin of the April bullish move.
• It’s a historical accumulation block.
• Psychological round number ($3,000) often acts as magnet for liquidity grabs or rebounds.
It’s also where institutional buyers may reappear to attempt a reversal, provided macro conditions align.
⸻
Momentum & Behavior:
The current momentum favors the bears:
• Lower highs, lower lows are in place.
• Failed breakout attempts above $3,240 only strengthened bearish intent.
• Breakdown below HVZ happened with conviction — not a fakeout.
Also, notice the slow grinding nature of the recent move. This isn’t panic selling, it’s a controlled liquidation, which often leads to a final flush, then sharp bounce — especially if macro triggers (like rate cuts or Fed dovishness) hit the news cycle.
⸻
Conclusion:
• Bias: Medium-term bearish
• Invalidation: Only above $3240 reclaim with volume
• Key Levels:
• Resistance: 3,165
• Pivot: 3,111
• Target: 3,014 / 3,000 zone
The safest approach now? Sell the bounces, not the dips — unless you’re playing the final drop scalps with tight risk.
#HDFCAMC - IHNS BreakOut in DTF 📊 Script: HDFCAMC
Key highlights: 💡⚡
📈 Inverse Head & Shoulders Set up in Daily Time Frame.
📈 Price consolidated near Resistance.
📈 BO with Volume
📈 MACD Crossover
📈 RS Line making 52WH
📈 One can go for Swing Trade.
BUY ONLY ABOVE 4700 DCB
⏱️ C.M.P 📑💰- 4703
🟢 Target 🎯🏆 – 8.6.0%
⚠️ Stoploss ☠️🚫 – 4.20%
️⚠️ Important: Market conditions are Okish, Position size 25% per Trade. Protect Capital Always
⚠️ Important: Always Exit the trade before any Event.
⚠️ Important: Always maintain your Risk:Reward Ratio as 1:2, with this RR, you only need a 33% win rate to Breakeven.
✅Like and follow to never miss a new idea!✅
Disclaimer: I am not SEBI Registered Advisor. My posts are purely for training and educational purposes.
Eat🍜 Sleep😴 TradingView📈 Repeat 🔁
Happy learning with MMT. Cheers!🥂
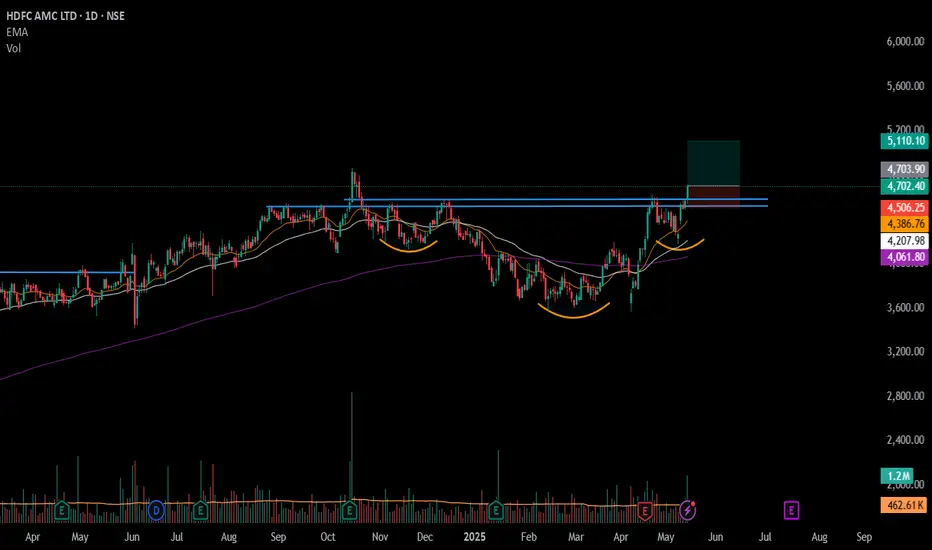
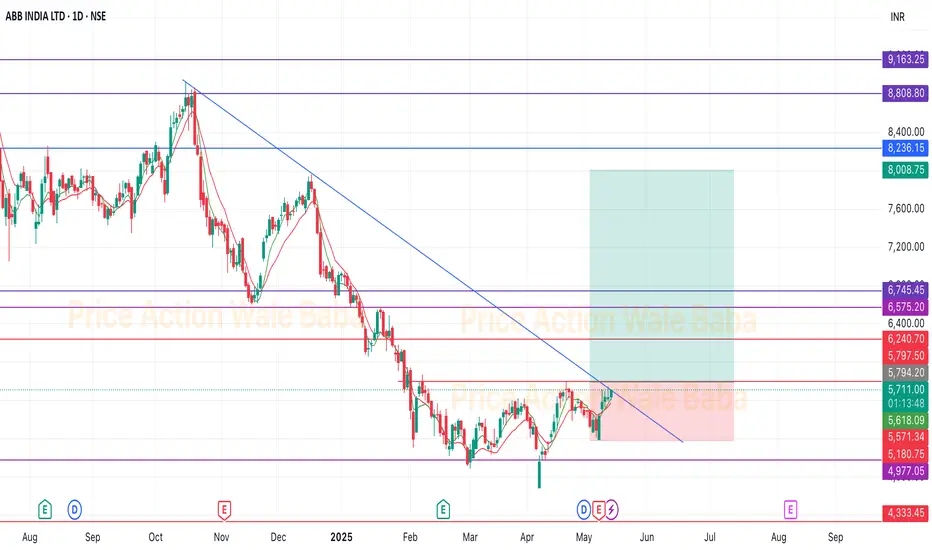
ABB India - BreakoutABB India
Stock is trading near trendline and above the breakout we can see target levels of 7500-8000.
Good to buy and hold for the next 5-12 years to achieve the target.
Buy on dips.
Big Bank BREAKOUT! Canara Bank Ready📉 Breakdown of the Setup:
✅ WTF CT (White Lines): 3+ confirmed touches → clean descending counter-trendline.
✅ Hidden Resistance (Dotted White Line): Clear breakout above key hidden level. Historic reaction zone.
✅ MTF Resistance (Yellow Line): Long-term resistance just above; nearing test zone (confluence resistance area ahead).
✅ Green Zone (Support/Resistance Flip):
Acted as strong support in 2024.
Fake breakdown trap ✔️
Price back above = bullish bias reinstated.
✅ Volume Surge: 124M+ on breakout candle ➕ major bullish close.

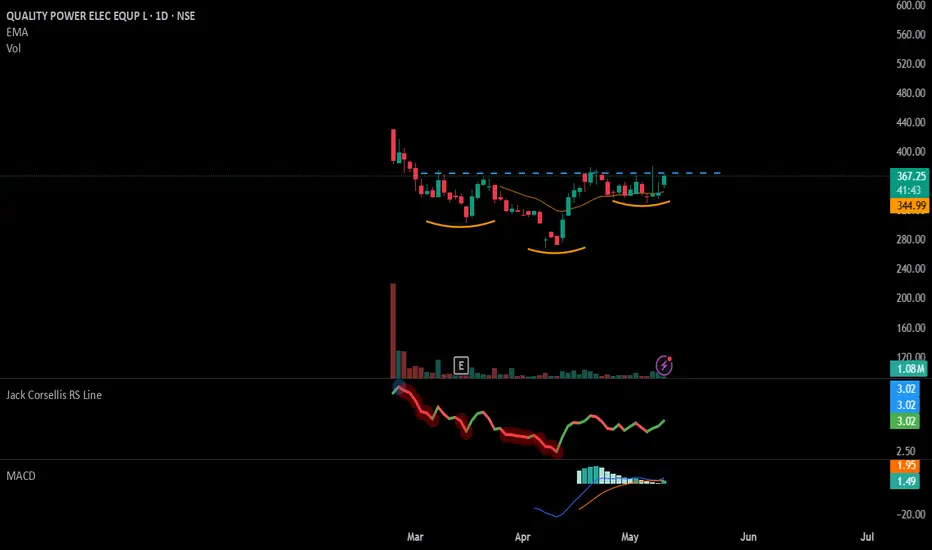
#QPOWER - IPO Stock Keep In Watch List📊 Script: QPOWER
Key highlights: 💡⚡
📈 Inverse Head & Shoulders in Daily Time Frame.
📈 Price consolidating near Resistance.
📈 Can Enter on BO with Volume spike.
📈 MACD Bounce
📈 One can go for Swing Trade.
BUY ONLY ABOVE 380 DCB
⏱️ C.M.P 📑💰- 376
🟢 Target 🎯🏆 – NA%
⚠️ Stoploss ☠️🚫 – NA%
️⚠️ Important: Market conditions are Okish, Position size 50% per Trade. Protect Capital Always
⚠️ Important: Always Exit the trade before any Event.
⚠️ Important: Always maintain your Risk:Reward Ratio as 1:2, with this RR, you only need a 33% win rate to Breakeven.
✅Like and follow to never miss a new idea!✅
Disclaimer: I am not SEBI Registered Advisor. My posts are purely for training and educational purposes.
Eat🍜 Sleep😴 TradingView📈 Repeat 🔁
Happy learning with MMT. Cheers!🥂
Gold Analysis >XAU/USD – 4H Chart 12/5/2025Gold is currently respecting the 3330–3350 zone as a strong supply region. This area has repeatedly acted as a ceiling where sellers have stepped in aggressively, preventing further upside momentum. The recent attempt to push higher was again met with selling pressure, confirming this level as a key short-term resistance.
Unless price decisively breaks above 3350 with strong volume, the bias remains mildly bearish. The downside targets the 3230 high volume zone, which is structurally important. This area has previously absorbed heavy orders and acted as a base for bullish continuation moves. If price approaches this level again, it could attract renewed buying interest.
For now, price seems caught in a range between strong sellers at the top and potential buyers waiting lower.

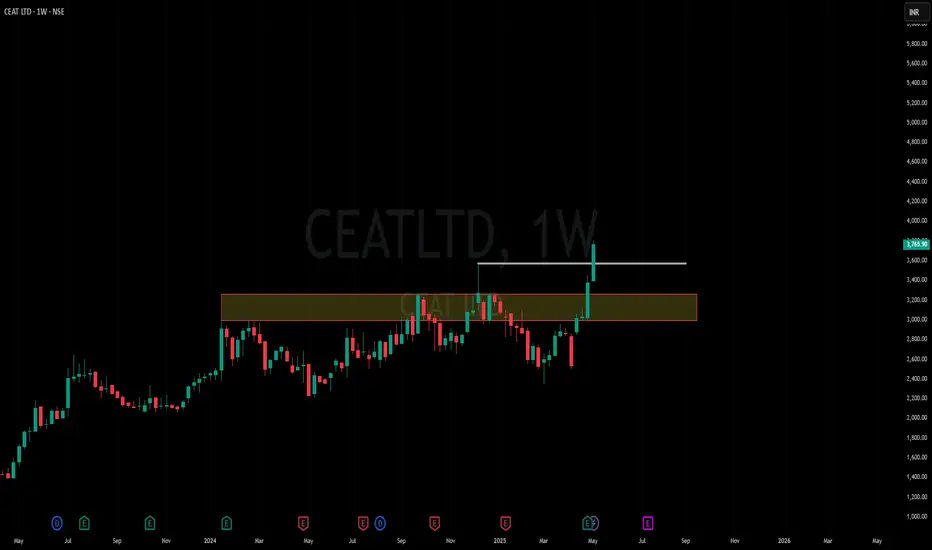
Amazing breakout on WEEKLY Timeframe - CEATLTDCheckout an amazing breakout happened in the stock in Weekly timeframe, macroscopically seen in Daily timeframe. Having a great favor that the stock might be bullish expecting a staggering returns of minimum 25% TGT. IMPORTANT BREAKOUT LEVELS ARE ALWAYS RESPECTED!
NOTE for learners: Place the breakout levels as per the chart shared and track it yourself to get amazed!!
#No complicated chart patterns
#No big big indicators
#No Excel sheet or number magics
TRADE IDEA: WAIT FOR THE STOCK TO BREAKOUT IN WEEKLY TIMEFRAME ABOVE THIS LEVEL.
Checkout an amazing breakout happened in the stock in Weekly timeframe.
Breakouts happening in longer timeframe is way more powerful than the breakouts seen in Daily timeframe. You can blindly invest once the weekly candle closes above the breakout line and stay invested forever. Also these stocks breakouts are lifelong predictions, it means technically these breakouts happen giving more returns in the longer runs. Hence, even when the scrip makes a loss of 10% / 20% / 30% / 50%, the stock will regain and turn around. Once they again enter the same breakout level, they will flyyyyyyyyyyyy like a ROCKET if held in the portfolio in the longer run.
Time makes money, GREEDY & EGO will not make money.
Also, magically these breakouts tend to prove that the companies turn around and fundamentally becoming strong. Also the magic happens when more diversification is done in various sectors under various scripts with equal money invested in each N500 scripts.
The real deal is when to purchase and where to purchase the stock. That is where Breakout study comes into play.
LET'S PUMP IN SOME MONEY AND REVOLUTIONIZE THE NATION'S ECONOMY!
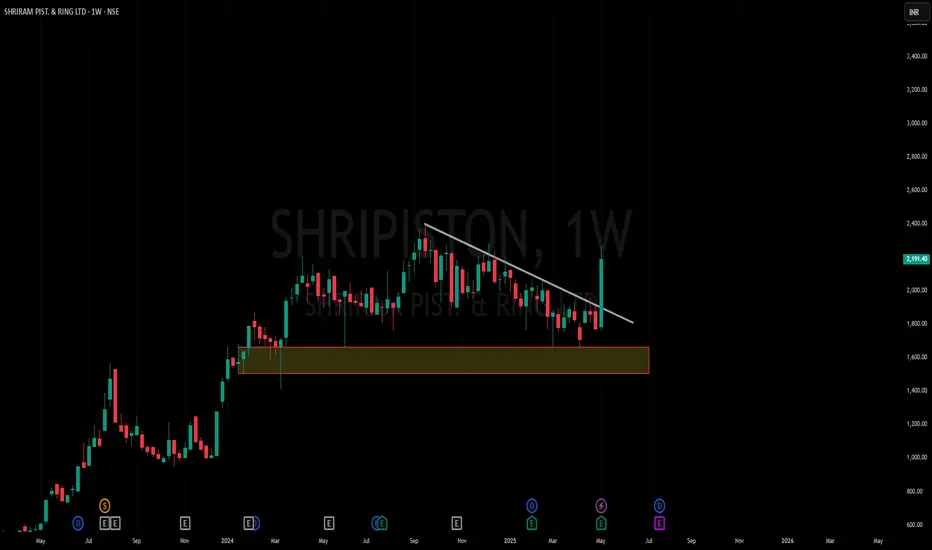
High conviction / value buy stock pick - SHRIPISTONCheck this stock which has made an all time low and high chances that it makes a "V" shaped recovery.
> Taking support at last years support or breakout level
> High chances that it reverses from this point.
> Volume dried up badly in last few months / days.
> Very high suspicion based analysis and not based on chart patterns / candle patterns deeply.
> VALUABLE STOCK AVAILABLE AT A DISCOUNTED PRICE
> OPPURTUNITY TO ACCUMULATE ADEQUATE QUANTITY
> MARKET AFTER A CORRECTION / PANIC FALL TO MAKE GOOD INVESTMENT
DISCLAIMER : This is just for educational purpose. This type of analysis is equivalent to catching a falling knife. If you are a warrior, you throw all the knives back else you will be sorrow if it hits SL. Make sure to do your analysis well. This type of analysis only suits high risks investor and whose is willing to throw all the knives above irrespective of any sectoral rotation. BE VERY CAUTIOUS AS IT IS EXTREME BOTTOM FISHING.
HOWEVER, THIS IS HOW MULTIBAGGERS ARE CAUGHT !
STOCK IS AT RIGHT PE / RIGHT EVALUATION / MORE ROAD TO GROW / CORRECTED IV / EXCELLENT BOOKS / USING MARKET CRASH AS AN OPPURTUNITY / EPS AT SKY.
Time makes money, GREEDY & EGO will not make money.
The real deal is when to purchase and where to purchase the stock.
LET'S PUMP IN SOME MONEY AND REVOLUTIONIZE THE NATION'S ECONOMY!
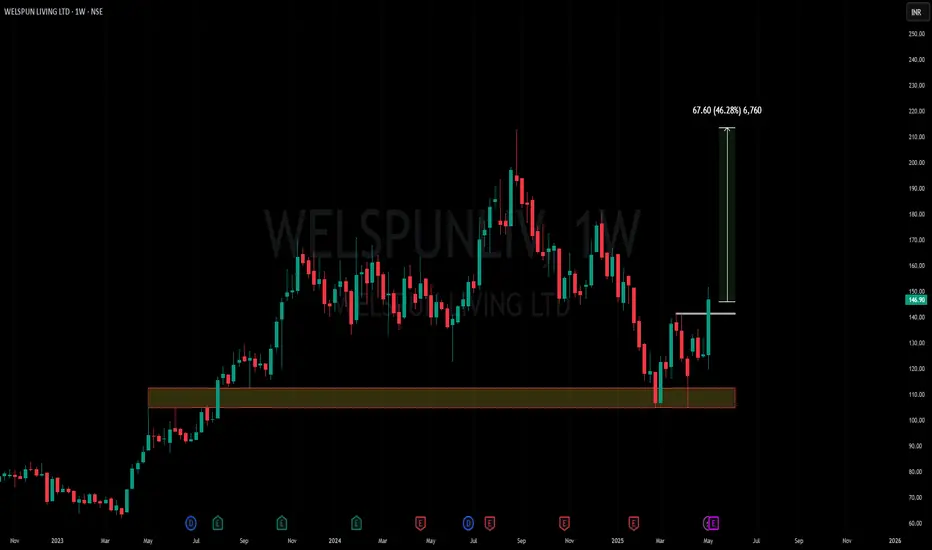
High conviction / value buy stock pick - WELSPUNLIVCheck this stock which has made an all time low and high chances that it makes a "V" shaped recovery.
> Taking support at last years support or breakout level
> High chances that it reverses from this point.
> Volume dried up badly in last few months / days.
> Very high suspicion based analysis and not based on chart patterns / candle patterns deeply.
> VALUABLE STOCK AVAILABLE AT A DISCOUNTED PRICE
> OPPURTUNITY TO ACCUMULATE ADEQUATE QUANTITY
> MARKET AFTER A CORRECTION / PANIC FALL TO MAKE GOOD INVESTMENT
DISCLAIMER : This is just for educational purpose. This type of analysis is equivalent to catching a falling knife. If you are a warrior, you throw all the knives back else you will be sorrow if it hits SL. Make sure to do your analysis well. This type of analysis only suits high risks investor and whose is willing to throw all the knives above irrespective of any sectoral rotation. BE VERY CAUTIOUS AS IT IS EXTREME BOTTOM FISHING.
HOWEVER, THIS IS HOW MULTIBAGGERS ARE CAUGHT !
STOCK IS AT RIGHT PE / RIGHT EVALUATION / MORE ROAD TO GROW / CORRECTED IV / EXCELLENT BOOKS / USING MARKET CRASH AS AN OPPURTUNITY / EPS AT SKY.
Time makes money, GREEDY & EGO will not make money.
The real deal is when to purchase and where to purchase the stock.
LET'S PUMP IN SOME MONEY AND REVOLUTIONIZE THE NATION'S ECONOMY!
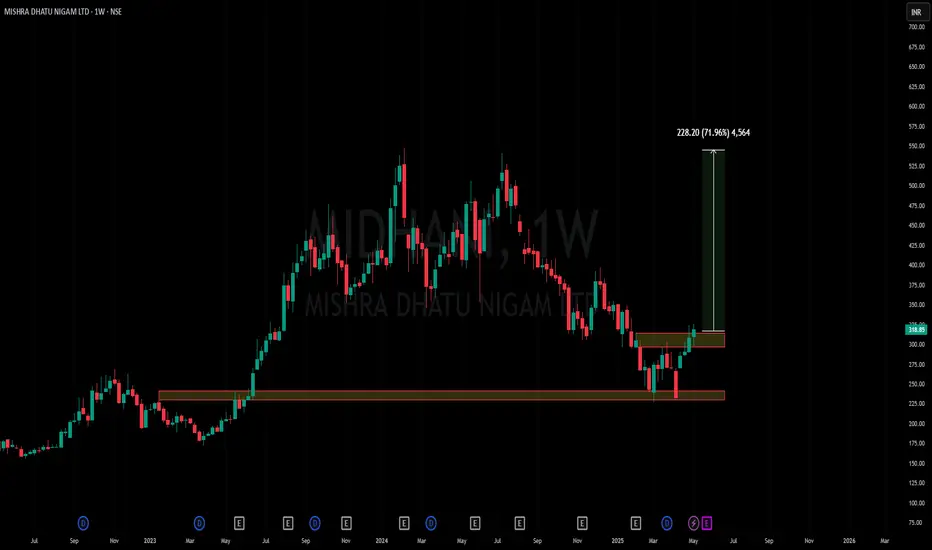
High conviction / value buy stock pick - MIDHANICheck this stock which has made an all time low and high chances that it makes a "V" shaped recovery.
> Taking support at last years support or breakout level
> High chances that it reverses from this point.
> Volume dried up badly in last few months / days.
> Very high suspicion based analysis and not based on chart patterns / candle patterns deeply.
> VALUABLE STOCK AVAILABLE AT A DISCOUNTED PRICE
> OPPURTUNITY TO ACCUMULATE ADEQUATE QUANTITY
> MARKET AFTER A CORRECTION / PANIC FALL TO MAKE GOOD INVESTMENT
DISCLAIMER : This is just for educational purpose. This type of analysis is equivalent to catching a falling knife. If you are a warrior, you throw all the knives back else you will be sorrow if it hits SL. Make sure to do your analysis well. This type of analysis only suits high risks investor and whose is willing to throw all the knives above irrespective of any sectoral rotation. BE VERY CAUTIOUS AS IT IS EXTREME BOTTOM FISHING.
HOWEVER, THIS IS HOW MULTIBAGGERS ARE CAUGHT !
STOCK IS AT RIGHT PE / RIGHT EVALUATION / MORE ROAD TO GROW / CORRECTED IV / EXCELLENT BOOKS / USING MARKET CRASH AS AN OPPURTUNITY / EPS AT SKY.
Time makes money, GREEDY & EGO will not make money.
The real deal is when to purchase and where to purchase the stock.
LET'S PUMP IN SOME MONEY AND REVOLUTIONIZE THE NATION'S ECONOMY!