Venus Remedies Limited - Breakout Setup, Move is ON...#VENUSREM trading above Resistance of 638
Next Resistance is at 1182
Support is at 424
Here is previous chart:
Chart is self explanatory. Levels of breakout, possible up-moves (where stock may find resistances) and support (close below which, setup will be invalidated) are clearly defined.
Disclaimer: This is for demonstration and educational purpose only. This is not buying or selling recommendations. I am not SEBI registered. Please consult your financial advisor before taking any trade.
Breakouttrading

Strong candle premierpol stcok to go longThis is the high probability that stock will bounce back from the current level. A very strong bullish engulfing candle has been seen . On breakout confirmation of the resistance area as well as the marked trend line take the long entry @ 46 with SL of 37 and Target price of Rs 70. A very good risk to reward ratio. This is for your educational purpose only.

BUY TODAY SELL TOMORROW for 5%DON’T HAVE TIME TO MANAGE YOUR TRADES?
- Take BTST trades at 3:25 pm every day
- Try to exit by taking 4-7% profit of each trade
- SL can also be maintained as closing below the low of the breakout candle
Now, why do I prefer BTST over swing trades? The primary reason is that I have observed that 90% of the stocks give most of the movement in just 1-2 days and the rest of the time they either consolidate or fall
Cup & Handle Breakout in GRWRHITECH
BUY TODAY SELL TOMORROW for 5%

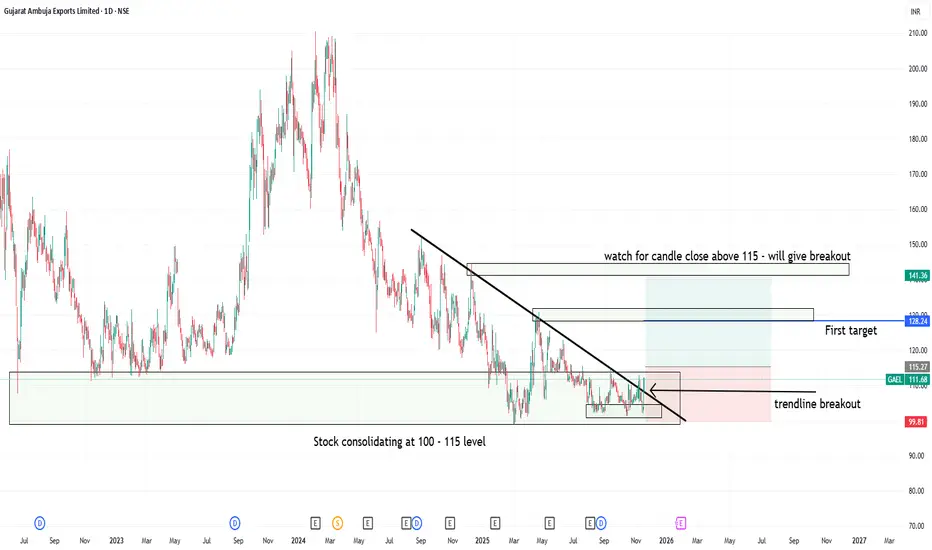
Trendline breakout at support level in GAEL1. Gujrat ambuja export lt- showing consolidation at 100 to 115 levels
2. Candle close above 115 can trigger consolidation breakout at strong support zone
3. Trendline breakout has already happend but above 115 close will be safe and logical
4. Good Risk:Reward one can watch for upside movement with strict sl level
BUY TODAY SELL TOMORROW for 5%DON’T HAVE TIME TO MANAGE YOUR TRADES?
- Take BTST trades at 3:25 pm every day
- Try to exit by taking 4-7% profit of each trade
- SL can also be maintained as closing below the low of the breakout candle
Now, why do I prefer BTST over swing trades? The primary reason is that I have observed that 90% of the stocks give most of the movement in just 1-2 days and the rest of the time they either consolidate or fall
Trendline Breakout in AVANTIFEED
BUY TODAY SELL TOMORROW for 5%

BBTC - Strong Bullish Momentum Breakout
💹 Bombay Burmah Trading Corp. Ltd (NSE: BBTC)
Sector: Diversified Holdings | CMP: 2022.70 | View: Strong Bullish Momentum Breakout
Chart Pattern: Falling Channel Breakout
Candlestick Pattern: Three Inside Up
Swing High: 2074
Swing Low: 1740
STWP Trade Analysis:
Breakout Entry: 2048
Stop Loss: 1816
Momentum: Very Strong
Volume: Exceptional institutional surge
The candle shows dominance from bulls with a surge above recent range, supported by fresh volume expansion and a clear shift in trend behaviour.
Resistances:
2099.47 | 2176.23 | 2304.47
Supports:
1894.47 | 1766.23 | 1689.47
STWP Stock Analysis:
Final Outlook:
Momentum: Strong | Trend: Bullish Developing | Risk: Moderate | Volume: Very High
BBTC has delivered a high-conviction breakout, with an explosive volume spike that clearly signals institutional participation. The strong bullish candle has invalidated prior downside pressure and pushed the stock above its short-term resistance band. The price action has reclaimed short-term averages and is moving away from the lower accumulation zone, supported by RSI stabilizing near the balanced zone, MACD attempting a recovery crossover, and Stochastic signalling early momentum buildup.
The VCP dashboard shows no active contractions but confirms volume dry-up previously, suggesting that the breakout candle represents the first expansion leg after consolidation. Volume today is unusually high, indicating ignition strength and potential start of a trend reversal from the recent downtrend.
Multiple confluences — 52-week volume breakout, EMA compression easing, Bullish Supertrend trigger, RSI rebound, and strong volume footprint — reinforce the improving momentum structure. Sustaining above 1894–1900 keeps the bullish bias intact and opens the path toward upper resistance zones at 2099 → 2176 → 2304.
Overall, BBTC now stands in a bullish reversal phase, driven by strong volume, improving indicators, and a clean breakout structure that favours continuation if the stock holds above its demand supports.
⚠️ Disclosure & Disclaimer – Please Read Carefully
The information shared here is purely for learning and educational purposes. It is not investment advice or a recommendation.
I am not a SEBI-registered advisor. All observations are based on charts, technical structures, and publicly available data.
Market trading involves significant risk. Please consult a SEBI-registered financial advisor before acting on any idea.
Position Status: No active position in BBTC at the time of analysis.
Data Source: TradingView & NSE India (Past Chart Reference).
💬 Found this useful?
🔼 Boost this post to support structured learning
✍️ Drop your thoughts or questions in the comments
🔁 Share with traders who benefit from clean technical studies
👉 Follow for disciplined, structured, STWP-style analysis.
🚀 Stay Calm. Stay Clean. Trade With Patience.
Trade Smart | Learn Zones | Be Self-Reliant 📊

Gold direction today November 17📊 Support – Resistance – Fibonacci Analysis
1. Trend Overview
Price has broken below the ascending channel, signaling a shift into a corrective downtrend phase.
2. Key Resistance Zone
4,215 – 4,230
Confluence of Fibonacci retracement 0.5 – 0.618
Overlaps with a supply zone + EMA89
→ Strong resistance, high probability of selling pressure.
This is also the expected pullback/retest area before the next bearish leg.
3. Key Support Levels
Support 1 – 4,000
Fibonacci extension 0.5
Horizontal support
→ Likely to generate a short-term reaction.
Support 2 – 3,890
Major downside target if the structure fully breaks
→ Primary bearish target for a deeper continuation.
4. Price Scenario
Price may pull back toward 4,215 – 4,230.
BUY GOLD : 4000 - 3997
Stoploss : 3987
Take Profit : 100-300-500pips
SELL GOLD : 4212 - 4215
Stoploss : 4225
Take Profit : 100-300-500pips

BREAKOUT TRADE IN GMRGMR has given breakout above 103 levels. Use stop of 100 on closing basis and look for 115 to 118 in short term.
volumes are backing GMR bullish momentum

Leela Palaces Hotels & Resorts Ltd – Inverted Head & ShouldersLeela Palaces has formed a clean Inverted Head & Shoulders pattern on the 75-minute timeframe, signalling a potential trend reversal after weeks of sideways movement.
Price has now broken above the neckline zone (~₹443–₹445) with a strong bullish candle, supported by improving volume — indicating buyers stepping back in.
A sustained move above the neckline could push the stock toward the measured target near ₹473–₹475, which aligns with previous swing supply.
🎯 Key Levels
CMP: ₹445.60 (+1.76%)
Neckline Zone: ₹443 – ₹445
Pattern Target: ₹472 – ₹475
Support Zone: ₹430 – ₹433
Stop-Loss: Below ₹430 (75-min close basis)
📈 Technical View
Clear Inverted H&S structure with shoulders at ₹428 & ₹435, and head at ~₹420.
EMA alignment turning positive (bullish slope developing).
Breakout candle above neckline confirms strength.
Volume improving during the breakout → added confirmation.
Immediate resistance now becomes support; a retest of ₹443–₹445 may offer opportunities.
🧠 View
Leela Palaces is breaking out of a well-formed Inverted Head & Shoulders pattern. If the price holds above the neckline, the stock may move towards the ₹473–₹475 zone. Watch for retest entries and volume continuation.

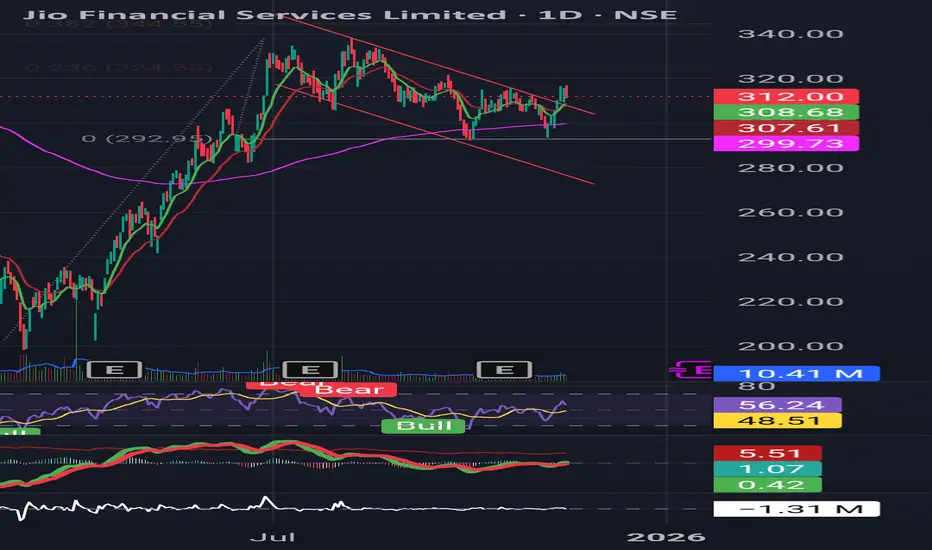
Jio Financial – Breakout Base Forming | Momentum Rebuilding
Structure
Price forming a clean ascending triangle with horizontal resistance near ₹285–289.
Higher lows forming consistently → accumulation behaviour visible.
Trend & Momentum
Trading above 21 EMA and 200 EMA, trend supportive.
RSI holding above 55, bull-range intact.
MACD flattening & attempting a positive crossover.
Volume
Contraction during consolidation → typical pre-breakout behaviour.
Key Levels
Breakout Trigger: Close above ₹289
Supports: ₹270 → ₹263
Invalidation: Close below ₹263
Bias
Bullish above breakout zone
Monitoring for volume expansion and strong close.
“Nifty Auto: Flagging Before the Next Leg?”Nifty Auto – Flagging After a Major Reversal
Big inverted Head & Shoulders completed on Nifty Auto with breakout above ~24,200.
Post-breakout, index is forming a bullish flag between ~26,300 (support) and ~27,500 (resistance).
Price action: trading above 9 & 21 EMAs, both starting to slope up again.
RSI: holding above 60 → bull range intact.
MACD: trying to turn positive → early signs of fresh momentum.
Trigger:
Bullish: Close above 27,500 can open the door to new highs in Auto.
Risk: Breakdown below 26,300–26,400 would weaken the pattern and short-term bias.
RRG lens (vs Nifty Auto benchmark):
Sector tail moving Improving → Leading → Auto regaining relative strength.
Leaders:
M&M – strong RS & momentum in Leading quadrant.
Ashok Leyland – still in Leading, though momentum needs monitoring.
Early improving: Motherson – turning up from Lagging, watch for follow-through.
Laggard: Hero Moto – remains in Lagging; not a leadership candidate yet.

Mastering Breakouts, Patterns, Fair Value Gaps and Risk RatiosLearn how to spot breakout patterns, leverage fair value gaps, and enter trades with smart risk management for consistent swing trading success
Charts used are older than 3 months

BUY TODAY SELL TOMORROW for 5%DON’T HAVE TIME TO MANAGE YOUR TRADES?
- Take BTST trades at 3:25 pm every day
- Try to exit by taking 4-7% profit of each trade
- SL can also be maintained as closing below the low of the breakout candle
Now, why do I prefer BTST over swing trades? The primary reason is that I have observed that 90% of the stocks give most of the movement in just 1-2 days and the rest of the time they either consolidate or fall
Trendline Breakout in BHAGYANGR
BUY TODAY SELL TOMORROW for 5%

BORORENEW Trade plan for 1:23 RR1. Market Trend - Bullish
2. Stock - Under consolidation
3. Price Trading at support
4. Risk is small & reward is way to good
5. Trade set up - Buy at support and sell or book at resistance
6. Every resistance, is your partial profit booking area or bringing SL at Break even

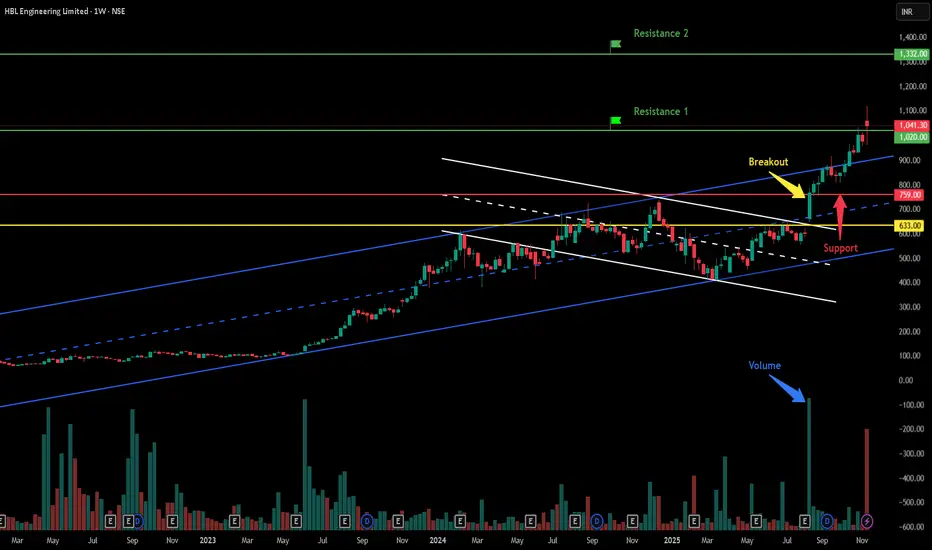
HBL Engineering Ltd - Breakout Setup, Move is ON...#HBLENGINE trading above Resistance of 1020
Next Resistance is at 1332
Support is at 759
Here is previous chart:
Chart is self explanatory. Levels of breakout, possible up-moves (where stock may find resistances) and support (close below which, setup will be invalidated) are clearly defined.
Disclaimer: This is for demonstration and educational purpose only. This is not buying or selling recommendations. I am not SEBI registered. Please consult your financial advisor before taking any trade.
BUY TODAY SELL TOMORROW for 5%DON’T HAVE TIME TO MANAGE YOUR TRADES?
- Take BTST trades at 3:25 pm every day
- Try to exit by taking 4-7% profit of each trade
- SL can also be maintained as closing below the low of the breakout candle
Now, why do I prefer BTST over swing trades? The primary reason is that I have observed that 90% of the stocks give most of the movement in just 1-2 days and the rest of the time they either consolidate or fall
Round Bottom & Retested Breakout in
HEMIPROP
BUY TODAY SELL TOMORROW for 5%

BUY TODAY SELL TOMORROW for 5%DON’T HAVE TIME TO MANAGE YOUR TRADES?
- Take BTST trades at 3:25 pm every day
- Try to exit by taking 4-7% profit of each trade
- SL can also be maintained as closing below the low of the breakout candle
Now, why do I prefer BTST over swing trades? The primary reason is that I have observed that 90% of the stocks give most of the movement in just 1-2 days and the rest of the time they either consolidate or fall
Trendline Breakout in PRIVISCL
BUY TODAY SELL TOMORROW for 5%

BUY TODAY SELL TOMORROW for 5%DON’T HAVE TIME TO MANAGE YOUR TRADES?
- Take BTST trades at 3:25 pm every day
- Try to exit by taking 4-7% profit of each trade
- SL can also be maintained as closing below the low of the breakout candle
Now, why do I prefer BTST over swing trades? The primary reason is that I have observed that 90% of the stocks give most of the movement in just 1-2 days and the rest of the time they either consolidate or fall
Inverted Head & Shoulder Breakout in TATVA
BUY TODAY SELL TOMORROW for 5%

BUY TODAY SELL TOMORROW for 5%DON’T HAVE TIME TO MANAGE YOUR TRADES?
- Take BTST trades at 3:25 pm every day
- Try to exit by taking 4-7% profit of each trade
- SL can also be maintained as closing below the low of the breakout candle
Now, why do I prefer BTST over swing trades? The primary reason is that I have observed that 90% of the stocks give most of the movement in just 1-2 days and the rest of the time they either consolidate or fall
Resistance Breakout in PSPPROJECT
BUY TODAY SELL TOMORROW for 5%

BUY TODAY SELL TOMORROW for 5%DON’T HAVE TIME TO MANAGE YOUR TRADES?
- Take BTST trades at 3:25 pm every day
- Try to exit by taking 4-7% profit of each trade
- SL can also be maintained as closing below the low of the breakout candle
Now, why do I prefer BTST over swing trades? The primary reason is that I have observed that 90% of the stocks give most of the movement in just 1-2 days and the rest of the time they either consolidate or fall
Trendline Breakout in PRECWIRE
BUY TODAY SELL TOMORROW for 5%

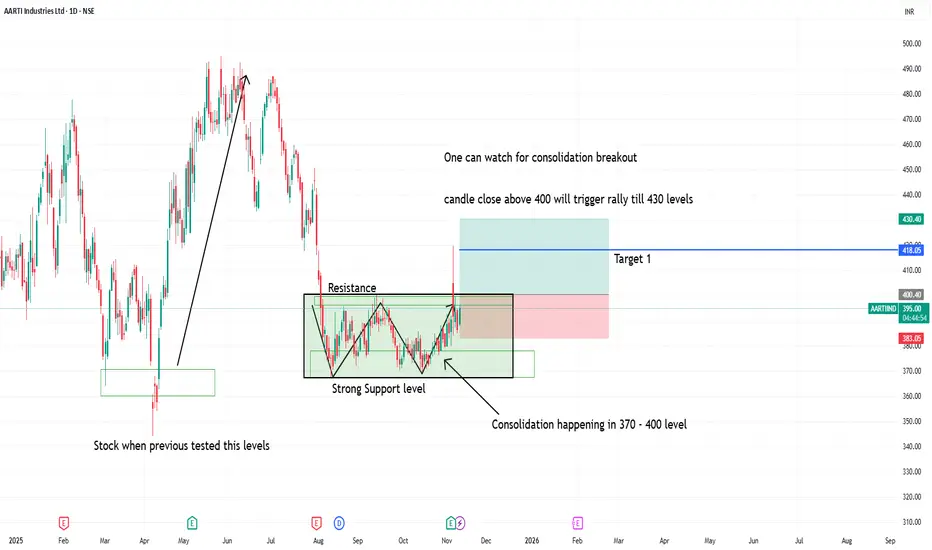
Watch for consolidation breakout in aarti industries1. Above 400 daily candle close will give strength to buyers to reach 430 level targets
2. Stock previously tested support levels gave big upside movement.
3. With good R:R one can watch for upside movement
4. normally the range of consolidation is target after breakout
if 30 points is consolidation range then target will 30 points after the consolidation breakout
BUY TODAY SELL TOMORROW for 5%DON’T HAVE TIME TO MANAGE YOUR TRADES?
- Take BTST trades at 3:25 pm every day
- Try to exit by taking 4-7% profit of each trade
- SL can also be maintained as closing below the low of the breakout candle
Now, why do I prefer BTST over swing trades? The primary reason is that I have observed that 90% of the stocks give most of the movement in just 1-2 days and the rest of the time they either consolidate or fall
Resistance Breakout in POWERINDIA
BUY TODAY SELL TOMORROW for 5%

BUY TODAY SELL TOMORROW for 5%DON’T HAVE TIME TO MANAGE YOUR TRADES?
- Take BTST trades at 3:25 pm every day
- Try to exit by taking 4-7% profit of each trade
- SL can also be maintained as closing below the low of the breakout candle
Now, why do I prefer BTST over swing trades? The primary reason is that I have observed that 90% of the stocks give most of the movement in just 1-2 days and the rest of the time they either consolidate or fall
Round Bottom Breakout in NATIONALUM
BUY TODAY SELL TOMORROW for 5%
