Le Travenues Technology Ltd - Breakout Setup, Move is ON...#IXIGO trading above Resistance of 327
Next Resistance is at 460
Support is at 249
Here is previous chart:
Chart is self explanatory. Levels of breakout, possible up-moves (where stock may find resistances) and support (close below which, setup will be invalidated) are clearly defined.
Disclaimer: This is for demonstration and educational purpose only. This is not buying or selling recommendations. I am not SEBI registered. Please consult your financial advisor before taking any trade.
Breakouttrading

Inox Green Energy Services Ltd - Breakout Setup, Move is ON...#INOXGREEN trading above Resistance of 245
Next Resistance is at 363
Support is at 143
Here are previous charts:
Chart is self explanatory. Levels of breakout, possible up-moves (where stock may find resistances) and support (close below which, setup will be invalidated) are clearly defined.
Disclaimer: This is for demonstration and educational purpose only. This is not buying or selling recommendations. I am not SEBI registered. Please consult your financial advisor before taking any trade.

Inox Green Energy Services Ltd - Breakout Setup, Move is ON...#INOXGREEN trading above Resistance of 160
Next Resistance is at 245
Support is at 99
Here are previous charts:
Chart is self explanatory. Levels of breakout, possible up-moves (where stock may find resistances) and support (close below which, setup will be invalidated) are clearly defined.
Disclaimer: This is for demonstration and educational purpose only. This is not buying or selling recommendations. I am not SEBI registered. Please consult your financial advisor before taking any trade.

#CARRARO - Large Base BreakOut Script: CARRARO
Key highlights: 💡⚡
📈 VCP BreakOut in Daily Time Frame
📈 Volume spike during Breakout
📈 Large Base BreakOut
📈 MACD Bounce
📈 Can go for a swing trade
BUY ONLY ABOVE 514 DCB
⏱️ C.M.P 📑💰- 507
🟢 Target 🎯🏆 – 24%
⚠️ Stoploss ☠️🚫 – 12%
⚠️ Important: Market conditions are Okish, Position size 50% per Trade. Protect Capital Always
⚠️ Important: Always Exit the trade before any Event.
⚠️ Important: Always maintain your Risk:Reward Ratio as 1:2, with this RR, you only need a 33% win rate to Breakeven.
✅Like and follow to never miss a new idea!✅
Disclaimer: I am not SEBI Registered Advisor. My posts are purely for training and educational purposes.
Eat🍜 Sleep😴 TradingView📈 Repeat 🔁

Breakout and Breakdown Trading1. Introduction to Breakout and Breakdown Trading
In financial markets, price movement is influenced by the forces of supply and demand. Traders identify key levels where these forces tend to converge and then anticipate movements when price “breaks out” above a resistance level or “breaks down” below a support level.
Breakout Trading: A strategy that involves entering a position when the price moves above a defined resistance level with the expectation of further upward momentum.
Breakdown Trading: The opposite approach, where traders enter a position when the price falls below a support level, anticipating a continuation of downward movement.
These strategies are rooted in technical analysis, relying on historical price action and market psychology rather than fundamental factors.
2. Core Concepts
2.1 Support and Resistance
Support: A price level where buying interest is strong enough to prevent further decline. It acts as a “floor.”
Resistance: A price level where selling pressure is strong enough to prevent further increase. It acts as a “ceiling.”
Breakouts occur when price surpasses resistance, while breakdowns happen when price falls below support.
2.2 Volume
Volume is a crucial confirmation tool. A breakout or breakdown is considered strong if accompanied by increased trading volume, as this indicates genuine market participation rather than a false move.
2.3 Price Consolidation
Before breakouts or breakdowns, prices often consolidate in tight ranges. These consolidations can be:
Rectangles
Triangles
Flags and pennants
Understanding the consolidation pattern helps traders anticipate the direction and magnitude of the breakout or breakdown.
3. Types of Breakouts and Breakdowns
3.1 Horizontal Breakouts
Occur when price breaks a clearly defined horizontal support or resistance.
Example: A stock repeatedly fails to move above $100. A breakout above $100 signals upward momentum.
3.2 Trendline Breakouts
Occur when price crosses a diagonal trendline drawn along highs or lows.
Uptrend breakout: Price breaks above a descending trendline.
Downtrend breakdown: Price falls below an ascending trendline.
3.3 Pattern-Based Breakouts
Certain chart patterns often precede strong breakouts or breakdowns:
Triangles: Symmetrical, ascending, or descending triangles
Rectangles: Price moves within a horizontal range
Flags and Pennants: Continuation patterns after a sharp move
Pattern-based breakouts tend to offer predictable price targets based on pattern dimensions.
4. Breakout Trading Strategy
4.1 Identifying a Breakout
Look for a well-defined resistance level or consolidation pattern.
Confirm breakout using volume: higher than average volume indicates strong buying interest.
Check for fundamental or news catalysts that may strengthen the breakout.
4.2 Entry Techniques
Aggressive Entry: Enter immediately when price crosses resistance.
Conservative Entry: Wait for a candle to close above resistance to confirm breakout.
4.3 Stop Loss Placement
Below the breakout point or recent swing low.
Helps protect against false breakouts.
4.4 Profit Targets
Use pattern-based targets: For triangles or rectangles, project the height of the pattern above breakout.
Use trailing stops to capture extended moves without exiting too early.
5. Breakdown Trading Strategy
5.1 Identifying a Breakdown
Look for a strong support level or consolidation pattern.
Check for rising selling volume: heavy selling confirms breakdown.
Identify any macroeconomic or sector-specific events that may accelerate declines.
5.2 Entry Techniques
Aggressive Entry: Enter immediately as the price breaks support.
Conservative Entry: Wait for a candle close below support to reduce risk.
5.3 Stop Loss Placement
Above the breakdown point or recent swing high.
Protects against false breakdowns where the price quickly recovers.
5.4 Profit Targets
Pattern-based projections: Use the height of the consolidation pattern subtracted from the breakdown point.
Trailing stops help lock in gains in volatile markets.
6. Psychological Aspects of Breakout and Breakdown Trading
Trading breakouts and breakdowns is as much psychological as technical:
6.1 Fear of Missing Out (FOMO)
Many traders enter too early due to FOMO, risking false breakouts.
Patience and confirmation reduce this risk.
6.2 Market Sentiment
Breakouts often occur when sentiment shifts from neutral or negative to bullish.
Breakdowns often coincide with panic selling or negative news.
6.3 Confirmation Bias
Traders may see a breakout or breakdown where none exists.
Strict adherence to predefined rules prevents bias-driven errors.
7. Common Mistakes and Risks
7.1 False Breakouts/Breakdowns
Occur when price briefly crosses support or resistance but reverses immediately.
Mitigation: Wait for candle close, confirm with volume, and consider broader market trend.
7.2 Overleveraging
Using excessive margin amplifies losses if breakout fails.
Always use proper risk management (1–2% of capital per trade).
7.3 Ignoring Market Context
Breakouts in choppy or low-liquidity markets are less reliable.
Always consider overall market trend, sector strength, and macroeconomic factors.
8. Tools and Indicators for Confirmation
8.1 Volume Indicators
On-Balance Volume (OBV)
Volume Oscillator
8.2 Momentum Indicators
RSI (Relative Strength Index): Confirms overbought or oversold conditions
MACD (Moving Average Convergence Divergence): Identifies trend shifts
8.3 Moving Averages
Help confirm breakout/breakdown trend direction.
Common strategy: Wait for price to cross above/below 20-day or 50-day moving average.
9. Examples of Breakout and Breakdown Trading
9.1 Breakout Example
Stock consolidates between $50–$55.
Breaks above $55 on heavy volume, closing at $56.
Entry: $56
Stop Loss: $54.50 (below consolidation)
Target: $61 (height of consolidation added to breakout level)
9.2 Breakdown Example
Stock trades between $70–$65.
Falls below $65 with high volume, closing at $64.
Entry: $64
Stop Loss: $66 (above consolidation)
Target: $59 (height of consolidation subtracted from breakdown level)
10. Advanced Techniques
10.1 Pullback Entry
After breakout, price often retests the breakout level.
Provides lower-risk entry opportunities.
10.2 Multiple Timeframe Analysis
Confirm breakout on higher timeframe (daily or weekly) while entering on lower timeframe (hourly or 15-min).
Reduces the likelihood of false breakouts.
10.3 Combining with Fundamental Analysis
Breakouts accompanied by strong earnings, positive news, or macroeconomic support have higher reliability.
Breakdowns following negative news or sector weakness confirm downward trend.
Conclusion
Breakout and breakdown trading is a cornerstone of technical trading, blending market psychology, price action, and disciplined risk management. While the concept is simple—buy above resistance and sell below support—the execution requires attention to volume, patterns, market context, and trading psychology. Traders who master these strategies can capitalize on strong momentum moves and manage risk effectively.
Successful breakout and breakdown trading hinges on patience, confirmation, proper entry and exit points, and disciplined risk management. By combining technical indicators, volume analysis, and pattern recognition, traders can improve the probability of capturing meaningful market moves while avoiding the pitfalls of false signals.

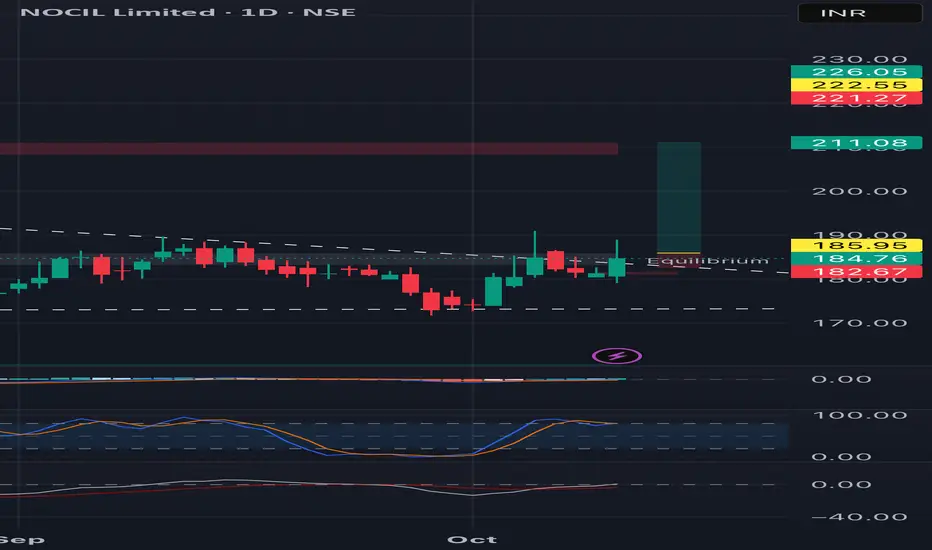
Breakout in NOCILPossibility of a strong breakout in NOCIL.
One can enter above 186 for a possible target of 210.
Note - I am not SEBI registered. This is only for educational purpose..
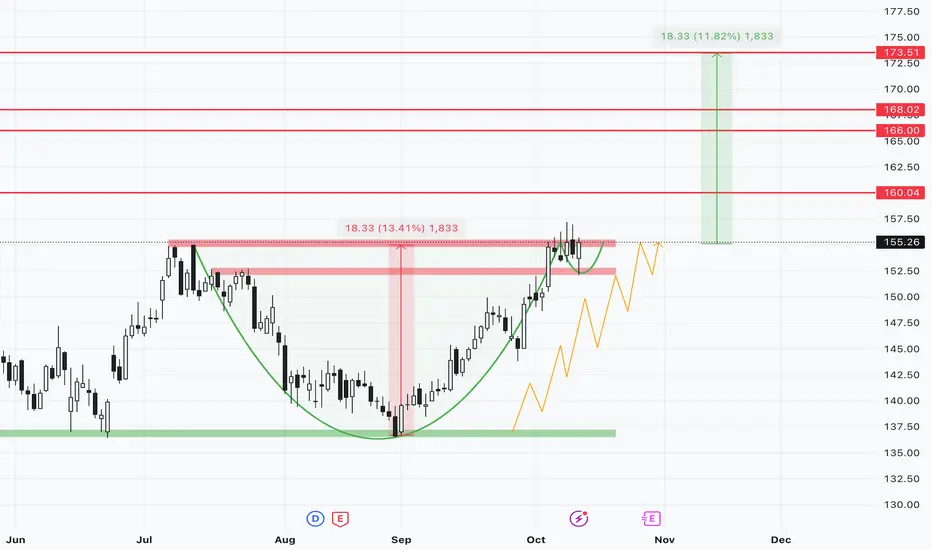
IOC - Potential breakout swing candidateChart Analysis :
Price sustaining near its major resistance of 155 and gave a retest today near 152 level. If breaks out and sustains 1hour above 156 can consider for long. Following a Cup and Handle pattern with Higher Highs intact from recent September lows.
Key Levels :
Support : 152/150
Resistance/Targets : 157/160/166/168/173
StopLoss: 150 Closing basis
Disclaimer:
I am not SEBI registered. This analysis is for educational purposes only and not investment advice. Please do your own research before trading or investing.
BUY TODAY SELL TOMORROW for 5%DON’T HAVE TIME TO MANAGE YOUR TRADES?
- Take BTST trades at 3:25 pm every day
- Try to exit by taking 4-7% profit of each trade
- SL can also be maintained as closing below the low of the breakout candle
Now, why do I prefer BTST over swing trades? The primary reason is that I have observed that 90% of the stocks give most of the movement in just 1-2 days and the rest of the time they either consolidate or fall
Round Bottom Breakout in SANSTAR
BUY TODAY SELL TOMORROW for 5%

BUY TODAY SELL TOMORROW for 5%DON’T HAVE TIME TO MANAGE YOUR TRADES?
- Take BTST trades at 3:25 pm every day
- Try to exit by taking 4-7% profit of each trade
- SL can also be maintained as closing below the low of the breakout candle
Now, why do I prefer BTST over swing trades? The primary reason is that I have observed that 90% of the stocks give most of the movement in just 1-2 days and the rest of the time they either consolidate or fall
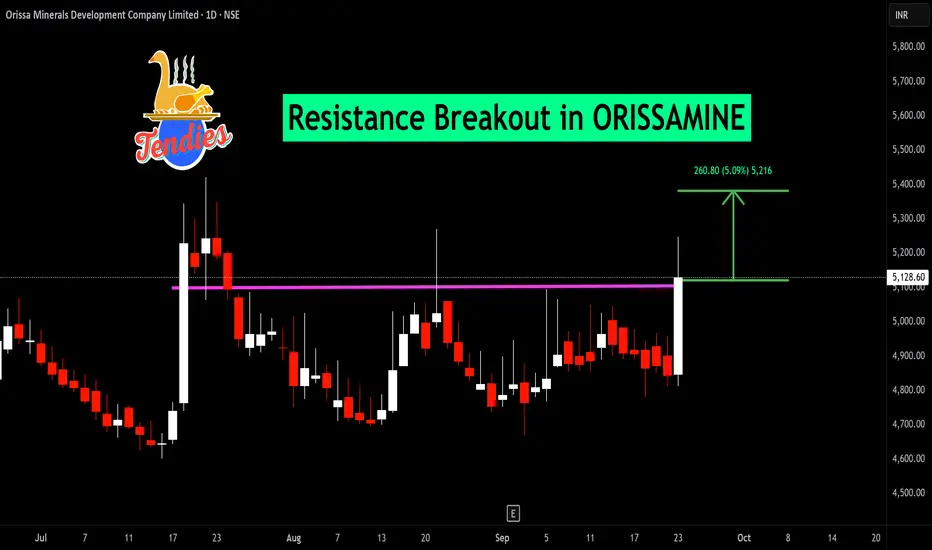
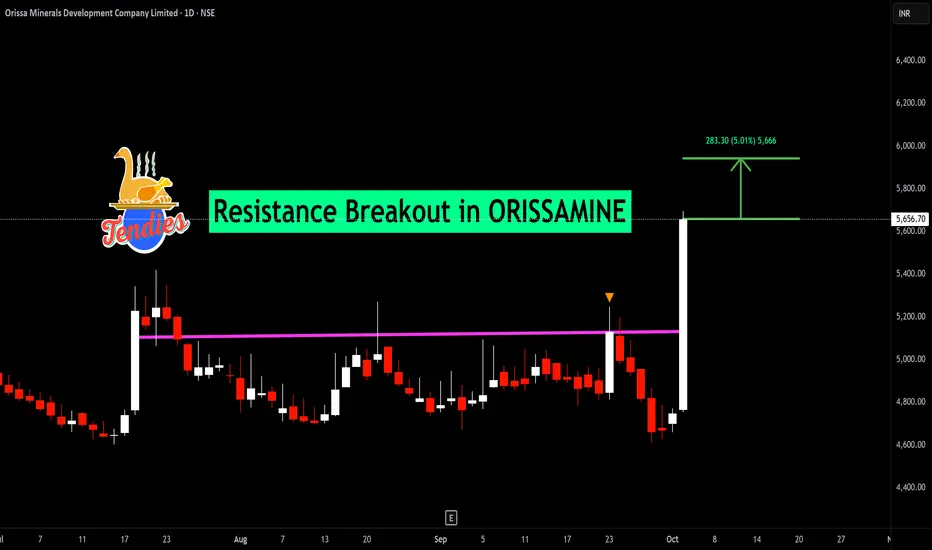
Resistance Breakout in ORISSAMINE
BUY TODAY SELL TOMORROW for 5%
BUY TODAY SELL TOMORROW for 5%DON’T HAVE TIME TO MANAGE YOUR TRADES?
- Take BTST trades at 3:25 pm every day
- Try to exit by taking 4-7% profit of each trade
- SL can also be maintained as closing below the low of the breakout candle
Now, why do I prefer BTST over swing trades? The primary reason is that I have observed that 90% of the stocks give most of the movement in just 1-2 days and the rest of the time they either consolidate or fall
Cup & Handle Breakout in SRM
BUY TODAY SELL TOMORROW for 5%

BUY TODAY SELL TOMORROW for 5%DON’T HAVE TIME TO MANAGE YOUR TRADES?
- Take BTST trades at 3:25 pm every day
- Try to exit by taking 4-7% profit of each trade
- SL can also be maintained as closing below the low of the breakout candle
Now, why do I prefer BTST over swing trades? The primary reason is that I have observed that 90% of the stocks give most of the movement in just 1-2 days and the rest of the time they either consolidate or fall
Resistance Breakout in KMCSHIL
BUY TODAY SELL TOMORROW for 5%

BUY TODAY SELL TOMORROW for 5%DON’T HAVE TIME TO MANAGE YOUR TRADES?
- Take BTST trades at 3:25 pm every day
- Try to exit by taking 4-7% profit of each trade
- SL can also be maintained as closing below the low of the breakout candle
Now, why do I prefer BTST over swing trades? The primary reason is that I have observed that 90% of the stocks give most of the movement in just 1-2 days and the rest of the time they either consolidate or fall
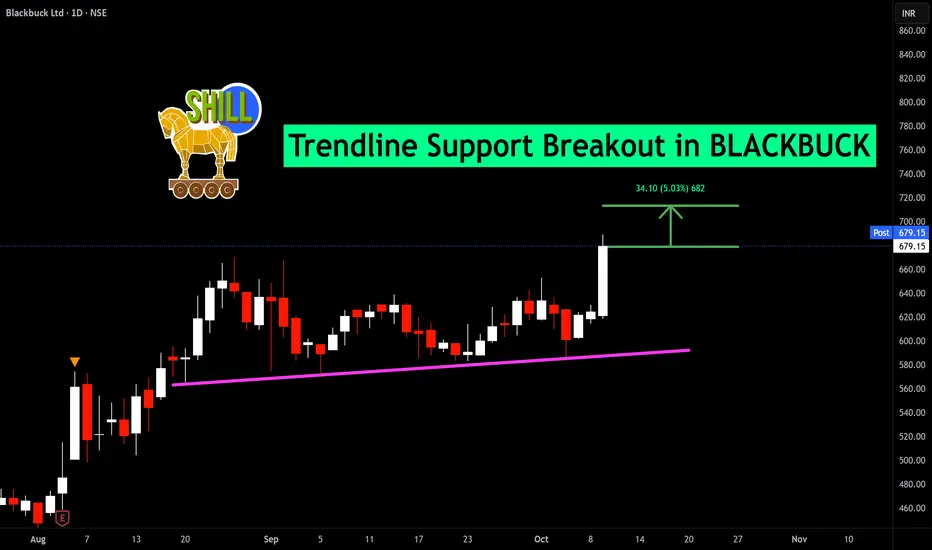
Trendline Support Breakout in BLACKBUCK
BUY TODAY SELL TOMORROW for 5%
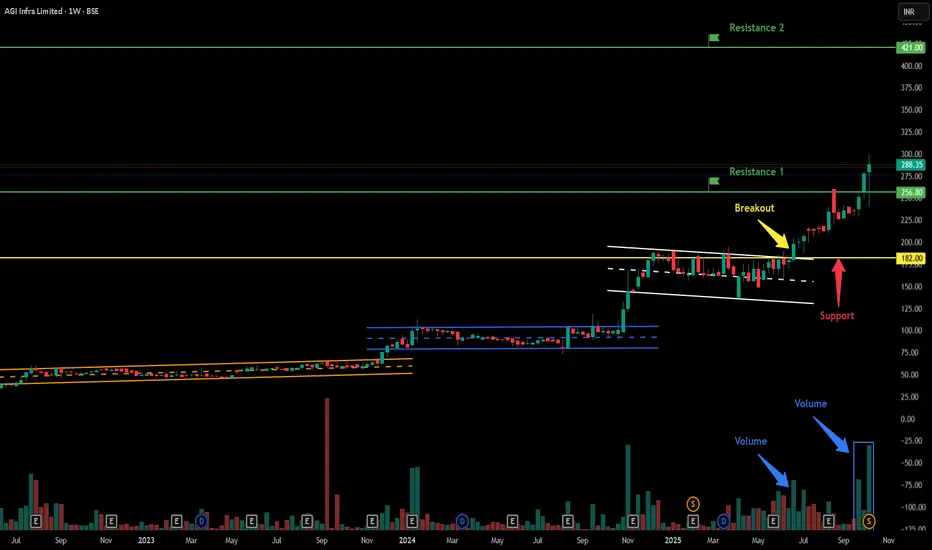
AGI Infra Ltd - Breakout Setup, Move is ON...#AGIIL trading above Resistance of 256.80
Next Resistance is at 421
Support is at 182
Here is previous chart:
Chart is self explanatory. Levels of breakout, possible up-moves (where stock may find resistances) and support (close below which, setup will be invalidated) are clearly defined.
Disclaimer: This is for demonstration and educational purpose only. This is not buying or selling recommendations. I am not SEBI registered. Please consult your financial advisor before taking any trade.
Bajaj Finance Limited- Breakout Setup, Move is ON...#BAJFINANCE trading above Resistance of 1004.50
Next Resistance is at 1182
Support is at 851
Here is previous chart:
Chart is self explanatory. Levels of breakout, possible up-moves (where stock may find resistances) and support (close below which, setup will be invalidated) are clearly defined.
Disclaimer: This is for demonstration and educational purpose only. This is not buying or selling recommendations. I am not SEBI registered. Please consult your financial advisor before taking any trade.

Indraprastha Medical Corporation Ltd- Breakout Setup, Move is ON#INDRAMEDCO trading above Resistance of 547
Next Resistance is at 789
Support is at 390
Here are previous charts:
Chart is self explanatory. Levels of breakout, possible up-moves (where stock may find resistances) and support (close below which, setup will be invalidated) are clearly defined.
Disclaimer: This is for demonstration and educational purpose only. This is not buying or selling recommendations. I am not SEBI registered. Please consult your financial advisor before taking any trade.

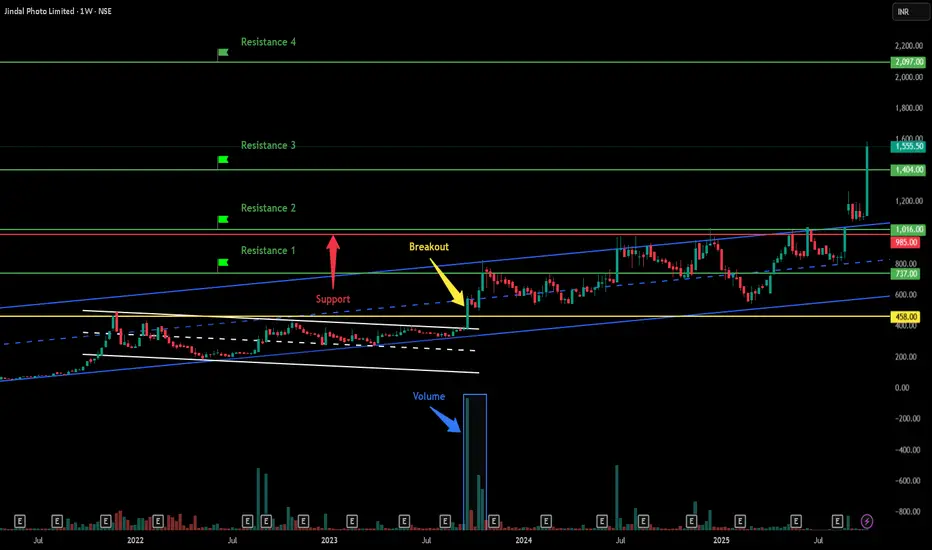
Jindal Photo Limited - Breakout Setup, Move is ON...#JINDALPHOT trading above Resistance of 1404
Next Resistance is at 2097
Support is at 985
Here are previous charts:
Chart is self explanatory. Levels of breakout, possible up-moves (where stock may find resistances) and support (close below which, setup will be invalidated) are clearly defined.
Disclaimer: This is for demonstration and educational purpose only. This is not buying or selling recommendations. I am not SEBI registered. Please consult your financial advisor before taking any trade.
BEL I think here it create small strong base ,with good accumulation volume
Comapare to nifty 50 index stock more strong ,
Here risk 6% if price 1day close below 392 exit .
Target 20% after 50% book half trailing with ema

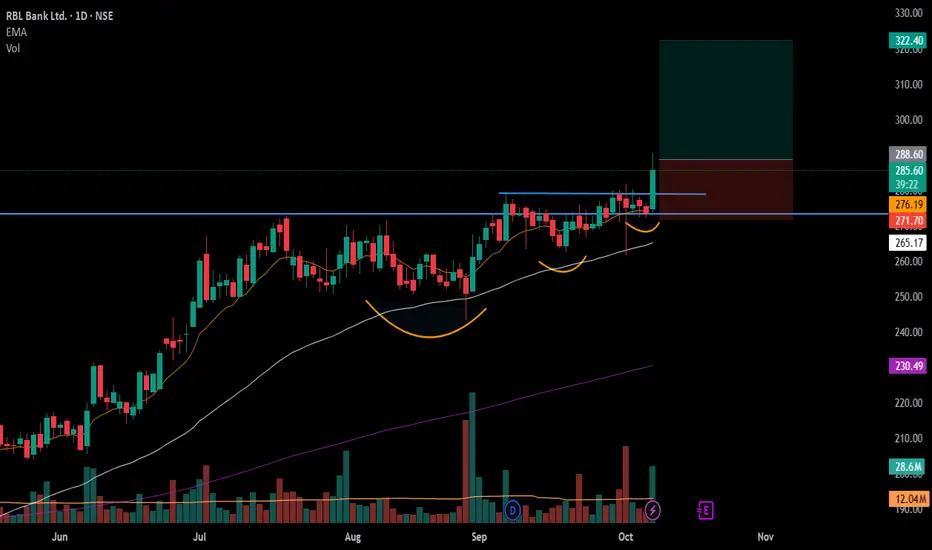
#RBLBANK - VCP BreakOut in Daily Time FrameScript: RBLBANK
Key highlights: 💡⚡
📈 VCP BreakOut in Daily Time Frame
📈 Volume spike during Breakout
📈 Large Base BreakOut – Zoom Out
📈 Private Bank Sector showing strength
📈 Can go for a swing trade
BUY ONLY ABOVE 288 DCB
⏱️ C.M.P 📑💰- 286.90
🟢 Target 🎯🏆 – 12%
⚠️ Stoploss ☠️🚫 – 6%
⚠️ Important: Market conditions are Bad, Position size 25% per Trade. Protect Capital Always
⚠️ Important: Always Exit the trade before any Event.
⚠️ Important: Always maintain your Risk:Reward Ratio as 1:2, with this RR, you only need a 33% win rate to Breakeven.
✅Like and follow to never miss a new idea!✅
Disclaimer: I am not SEBI Registered Advisor. My posts are purely for training and educational purposes.
Eat🍜 Sleep😴 TradingView📈 Repeat 🔁
Happy learning with MMT. Cheers!🥂
BUY TODAY SELL TOMORROW for 5%DON’T HAVE TIME TO MANAGE YOUR TRADES?
- Take BTST trades at 3:25 pm every day
- Try to exit by taking 4-7% profit of each trade
- SL can also be maintained as closing below the low of the breakout candle
Now, why do I prefer BTST over swing trades? The primary reason is that I have observed that 90% of the stocks give most of the movement in just 1-2 days and the rest of the time they either consolidate or fall
Resistance Breakout in IGL
BUY TODAY SELL TOMORROW for 5%
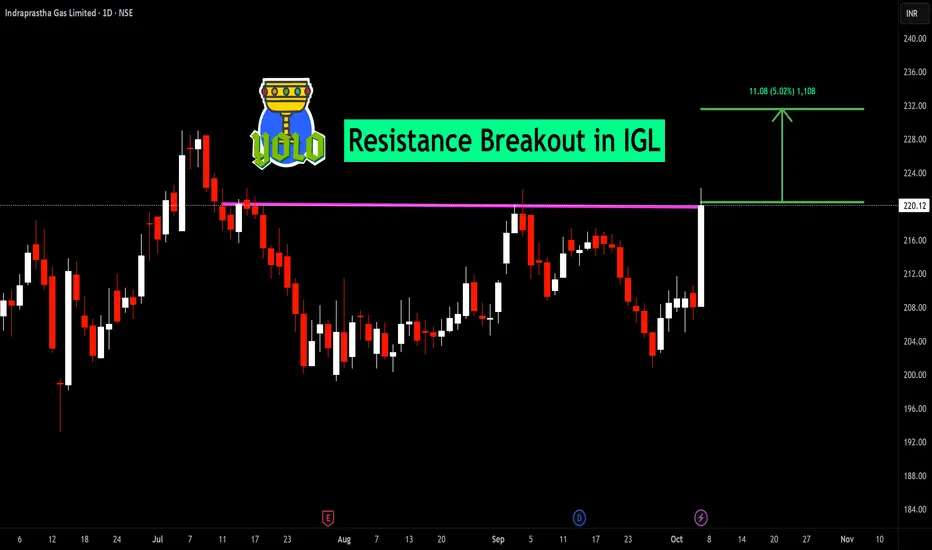
BUY TODAY SELL TOMORROW for 5%DON’T HAVE TIME TO MANAGE YOUR TRADES?
- Take BTST trades at 3:25 pm every day
- Try to exit by taking 4-7% profit of each trade
- SL can also be maintained as closing below the low of the breakout candle
Now, why do I prefer BTST over swing trades? The primary reason is that I have observed that 90% of the stocks give most of the movement in just 1-2 days and the rest of the time they either consolidate or fall
Round Bottom Breakout in PREMEXPLN
BUY TODAY SELL TOMORROW for 5%

PETRONET LONGAfter making a base and consolidating Petronet has given a breakout. One can look for entry here or at dips around 285 286 levels.
SL- 280
Target- 295, 300.
Disclaimer This is just for educational purpose.
Jai Shree ram.

BUY TODAY SELL TOMORROW for 5%DON’T HAVE TIME TO MANAGE YOUR TRADES?
- Take BTST trades at 3:25 pm every day
- Try to exit by taking 4-7% profit of each trade
- SL can also be maintained as closing below the low of the breakout candle
Now, why do I prefer BTST over swing trades? The primary reason is that I have observed that 90% of the stocks give most of the movement in just 1-2 days and the rest of the time they either consolidate or fall
Resistance Breakout in ORISSAMINE
BUY TODAY SELL TOMORROW for 5%
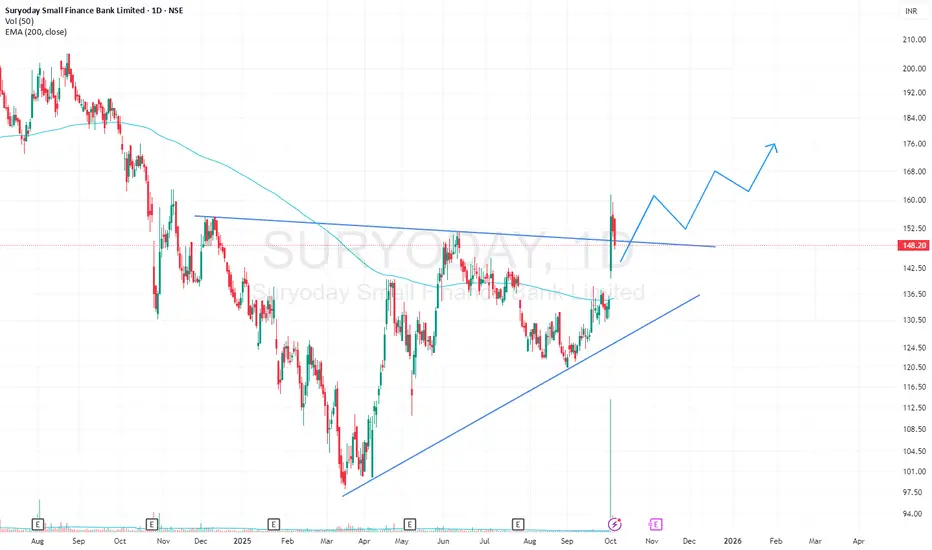
SURYODAY SFB Triangle BreakOutSuryoday SFB has given a breakout from a Triangle pattern with high volumes on 1D timeframe. The stock is apparently retesting its resistance trendline. The stock is also trading above its 200EMA.