Tata Steel Price Action Secrets |Backtesting Breakouts & SupportIn this video, I break down Tata Steel’s historical price action to understand its trading behavior. By backtesting past levels, we identify whether the stock respects support zones or follows breakout structures more reliably. This step-by-step analysis shows how to build your own tested data, spot recurring patterns, and improve decision-making in real trades.
Breakouttrading

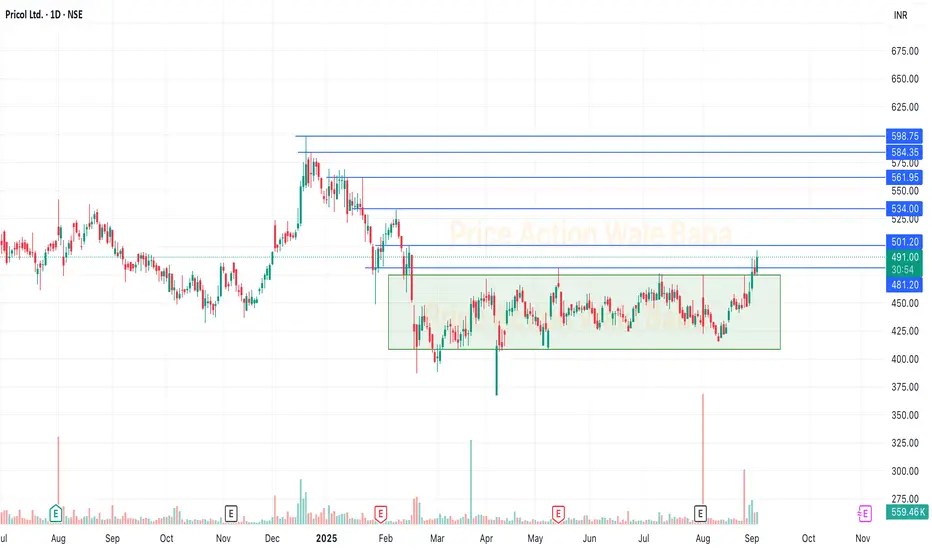
Pricol - Breakout from the Box.Pricol is looks good to buy and hold for the long term.
It has breakout from the box and ready to move up. Once it sustain above 500 than we can see the all target will hit one by one soon.
Target levels are market on the chart.
NMDC By KRS Charts9th June 2025 / 19:01
Why NMDC?
1. Dow Theory , it turned into Bullish Trend with Higher Highs & Higher lows.
2. Huge Accumulations since many Years and as I said above HHs & HLs.👆
3. In major timeframes stock is above 100EMA which is sign that more upside might possible.
4. Wave counts are picture perfect with more than 0.618 retracement for wave(2) and Reversed to upside from 0.5 Retracement between wave(2) & wave4 bottom points.
Targets & SL is mentioned in Chart.
NSE:NMDC NSE:CNXMETAL

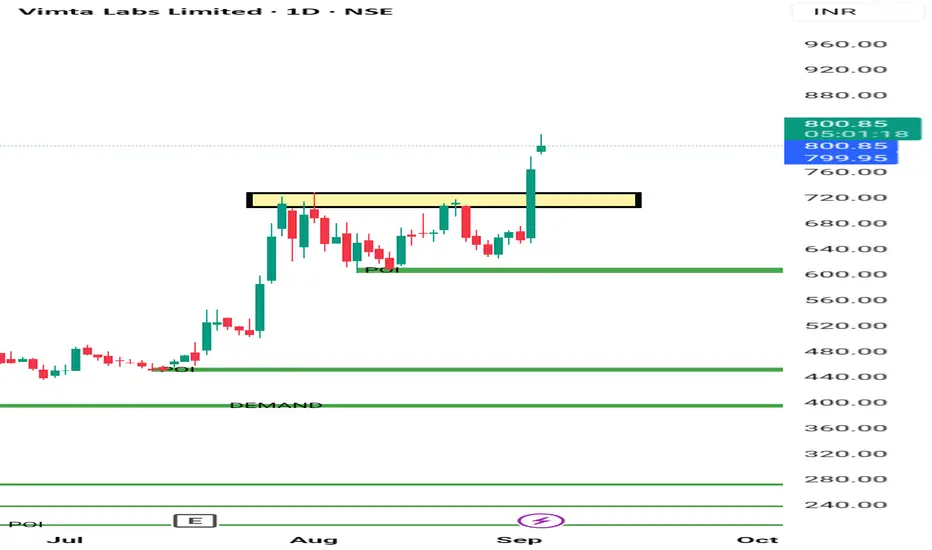
Vimta High Momentum & Breakout Stock As we can see in chart Vimta Lab is Bullish In Last some weeks . Its given clear breakout. It's moving in a parttern . It can move 5 -10% very fast In upcoming days. Keep SL near breakout levels near 710.
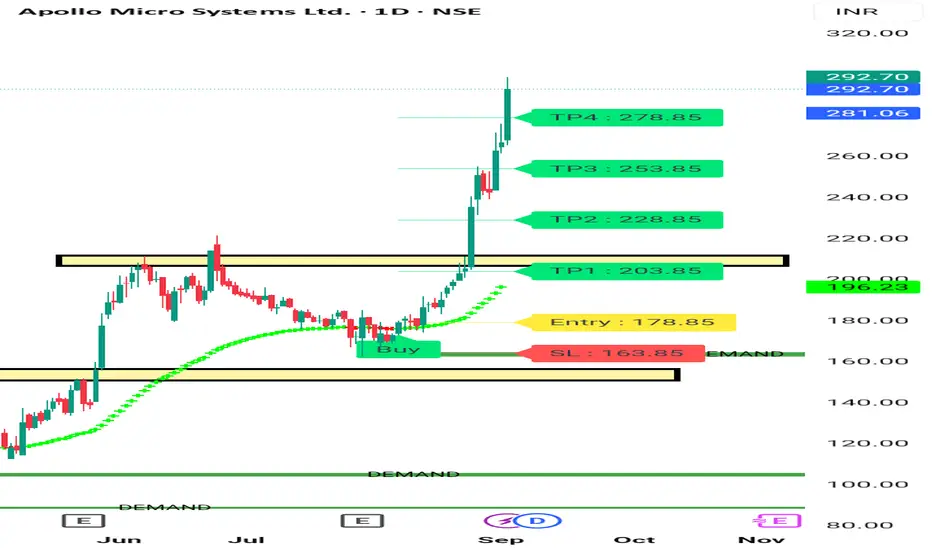
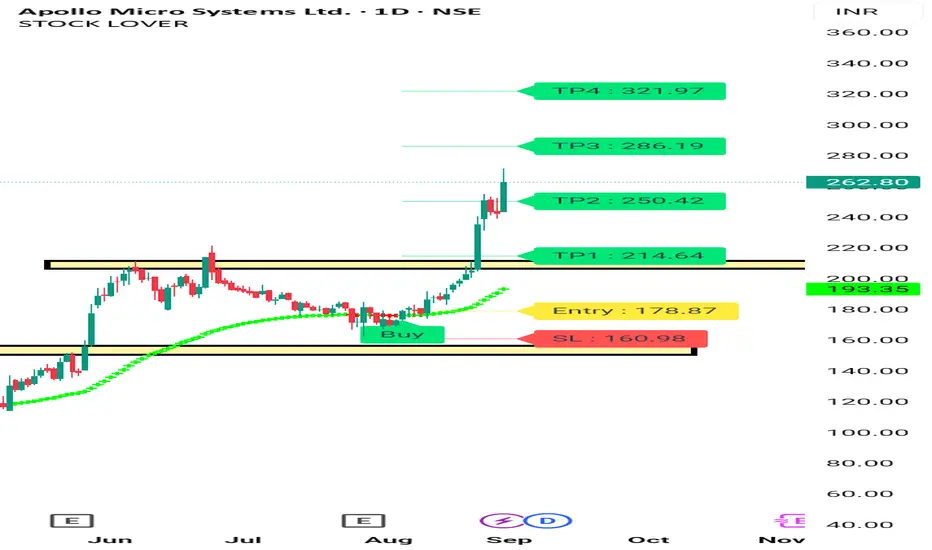
Apollo Micro Systems Movement APOLLO micro system given breakout near 210 .and I Shared The chart some days back also .now it's time to be cautious in this stock . No new entry . It's already given good returns. So no fucus on Some Other stock . Those Bought on lower levels they can trial SL.
Stock still can move upward but risk reward not good to enter now. Wait for retracement for 250 price .
No buy sell Reccomendation. Consult your financial advisor before making any position in stock. My views are for educational purposes only.
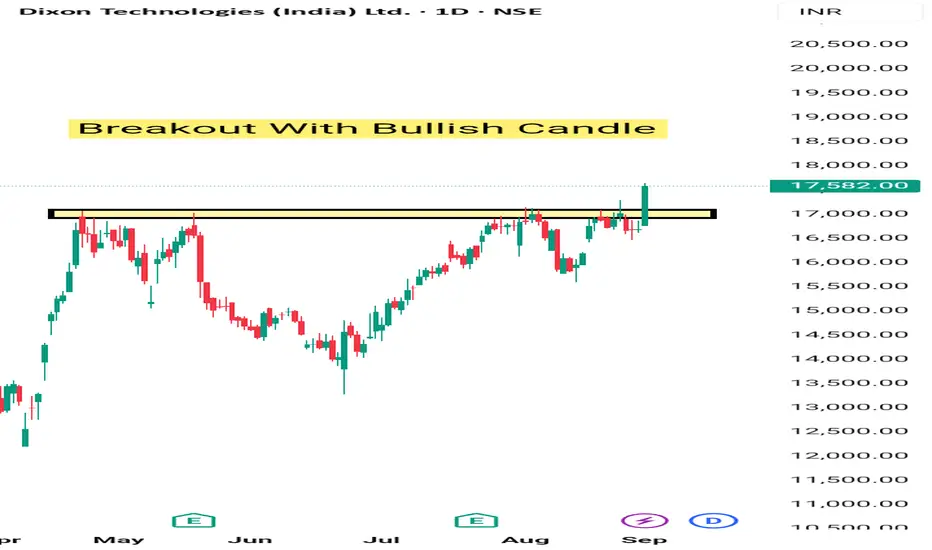
Dixon Breakout Tgt next 5-6%Dixon given breakout with high volume & made a clear breakout with bullish candle. It may give another 5 -6% Movement for swing trading . Stock is good for long term also . It's given breakout of rounding Bottom.
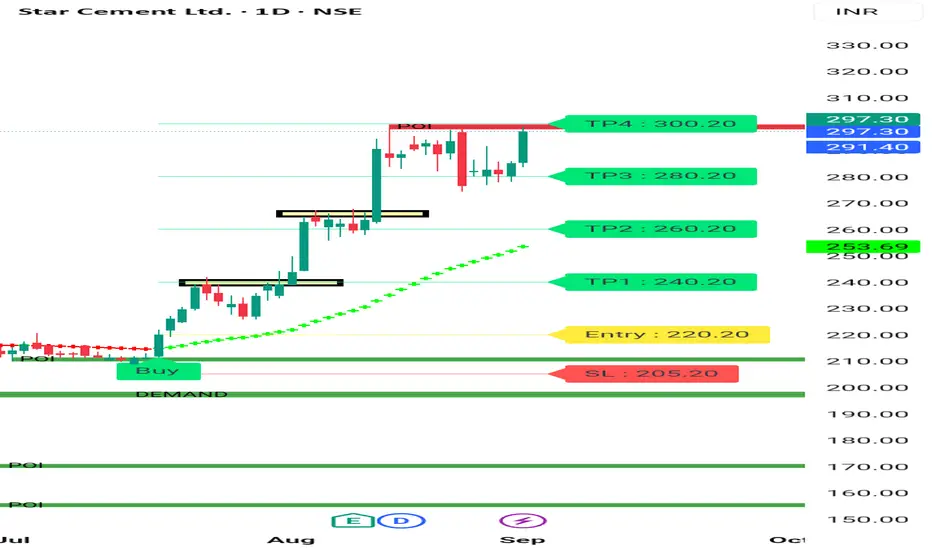
STAR CEMENT BREAKOUT/ Bullish Structure Star cement is good Stock fundamentally as well as Technicaly. It's moved from 220 to 297 . It's moving in a pattern you can see in chart . Now again it's at breakout level of its give movement above 300 then again 4 -5% move may give very fast . It's a high Momentum Stocks.
About company
Star Cements Ltd is engaged in manufacturing and selling of Cement Clinker & Cement. It sells its products across north-eastern and eastern states in India. It is the largest cement manufacturer in North-east India.
Key Points for star cement
Product Offerings
Ordinary portland cement (OPC), Portland Pozzolana cement(PPC), Anti-rust cement (ARC), Portland Composite Cement (PCC) and Weather Shield Cement (WSC)
Market Share
The company is the largest cement player in North-east India with ~24% market share. Star Cement has one of the finest limestone reserves.
Business-wise Sales
In Q1FY23, trade sales (sales to distributors & dealers) accounted for 86% of revenues while non-trade sales (sales to direct customers) accounted for the remaining 14% revenues.
Manufacturing Capabilities
Co. has 6 manufacturing facilities out of which 3 are situated in Meghalaya and 2 in Assam and 1 in West Bengal. The production capacities are as follows -
Clinker: 2.8 MTPA
Cement: 5.7 MTPA
Power: 51 MW & 12.3MW WHRS
The company plans to take cement capacity
to ~10MTPA by FY26.
Improvement in Capacity Utilization
The capacity utilization of the clinkerisation units was at ~86% during the FY22 as against ~75% during FY21.
Capex Plans
The company plans to expand:
A 3.3 MTPA clinker unit with 10 MW WHRS at
Lumshnong for ~Rs. 1,300 Cr.
B Two grinding units and 800 TPD AAC block
plant in Assam for ~Rs 950 Cr.
C 24 MW Captive solar power plant in
Guwahati, Assam for ~Rs 110 Cr.
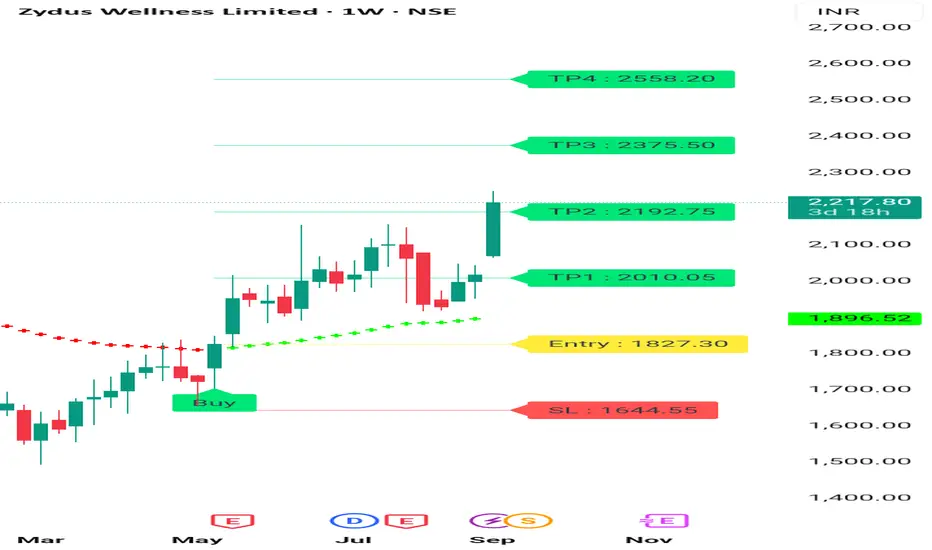
ZYDUS Wellness Weekly Chart Zydus wellness Given Good movement on Acquisition. Zydus wellness Given Weekly breakout, it's forming Rounding Pattern . Next tgt may be 2450 + 2500 in next 3 -6 months. Consult your financial advisor before making any position in this stock .
Paradeep HIGH MOMENTUM STOCKParadeep is in consolidation phase with low volume . its a high momentum stock . it may give breakout in coming days . so keep tracking it. ADD it in ur watchlist

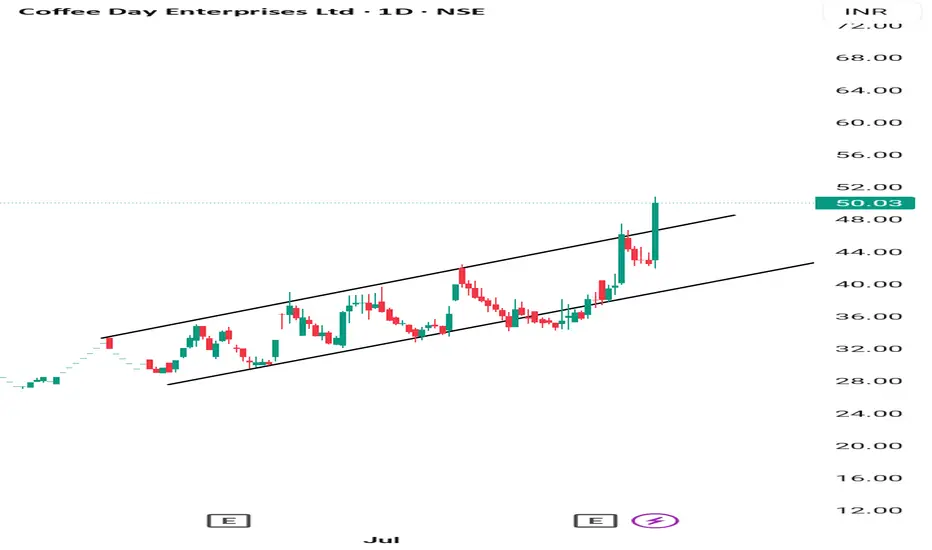
COFFEE DAY 1 DAY CHANNEL BREAKOUT Coffee Day Given Channel Breakout on 1 Day Chart . Coffee prices also increasing World wide bcoz of moonson. It's a good bet for next 10% 15%
APOLLO MICRO SYSTEM BULLISH CHART APOLLO micro system chart posted on tradingview on 24 Aug , it's moved 12% Since then. It's win a order . Chart Shows u movement before news . Keep Following Us and Enjoy. For More, watch my Profile.
Consult your financial advisor before making any position in stock market. My all views are for educational purposes only.
BUY TODAY SELL TOMORROW for 5%DON’T HAVE TIME TO MANAGE YOUR TRADES?
- Take BTST trades at 3:25 pm every day
- Try to exit by taking 4-7% profit of each trade
- SL can also be maintained as closing below the low of the breakout candle
Now, why do I prefer BTST over swing trades? The primary reason is that I have observed that 90% of the stocks give most of the movement in just 1-2 days and the rest of the time they either consolidate or fall
Trendline Breakout in ROHLTD
BUY TODAY SELL TOMORROW for 5%

BUY TODAY SELL TOMORROW for 5%DON’T HAVE TIME TO MANAGE YOUR TRADES?
- Take BTST trades at 3:25 pm every day
- Try to exit by taking 4-7% profit of each trade
- SL can also be maintained as closing below the low of the breakout candle
Now, why do I prefer BTST over swing trades? The primary reason is that I have observed that 90% of the stocks give most of the movement in just 1-2 days and the rest of the time they either consolidate or fall
Round Bottom Breakout in APOLLO
BUY TODAY SELL TOMORROW for 5%

BUY TODAY SELL TOMORROW for 5%DON’T HAVE TIME TO MANAGE YOUR TRADES?
- Take BTST trades at 3:25 pm every day
- Try to exit by taking 4-7% profit of each trade
- SL can also be maintained as closing below the low of the breakout candle
Now, why do I prefer BTST over swing trades? The primary reason is that I have observed that 90% of the stocks give most of the movement in just 1-2 days and the rest of the time they either consolidate or fall
Round Bottom Breakout in SEAMECLTD
BUY TODAY SELL TOMORROW for 5%

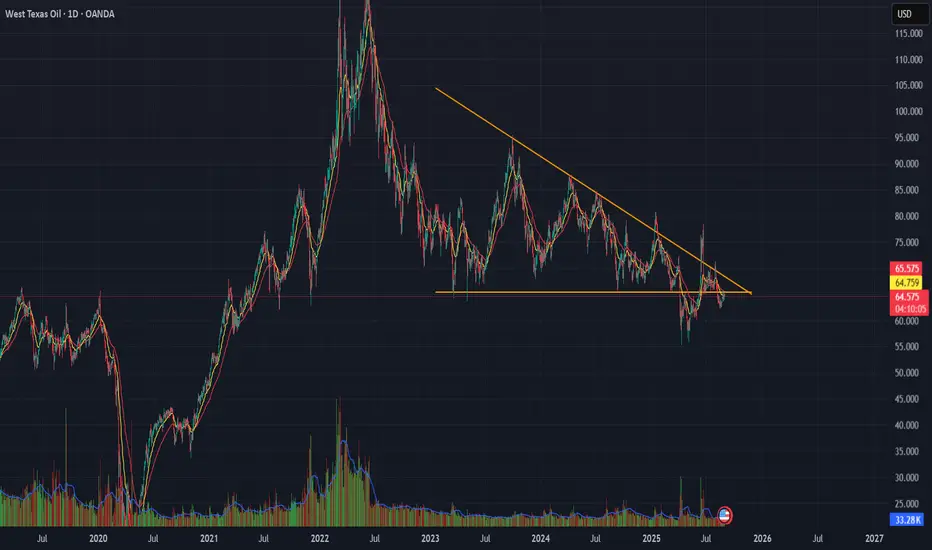
WTI Crude Oil Descending Triangle Pattern
WTI is forming a Descending Triangle pattern near recent support.
📊 Technicals : Flat base with lower highs compressing price action.
🔎 Key Levels: Breakdown below support 65 Leads To bearish continuation;
bounce above resistance 71 Leads To reversal setup.
⚠ Risk View: Energy fundamentals remain mixed — confirmation with volume is essential.
👉 Tactical takeaway: Wait for a breakout from the triangle before committing directionally.
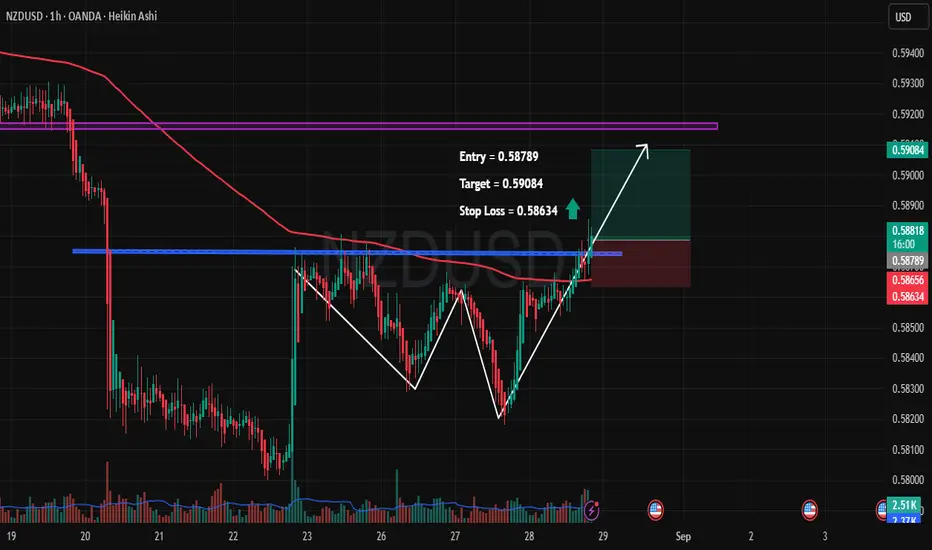
NZDUSD – Breakout Confirmation with Upside Potential🔹 Pair: NZDUSD (1H, Heikin Ashi)
🔹 Entry: 0.58789
🔹 Target: 0.59084 🎯
🔹 Stop Loss: 0.58634 🛑
🔑 Trade Rationale:
✅ Double Bottom Formation – Price respected key support twice, signaling potential reversal.
✅ Breakout Above Resistance – Clean breakout above horizontal resistance (blue line).
✅ 200 EMA Retest – Price is now pushing above the EMA, adding strength to the bullish case.
✅ Volume Spike – Recent surge in buying volume supports the upside move.
📊 Trade Plan:
I’m going long from 0.58789, looking for a quick move toward 0.59084. Risk is limited with a tight SL at 0.58634.
This setup offers a favorable R:R with a technical confluence of breakout + pattern confirmation.
⚠️ Disclaimer: This is not financial advice. Trade at your own risk. Always use proper risk management.
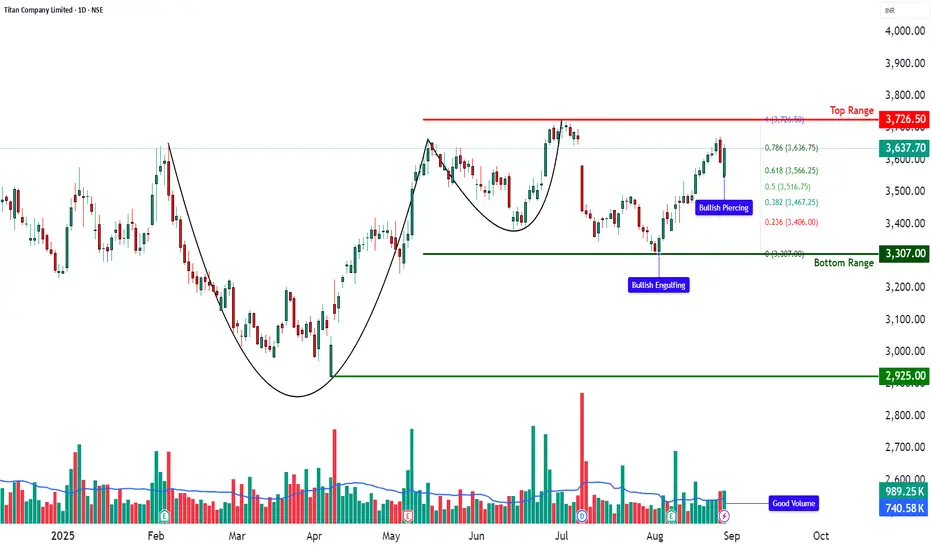
TITAN – Cup & Handle Breakout Retest📊 TITAN – Technical & Fundamental Educational Snapshot
Ticker: NSE: TITAN | Sector: Consumer – Lifestyle & Jewellery
CMP: ₹3,637.70
Rating: ⭐⭐⭐⭐ (Bullish Setup – For Educational Purposes Only)
Pattern Observed: ☕📈 Cup & Handle Breakout Retest
📊 Technical Observations
Titan Company Ltd. (CMP: ₹3,637.7) is presently exhibiting a Cup & Handle formation, with the price recently retesting the handle zone around ₹3,550–₹3,600 and showing signs of strength supported by healthy volumes. On the technical front, important resistance levels are noted around ₹3,675, ₹3,712, and ₹3,773, while support levels lie near ₹3,576, ₹3,515, and ₹3,477. Key indicators currently reflect positive momentum, with RSI around 65, MACD showing bullish signals on multiple timeframes, and CCI at 92, while the Stochastic indicator is in the higher zone (88–94), suggesting overbought but trending conditions. Volumes stood at ~989K, higher than the 20-day average of ~740K, indicating increased participation. Price action is also holding above VWAP, with Bollinger Band dynamics hinting at the possibility of trend continuation.
📰 Fundamental & News Flow
In its Q1 FY26 results, Titan Company Ltd. reported around 11% year-on-year revenue growth, primarily supported by sustained jewellery demand, although margins were modestly affected due to gold price volatility. The company continues to witness healthy traction in its Tanishq jewellery and Titan Eye+ businesses, alongside a recovery trend in watches and wearables. Titan has also been pursuing aggressive retail expansion, and the upcoming festive season is expected to support consumer demand further. From a structural perspective, the company is often highlighted for its premium brand positioning, robust balance sheet, and long-term jewellery demand drivers, which are considered key strengths in its sector.
📊 STWP Trade Analysis (Educational Purpose Only):
The recent price action indicates a Bullish Engulfing pattern followed by a Bullish Piercing formation, which are generally studied as signs of positive sentiment when supported by volumes. After the retest, a reference level around ₹3,726.50 may be noted, while the Bullish Piercing structure also highlights an observation zone near ₹3,650.90, with further upward reference levels around ₹3,752 and ₹3,854, and a protective support reference near ₹3,549. From a Fibonacci retracement perspective, a pullback level is visible near ₹3,566, with an invalidation reference around ₹3,516.
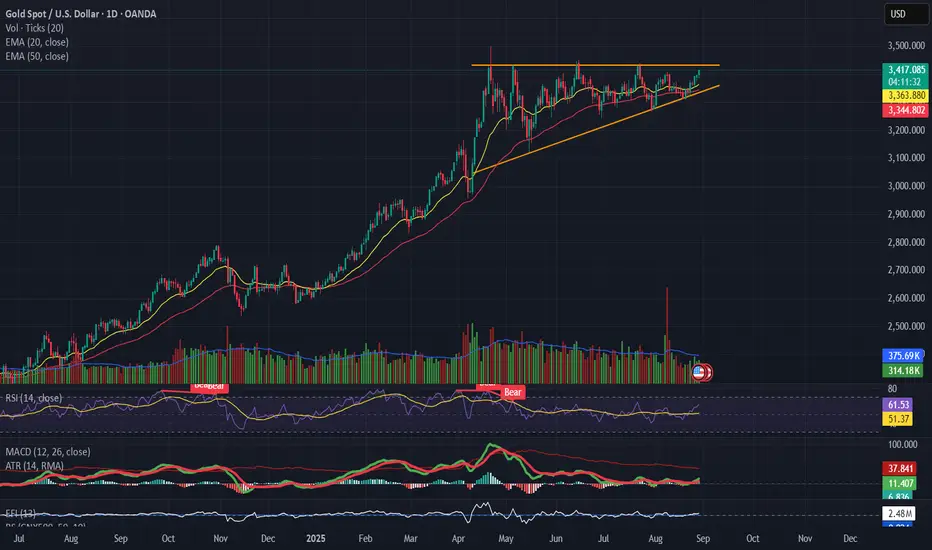
GOLD(XAUUSD) Forming a pennant / ascending triangle 📌 Gold (XAUUSD)
Forming a pennant / ascending triangle with strong resistance near $3,390 – 3,400.
Volume is declining, suggesting indecision.
RSI holding above 50 but not powering higher → momentum is slowing.
MACD flatlining, no fresh bullish impulse yet.
👉 Breakout above $3,400 needed for continuation. Breakdown below $3,340 risks correction.
BUY TODAY SELL TOMORROW for 5%DON’T HAVE TIME TO MANAGE YOUR TRADES?
- Take BTST trades at 3:25 pm every day
- Try to exit by taking 4-7% profit of each trade
- SL can also be maintained as closing below the low of the breakout candle
Now, why do I prefer BTST over swing trades? The primary reason is that I have observed that 90% of the stocks give most of the movement in just 1-2 days and the rest of the time they either consolidate or fall
Cup & Handle Breakout in VOEPL
BUY TODAY SELL TOMORROW for 5%

Waaree Energies Limited - Near BreakoutIncorporated in December 1990, Waaree Energies Limited is an Indian manufacturer of solar PV modules with an aggregate installed capacity of 12 GW. WEL has five solar module manufacturing facilities in India, with international presence.
Fundamentals:
Market Cap: ₹ 97,343 Cr.
Promoter holding: 64.3 %
FII holding: 2.68 %
DII holding: 2.86 %
Public holding: 30.2 %
Debt: ₹ 1,199 Cr.
Debt 3Years back: ₹ 363 Cr.
Stock looks good on long term holding. Above 3740, All time high breakout and can give more upside movement. Targets are in the chart.

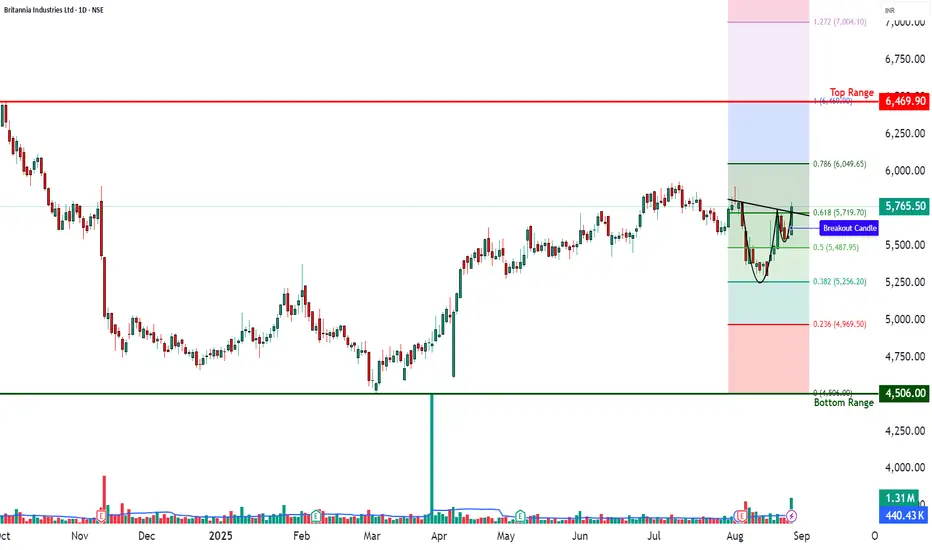
BRITANNIA - Cup & Handle Breakout Attempt📊 BRITANNIA – Technical & Fundamental Educational Snapshot
Ticker: NSE: BRITANNIA | Sector: FMCG – Packaged Foods & Biscuits
CMP: ₹5,765.50
Rating: ⭐⭐⭐⭐ (Bullish Setup – For Educational Purposes Only)
Pattern Observed: ☕📈 Cup & Handle Breakout Attempt
📊 Technical Observations
BRITANNIA (CMP: ₹5,765.5) is exhibiting a Cup & Handle breakout formation, confirmed by a strong bullish candle on heavy volumes. The stock has moved up from a recent bottom zone near ₹5,256–₹5,487 towards the neckline at ₹5,794, with key resistances placed at ₹5,848, ₹5,931, and ₹6,068, while supports are noted at ₹5,628, ₹5,491, and ₹5,408.
Technical indicators show RSI at 59 (breakout zone), a bullish MACD crossover, CCI at 76, and Stochastic at 94, highlighting strong upward momentum. The price action is supported by VWAP strength, and a Bollinger Band squeeze-off breakout, suggesting a possible trend continuation.
Volume surged to ~1.31M shares, significantly higher than the 20-day average of ~0.44M, indicating institutional participation. Based on the current momentum and technical structure, there is a strong possibility of breakout continuation; however, traders should carefully monitor the ₹5,628 and ₹5,518 levels as critical supports for risk management.
Britannia Industries has been in focus after analysts at PL Capital named it among their top stock picks, citing its strong positioning to benefit from India’s consumption revival. In its Q1 FY26 results, the company reported a consolidated net profit of ₹521 crore, up ~3% YoY, with revenues rising ~9% to ₹4,622 crore, though profitability fell short of street expectations due to higher input costs. Standalone performance was softer, with net profit down 0.8% YoY to ₹498 crore despite an 8.8% increase in revenue, reflecting margin pressure from raw material cost inflation. On the positive side, Britannia highlighted broad-based demand growth across both rural and urban markets and announced steps to boost the nutritional profile of its products by increasing whole grain content while reducing sugar and sodium, aligning with health-conscious consumer trends.
From a sentiment standpoint, the stock currently reflects a neutral to slightly positive bias. Bullish triggers include the ongoing consumption recovery, strong rural demand, analyst endorsements, product innovation, and sequential revenue growth. On the bearish side, rising input costs, weak standalone profitability, and rich valuations (P/E ~60) pose risks to near-term upside.
From an investment perspective, the outlook for Britannia remains mixed but constructive. On the bullish case, volume-led demand growth, health-focused innovation, and strong brand positioning could support further upside. On the bearish case, margin pressure and stretched valuations may limit near-term gains. In the short term (next few sessions), price action appears momentum-driven, supported by a bullish cup-and-handle breakout setup and strong institutional participation, making a continuation move possible in the next 1–2 days. Over the longer term (6–12 months), Britannia’s growth story remains intact provided cost pressures ease and the company sustains its demand momentum, aligning with PL Capital’s positive stance on the FMCG leader.
📊 STWP Trade Analysis – Under the STWP trade framework, one illustrative breakout scenario could involve a long entry near ₹5,794.50, with a protective stop at ₹5,518.40. In comparable past structures, price has tended to extend towards zones such as ₹5,848–₹5,880 (approx. 1:1 risk–reward), ₹5,931 (around 1:1.5 R:R), and ₹6,049–₹6,071 (approx. 1:2 R:R). If momentum accelerates, a stretch target may open towards ₹6,068 → ₹6,347.
An alternative, more conservative illustration could be a pullback entry in the ₹5,545–₹5,525 zone, with a tight invalidation stop at ₹5,518. A quick reaction pullback may also occur around the Fibonacci level of ₹5,719.70, before attempting a continuation higher. Upside zones remain aligned with the same resistance ladder (₹5,848–₹5,880 → ₹5,931 → ₹6,049–₹6,071 → ₹6,347).
Possible Demand Zone (Illustrative): ₹5,608.50 – ₹5,545
Stop Loss (tight): ₹5,537.90
Approximate Risk: ~₹70 per lot
⚠️ Risk Reminder:
Price momentum is strong but Stochastic readings are elevated, which may lead to volatility or shakeouts. Traders should trail stops actively (e.g., move SL to breakeven after T1, and under higher lows after T2). Market volatility, raw material cost changes, and broader FMCG index sentiment can influence outcomes. Past price behavior and backtests are illustrative only and do not guarantee future performance.
⚠️ Disclaimer – Please Read Carefully
The information shared here is meant purely for learning and awareness. It is not a buy or sell recommendation and should not be taken as investment advice. I am not a SEBI-registered investment advisor, and all views expressed are based on personal study, chart patterns, and publicly available market data.
Trading — whether in stocks or options — carries risk. Markets can move unexpectedly, and losses can sometimes exceed the money you have invested. Past performance or past setups do not guarantee future results.
If you are a beginner, treat this as a guide to understand how the market works — practice on paper trades before risking real money. If you are experienced, always assess your own risk, position sizing, and strategy suitability before entering trades.
Consult a SEBI-registered financial advisor before making any real trading decision. By engaging with this content, you acknowledge full responsibility for your trades and investments.
💬 Found this useful?
🔼 Give this post a Boost to help more traders discover clean, structured learning.
✍️ Drop your thoughts, questions, or setups in the comments — let’s grow together!
🔁 Share with fellow traders and beginners to spread awareness.
👉 “If you liked this breakdown, follow for more clean, structured setups with discipline at the core.”
🚀 Stay Calm. Stay Clean. Trade With Patience.
Trade Smart | Learn Zones | Be Self-Reliant 📊
BUY TODAY SELL TOMORROW for 5%DON’T HAVE TIME TO MANAGE YOUR TRADES?
- Take BTST trades at 3:25 pm every day
- Try to exit by taking 4-7% profit of each trade
- SL can also be maintained as closing below the low of the breakout candle
Now, why do I prefer BTST over swing trades? The primary reason is that I have observed that 90% of the stocks give most of the movement in just 1-2 days and the rest of the time they either consolidate or fall
Resistance Breakout in SUMMITS
BUY TODAY SELL TOMORROW for 5%

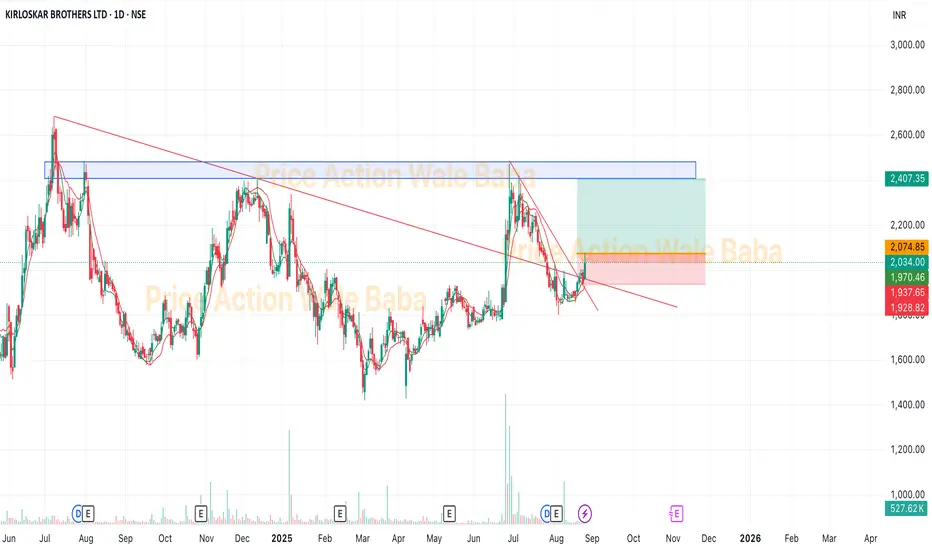
KIRLOSBROS - BreakoutKIRLOSBROS has a breakout and ready to move up.
Market Cap: ₹ 16,140 Cr.
Promoter holding: 66.0 %
FII holding: 6.27 %
DII holding" 9.79 %
Public holding: 18.0 %
Debt: ₹ 182 Cr.
Debt 3Years back: ₹ 396 Cr.
Company is fundamentally very strong. Also DII and FII buying this stock.
Good to buy and hold for the long term.
Soon we can see 2400.