Small Cap vs. Large Cap – Visualizing Risk Cycles & Rotation PoiWhat the Lines Tell Us:
1. Small Caps (Blue): Steeper rallies in bullish phases, sharper falls in corrections. Higher beta, higher reward, higher pain.
2. Large Caps (Red): More stable, smoother trends. Acts as a defensive harbor during market stress.
Now: The gap is wide again. Historically, this signals rising risk in small caps.
Correlation with the Ratio-Based Strategy:
- The Small-Cap / Large-Cap Ratio from my earlier post is essentially the vertical distance between these two lines.
- When the blue line runs far above the red (wide gap) → Ratio is high (>1.6) → Time to rotate to large caps.
- When the lines converge (gap narrows) → Ratio is low (<1.6) → Time to enter small caps.
Current Implication:
The gap is historically wide (similar to 2008, 2018 highs). This aligns with the ratio signal, reinforcing the move toward large-cap ETFs/index funds for capital preservation. Small caps will again shine—after the gap closes.
Takeaway:
You don’t need complex indicators. Sometimes, just watching these two lines and their separation tells you when to rotate—capture small-cap upside, hide in large-cap safety.
BSE

BSE - STWP Equity Snapshot________________________________________
STWP Equity Snapshot – BSE Ltd
(Educational | Chart-Based Interpretation)
📌 Intraday Reference Levels (Structure-based)
Reference Price Zone: 2,800
Risk Reference (If price weakens): 2,609
Observed Upside Zones: 3,028 → 3,181
________________________________________
📌 Swing Reference Levels (Hybrid Model | 2–5 days | Observational)
Reference Price Zone: 2,800
Risk Reference (If support breaks): 2,514
Higher Range Zones (If strength continues): 3,372 → 3,801
________________________________________
🔑 Key Levels – Daily Timeframe
Support Areas: 2,717 | 2,643 | 2,602
Resistance Areas: 2,832 | 2,873 | 2,947
These levels explain where price has previously reacted and where it may pause, reverse, or accelerate again.
________________________________________
🔺 STWP Chart Pattern Analysis
Stock: BSE Ltd
Pattern: Symmetrical Triangle
Stage: Late formation (Mature)
⏱ Structure Timing Insight
Duration: Around 203 days
Maturity: Overextended
The pattern has taken a long time to form, which lowers the quality of a quick breakout.
________________________________________
📌 Why price is behaving this way
Price has been moving between lower highs and higher lows
Buyers and sellers are both active, but neither side is in control
Long compression usually shows confusion, not strong fresh buying
This explains why price moves up, pauses, and then reacts again.
________________________________________
📐 Projection Logic (Educational)
Upside projection is based on the full height of the triangle
Downside projection is equally possible due to neutral structure
Mature patterns often give false moves, so patience is important
________________________________________
🎯 Pattern Targets & Invalidation
Upside Projection: 3,349
Downside Projection: 2,180
Pattern Invalidation: Clear move beyond the opposite boundary
________________________________________
🔍 STWP Market Read
BSE Ltd has shown strong upward movement after a long period of sideways action.
However, because the pattern is old and stretched, price must hold above support zones to keep strength intact.
Strength is visible — but confirmation matters more than excitement here.
________________________________________
📊 Chart Structure & Indicator Summary
Structure: Mature triangle, partial resolution
Trend: Up
Momentum: Strong but controlled
RSI: Around 58 – healthy
Volume: High – active participation
________________________________________
📈 Final Outlook (Condition-Based)
Momentum: Strong
Trend: Up
Risk: High (due to mature structure)
Volume: High
________________________________________
💡 STWP Learning Note
Not every strong move needs chasing.
The market rewards those who wait for clarity and manage risk, not those who rush.
________________________________________
⚠️ Disclaimer
This post is shared only for educational and informational purposes. It is not investment advice or a recommendation. Please consult a SEBI-registered financial advisor before making any trading or investment decision.
________________________________________
📘 STWP Approach
Observe price. Respect risk.
Let structure guide decisions — not emotions.
🚀 Stay Calm. Stay Clean. Trade With Patience.
💬 Did this snapshot help you read the chart better?
🔼 Boost to support structured learning
✍️ Share your views in comments
🔁 Forward to someone learning price action
👉 Follow for clean, beginner-friendly STWP insights
🚀 Stay Calm. Stay Clean. Trade With Patience.
Trade Smart | Learn Zones | Be Self-Reliant 📊
________________________________________

BSE cmp 2790.60 by Daily Chart viewBSE cmp 2790.60 by Daily Chart view
- Support Zone 2570 to 2670 Price Band
- Resistance Zone 2790 to 2915 Price Band
- Bullish "W" Double Bottom by Support Zone base
- Rising Support Trendline well sustained and respected
- Falling Resistance Zone Trendline Breakout been attempted
- Volumes spiked today with good sync with the avg traded qty

BSE LTD Intraday 22 Dec 2025— +80 Points Bull Setup (BTR)HURRY! Another high-probability intraday trade completed successfully in BSE LTD.
No complexity. No overthinking. Only one rule — Follow BTR Indicator.
🔍 Trade Snapshot
• Stock: BSE LTD
• Date: 22/12/2025
• Timeframe: Intraday
• Indicator Used: BTR Indicator ONLY
🟢 Trade Execution
✔ BTR Indicator generated a clear BUY signal
✔ Entry provided exactly at 2700
✔ Strong bullish momentum followed immediately
🟢 BUY ENTRY: 2700
🎯 Exit Discipline
📌 Follow the system — not emotions
📌 Exit planned and executed as per BTR logic
🔴 INTRADAY EXIT: 2780
📈 TOTAL PROFIT: +80 POINTS
🧠 Strategy Rule (Very Important)
❌ No extra indicators
❌ No noise
❌ No prediction
✅ Only BTR Indicator
✅ Follow the signal
✅ Book profit when system says EXIT
🧠 Strategy Rule (Very Important)
❌ No extra indicators
❌ No noise
❌ No prediction
✅ Only BTR Indicator
✅ Follow the signal
✅ Book profit when system says EXIT
📊 Follow for more high-accuracy intraday setups
💬 Comment if you want to trade using BTR Indicator

BSE Ltd –19 Dec 2025-Intraday Bearish Setup | 15 Points CapturedMarket Structure Insight
After an initial upside move, price failed to sustain above the key Fibonacci retracement zone (0.5–0.618). This area acted as a strong supply zone, clearly visible on the chart.
🔔 BTR Indicator Signal
BTR generated a clear Bearish Signal inside the supply zone
Multiple rejection candles confirmed seller dominance
Momentum shifted from bullish retracement to bearish continuation
🧭 Trade Plan
Short Entry: Near Fib 0.618 rejection zone, BTR Generate Short Signal at 2700
Stop Loss: Above supply zone high
Target: Demand zone / previous low
Exit: Near 2685 as price entered demand zone
✅ Result: +15 Points Intraday Gain
📌 Why This Setup Worked
✔ Fibonacci retracement confluence
✔ BTR bearish confirmation
✔ Lower high formation
✔ Strong demand zone for clean exit
✔ Disciplined risk management

BSE Intraday Trade — 18 Dec 2025BTR Bullish Setup + Fibonacci Precision | +30 Points Booked
Once again, BTR Indicator delivered a clean bullish intraday opportunity in BSE Ltd, proving the strength of rule-based trading over emotions.
This trade was further refined using Fibonacci Retracement, which helped in defining clear entry confidence, precise stop-loss, and a high-probability exit zone.
🔍 Trade Details
• Stock: BSE Ltd
• Timeframe: 15-Minute
• Setup Type: Bullish (BTR Confirmed)
• Market Condition: Pullback into Demand Zone
🟢 Entry Logic
✔ BTR generated a bullish signal inside a strong demand zone
✔ Price respected 0.5 – 0.618 Fibonacci retracement
✔ Strong bullish candle confirmed buyer presence
🟢 Buy Entry: Near 2670 zone
🎯 Exit & Target Planning
📌 Fibonacci Extension Used for Exit
• 1.618 Fib Level acted as a high-probability exit zone
• Price reacted immediately from this level
🔴 Exit Booked Near: 2700 zone
📈 Net Gain: +30 Points (Intraday)
🧠 Why This Setup Worked
✔ BTR provided directional clarity
✔ Fibonacci gave structure for SL & Exit
✔ Demand zone ensured low-risk entry
✔ System-based exit avoided overtrading
📌 Key Takeaway
Profitable trading is not about prediction.
It’s about alignment:
Signal + Structure + Risk Control
BTR does exactly that — again and again.
📊 Follow for daily intraday trade ideas
💬 DM for BTR Indicator & complete trading rules
Trade what you see. Exit where the system tells you. Stay disciplined. 🔥📈
#BSE #NIFTY #INTRADAY #BULISH #BUY #BSESTOCK #BSEINDIALTD

#Smallcap Downtrend Deepens!#BSE #Smallcap Index broke its key support this week, confirming a clear LH & LL structure. Trend is weakening.
⬇️ Price now likely heading toward the next support zones drawn on the chart. Expect more volatility in the coming weeks.
⚠️ Weak, speculative, or overvalued smallcaps may drop harder.
💎 Quality names with decent valuations may hold up better.
📊 A deeper correction could set up the next strong accumulation phase once the market finds stability.
🟡 Strong buying interest likely near the yellow trendline if price reaches that zone — a major long-term support.
📈 Bullish only if…
• Price breaks above the red falling trendline
• That breakout would invalidate the downtrend & revive momentum 🚀
#Smallcaps #BSE #Investing #Corrections #PriceAction #TrendAnalysis
📌 #Disclaimer: This analysis is shared for educational purposes only. It is not a buy/sell recommendation. Please do your own research before making any trading decisions.

Sensex INDEXSensex is in bearish trend
We can see strong RESISTANCE in between 84,800 & 85,000 range. If SENSEX breaksdown 84,800 level we can expect sensex at 84,600 and further down side till 83,100 level
Strong support regions are at 84,900, 84,500, and 83,950.
After reaching 84,600 we can expect retracement till 84,900 and if resistance was not taken then only it can move till 84,000 level
This is just my analysis to best of my knowledge

BSE Looing good for Long callsBSE broke the Trend channel of almost 4months, looking good to take long call at around 2268 with stoploss at 1950 for the target at around 2800.
-- This is only for educational purpose, please do your own analysis before taking a call so you have confidence to hold the trade.

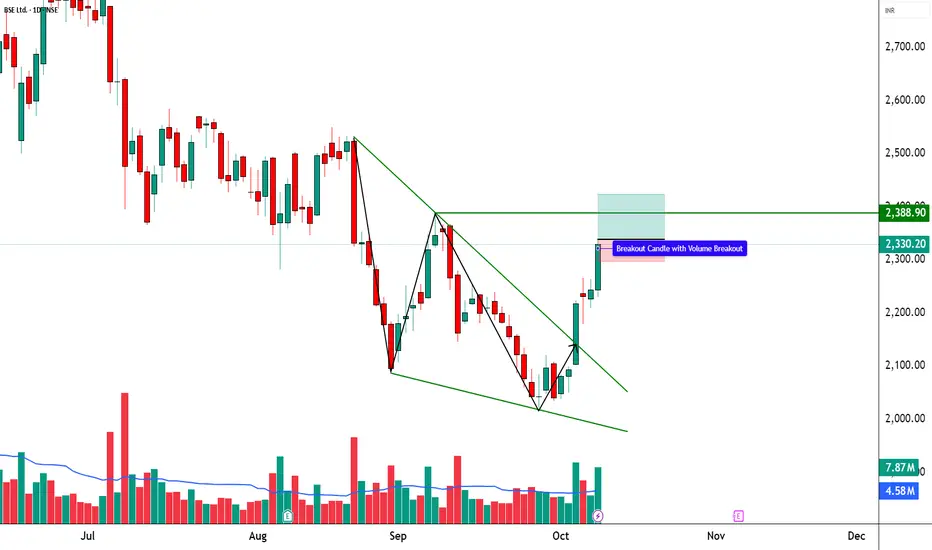
Rising Wedge Formation | Bullish Engulfing💹 BSE Ltd (NSE: BSE)
Sector: Financial Services | CMP: ₹2,678.30 | View: Rising Wedge + Bullish Exhaustion Setup
📊 Price Action:
BSE Ltd witnessed a powerful uptrend from ₹2,020 to ₹2,718, supported by heavy institutional participation and strong price momentum.
The stock recently posted a 20-day volume breakout, followed by a bullish engulfing candle, signaling strong buying strength at lower levels.
However, post this rally, the price structure has developed into a Rising Wedge pattern, indicating momentum exhaustion and potential short-term consolidation.
The recent rejection near ₹3,030 swing high suggests supply pressure building at upper resistance zones, aligning with the wedge’s narrowing structure.
💼 HNI Trade Levels (STWP Setup):
Aggressive Entry: ₹2,678–₹2,718 | Stop Loss: ₹2,425
Low-Risk Entry: ₹2,595 | Stop Loss: ₹2,415
The near-term trend remains upward but stretched.
HNI and swing traders should monitor the ₹2,595–₹2,650 zone closely — this area represents both the 61.8% Fibonacci retracement and the wedge support base.
Sustaining above it will keep the setup active; a breakdown below ₹2,595 could shift the structure into a corrective phase.
📉 Chart Pattern Analysis – Rising Wedge (Bearish Reversal Bias):
The current structure represents a Rising Wedge formation, identified by two upward-sloping, converging trendlines.
This pattern often develops after strong rallies, marking the final leg of an existing uptrend before a corrective phase begins.
In BSE’s case, the wedge indicates that buying momentum is weakening as the range tightens, while volumes remain high — a sign of profit booking within strength.
The confirmation trigger for reversal would be a breakdown below ₹2,595. Until then, the structure remains short-term bullish but with an elevated risk of pullback.
A breakdown could potentially extend retracement toward ₹2,525–₹2,450.
📈 STWP Trading Analysis:
Entry: ₹2,678–₹2,718 | Stop Loss: ₹2,425.50
The breakout candle displayed exceptional strength with a 20.3M volume surge against a 5.65M average, confirming institutional footprints and momentum expansion.
The price is currently sustaining above its short- and mid-term EMAs, with trend alignment visible across the daily and weekly timeframes.
Holding above ₹2,644–₹2,595 (critical Fibonacci and structural zone) will maintain the bullish bias, keeping the setup active toward ₹2,783–₹2,888 in the near term.
A sustained close above ₹2,888 could further extend the move toward ₹3,030, whereas a breakdown below ₹2,595 may trigger pattern invalidation and shift bias toward ₹2,525–₹2,450 support zones.
📈 Candlestick Pattern – Bullish Engulfing at Apex:
A Bullish Engulfing Candle formed on 4 Nov 2025, initiating the final upward leg from ₹2,443 to ₹2,718.
While it reflected strong buying enthusiasm, the placement of this candle near the apex of the wedge signals possible buyer exhaustion.
Such engulfing candles late in a trend often act as final thrust candles, marking distribution zones rather than breakout initiation.
This makes it essential for traders to track whether follow-up candles sustain strength or fade under resistance.
📏 Fibonacci Analysis:
From swing low ₹2,021.50 to swing high ₹3,030.0:
61.8% retracement @ ₹2,644 → Key structural support.
50% retracement @ ₹2,525 → Ideal pullback level.
38.2% retracement @ ₹2,406 → Deeper retracement aligned with wedge base.
The stock currently trades near the 61.8% golden zone, making ₹2,595–₹2,644 a crucial area for short-term trend control.
A close below this range may invite a deeper retracement, while sustained strength above ₹2,678 could revive momentum toward ₹2,888–₹3,030.
🧭 STWP Support & Resistance:
Resistances: ₹2,783 | ₹2,888 | ₹3,059
Supports: ₹2,595 | ₹2,525 | ₹2,406
The ₹2,980–₹3,020 range acts as a weak resistance zone, where mild profit booking or supply pressure may emerge if momentum continues upward.
On the downside, the ₹2,020–₹2,070 belt continues to serve as a strong structural support zone, backed by historical accumulation and institutional demand footprints.
📊 STWP Volume & Technical Setup:
Today’s volume stood at 20.3M shares vs 5.65M average, signaling heavy institutional activity and potential position rotation post-breakout.
RSI remains elevated near 69, while Stochastic (90) suggests short-term overbought conditions — hinting at a likely consolidation phase ahead.
MACD continues to stay in the bullish zone but shows flattening momentum, consistent with the wedge’s tightening structure.
Trend Direction: UPTREND (Weakening) | Volume Confirmation: High with Distribution Bias
🧩 STWP Summary View:
Final Outlook:
Momentum: Strong | Trend: Bullish | Risk: High | Volume: High
BSE Ltd remains structurally bullish but technically stretched after a steep rally and volume breakout. The Rising Wedge formation, combined with the Bullish Engulfing near the top, reflects a maturing uptrend with signs of short-term exhaustion. Holding above ₹2,595 keeps the pattern valid, but traders should remain cautious of volatility and potential profit booking as the structure nears completion.
⚠️ Disclosure & Disclaimer – Please Read Carefully
This post is created solely for educational and informational purposes and should not be interpreted as investment advice or a buy/sell recommendation.
I am not a SEBI-registered investment adviser. All views are based on technical analysis and publicly available market data.
Trading involves significant risk. Always apply risk management, follow position sizing discipline, and consult a SEBI-registered financial advisor before acting on any trade.
Position Status: No active position in (BSE) at the time of this analysis.
Data Source: TradingView & NSE India
💬 Found this useful?
🔼 Give this post a Boost to help more traders discover structured, professional analysis.
💭 Drop your insights — will BSE’s wedge resolve in continuation or correction?
🔁 Share this with your trading circle to promote disciplined chart-based analysis.
👉 Follow for more institutional-style breakdowns blending price action, structure, and volume logic.
🚀 Stay Calm. Stay Clean. Trade With Patience.
Trade Smart | Learn Zones | Be Self-Reliant 📊

Glance Finance Expected UpsideGlance Finance is moving in uptrend with slow consolidation. I see consolidation is Broken is previous week opening. Now can expect upside rally in short term. Can move close to 500, 550....
Please do your own research too and take decision.

Tamilnad Mercantile Bank – 1D Chart | Strong Resistance Zone🟢 Tamilnad Mercantile Bank (TMB) – 1D Chart | Strong Resistance Zone Ahead
📊 Chart Setup:
TMB is testing its major 1-year resistance zone around ₹510, a key level that has capped price movements for months. A strong daily close above ₹510 could trigger momentum towards higher targets.
🔹 Resistance: ₹510 (Major 1-year resistance)
🔹 Targets on Breakout: ₹535 / ₹600
🔹 Supports: ₹466 / ₹440
🔹 View: Price consolidating near breakout zone. Sustained close above ₹510 can signal trend continuation.
🏦 Fundamental Update – Q2 FY26 Results Highlights:
Tamilnad Mercantile Bank delivered steady performance with profit growth and improved asset quality.
• Net Profit: ₹318 Cr ↑ (▲4.95% YoY)
• Total Business: ↑11.40%
• Deposits: ₹55,421 Cr ↑12.32%
• Advances: ↑10.5%
• Net Interest Income: ₹597 Cr ↑0.17%
• Gross NPA: ↓ to 1.01%
• Net NPA: ↓ to 0.26%
• Capital Adequacy Ratio (CAR): Strong at 30.96%
➡️ Stable performance, improving asset quality, and strong capital base add confidence to the technical setup.
📈 For educational purpose only. Not a buy/sell recommendation.

BSE | Intraday Bullish Setup📈 **BSE LTD | Bullish Breakout + SuperTrend Flip 🚀**
STWP Trade Analysis
🔹 **Entry Zone:** ₹2,328 – ₹2,334
🔹 **Stop Loss:** ₹2,296 (Risk ~₹32)
🔹 **Supports:** 2,305 / 2,265 / 2,232
🔹 **Resistances:** 2,388 / 2,423 / 2,450
🔑 **Key Highlights**
✅ Strong Bullish Candle — Breakout above consolidation with volume surge
✅ RSI & BB Expansion — Momentum revival confirmation
✅ SuperTrend Flip — Short-term trend turns bullish
✅ BB Squeeze-Off → Fresh volatility expansion underway
💡 **Learning Note**
This setup highlights how **volume-backed breakouts** aligned with **SuperTrend and RSI confirmation** provide high-probability entries. When volatility expands after a squeeze and price clears resistance with momentum, it often signals **institutional breakout strength** and **early trend continuation**.
⚠️ Disclosure & Disclaimer – Please Read Carefully
The information shared here is meant purely for learning and awareness.
It is not a buy or sell recommendation and should not be taken as investment advice.
I am not a SEBI-registered investment adviser, and all views expressed are based on personal study, chart patterns, and publicly available market data.
Position Status: No active position in BSE at the time of analysis.
Data Source: TradingView & NSE India (Past Chart Reference) (Historical levels)
Trading — whether in stocks or options — carries risk. Markets can move unexpectedly, and losses can sometimes exceed the capital you have invested.
Past performance or setups do not guarantee future results.
If you are a beginner, treat this as a learning example and practice with paper trades before risking real money.
If you are experienced, always assess your own risk, position sizing, and strategy suitability before entering trades.
Consult a SEBI-registered financial adviser before making any real trading decision.
By engaging with this content, you acknowledge full responsibility for your trades and investments.
________________________________________
💬 Found this useful?
🔼 Give this post a Boost to help more traders discover structured learning.
✍️ Drop your thoughts, questions, or setups in the comments — let’s grow together!
🔁 Share with fellow traders and beginners to spread awareness.
👉 “If you liked this breakdown, follow for more clean, structured setups with discipline at the core.”
🚀 Stay Calm. Stay Clean. Trade With Patience.
Trade Smart | Learn Zones | Be Self-Reliant 📊
#SENSEX | Cup & Handle Breakout Loading?CMP: 82,600
A classic Cup & Handle pattern is forming on the weekly chart of SENSEX , signaling a potential continuation of the long-term uptrend. A breakout above the neckline could trigger a fresh rally.
Pattern: Cup & Handle (Bullish Continuation)
Breakout Confirmation: Weekly close above handle neckline
Pattern Target: +15% upside → ~96,500
Invalidation: Weekly close below 79,741
📌 Key Zones:
Resistances: 84,059 – 84,100 / 85,978 (All-Time High)
Supports: 82,133 / 81,307 / 80,426
⚠️ Watch for a strong weekly close above the neckline to confirm breakout.
📌 Disclaimer: This analysis is shared for educational purposes only. It is not a buy/sell recommendation. Please do your own research before making any trading decisions.
#SENSEX | #BSE | #CupAndHandle | #ChartPattern | #PriceAction

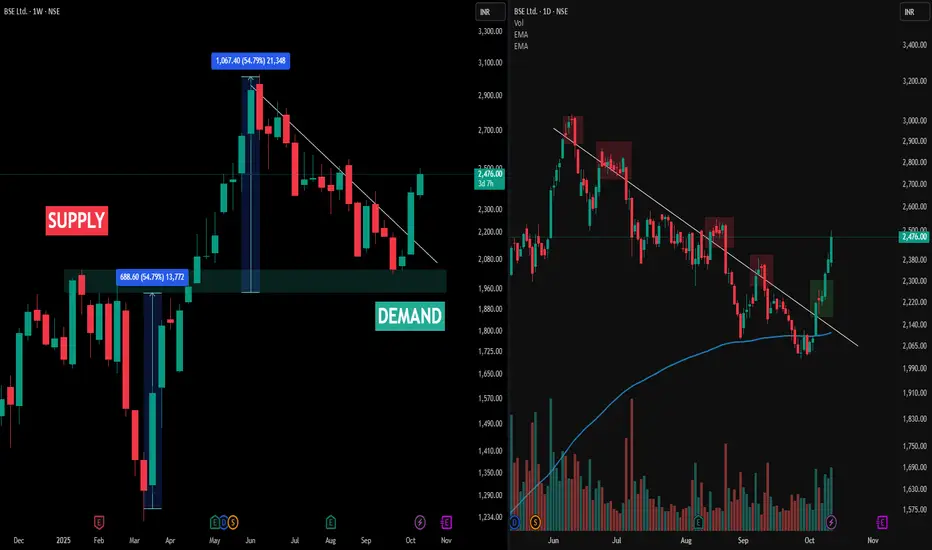
Multi-Timeframe Observation: BSE Ltd• The image above presents a multi-timeframe view of BSE Ltd (NSE), with the left side displaying the Weekly Timeframe (WTF) chart and the right side showing the Daily Timeframe (DTF) chart. The weekly chart highlights the main demand and supply zones, with large upward moves originating from demand and visible percentage swings marked for clarity.
• A key observation is the Change of Trend (CT) line. On the weekly chart (left), price action repeatedly challenged but never closed above the CT, indicating resistance at this structural level. This is confirmed on the daily chart (right), where each significant upward move into the CT region is marked by red boxes—showing failed attempts to sustain above the CT and repeated rejections.
• The green box on the daily chart points to a recent bounce from demand, but the price still faces resistance at the CT as per the weekly structure. Consistent volume activity and price response across both timeframes offer a crystal clear illustration of trend dynamics and supply-demand interplay. The post is strictly an analytical observation of price structure, not a prediction or recommendation.
Disclaimer
This post is intended for observational and educational purposes only. It does not constitute financial advice or recommend any trading action. Please consult a certified financial advisor and conduct your own research before making investment decisions.
BSE Ltd break out.BSE Ltd breaking out of the falling trend.
Bullish divergence on RSI
RSI Breakout post few months.

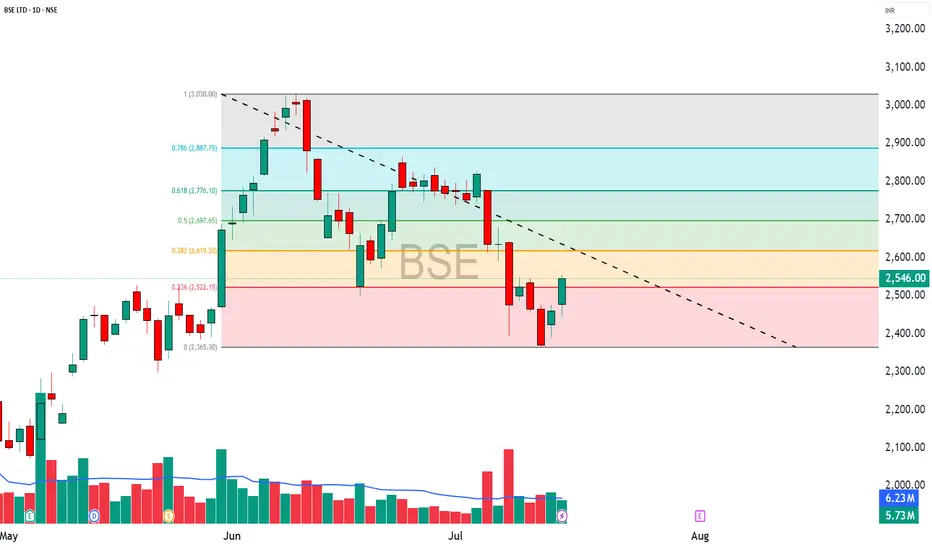
BSE : LongThe price action shows a strong rally followed by a period of decline and consolidation.
Key horizontal support and resistance levels are marked, with the current price near the support zone, suggesting buyers are actively defending this area.
The descending trendline indicates a consistent pattern of lower highs, reflecting ongoing selling pressure.
Below, the MACD indicator reveals a recent attempt at bullish crossover, signaling potential upward momentum, but confirmation is awaited.
This setup is useful for monitoring possible trend reversals or continued weakness, and members are encouraged to note these patterns while making informed decisions.

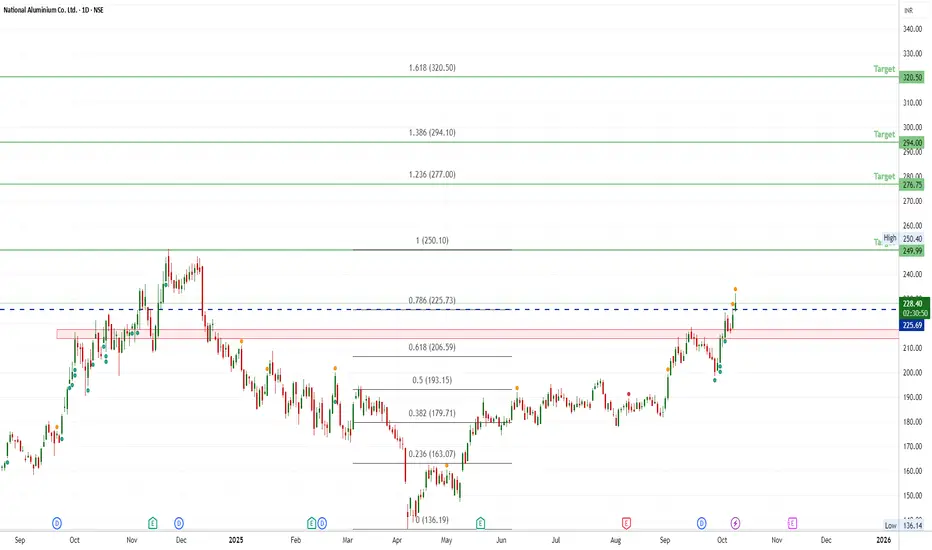
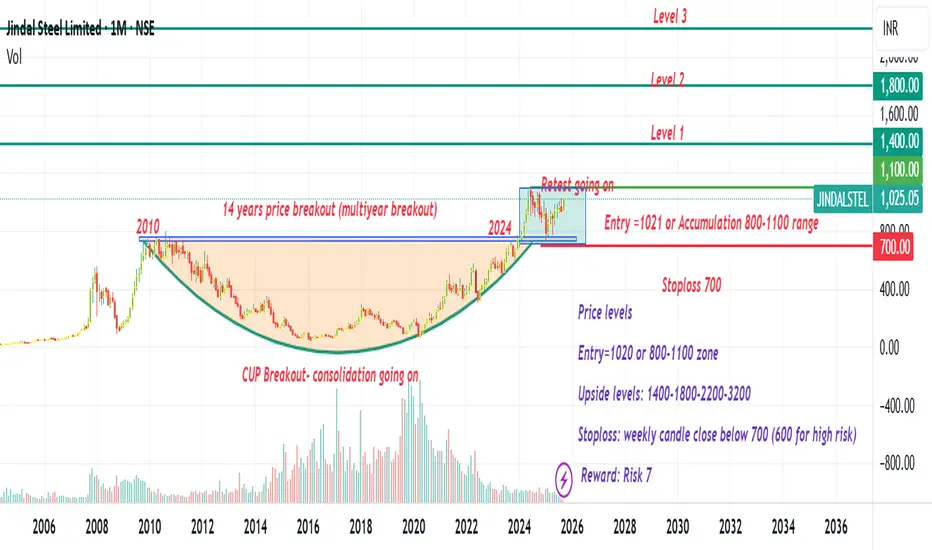
Jindal Steel multiyear price breakout #Nifty #JINDALSTELPrice is breaking out after 14 years, showing a multi-year price breakout.
Maybe a a Good chance for a Multi-bagger return
Entry: Current price or 800-1100 range
Stoploss: monthly or weekly close below 700
Upside levels: 1100-1400-1800-2200-3200
Analysis just for a learning point of view
Not a recommendation
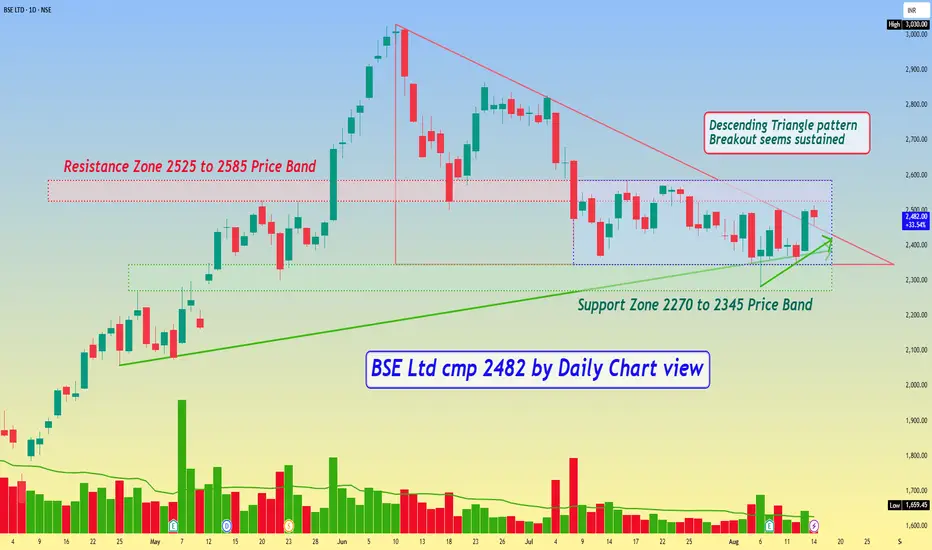
BSE Ltd cmp 2482 by Daily Chart viewBSE Ltd cmp 2482 by Daily Chart view
- Support Zone 2270 to 2345 Price Band
- Resistance Zone 2525 to 2585 Price Band
- Descending Triangle pattern Breakout seems sustained
- Stock seems trading within price range indicating Darvas Box setup
- Volumes seen gradually syncing closely with the average traded quantity
- Most known Technical Indicators BB, EMA, MACD, RSI, SAR seem trending positively
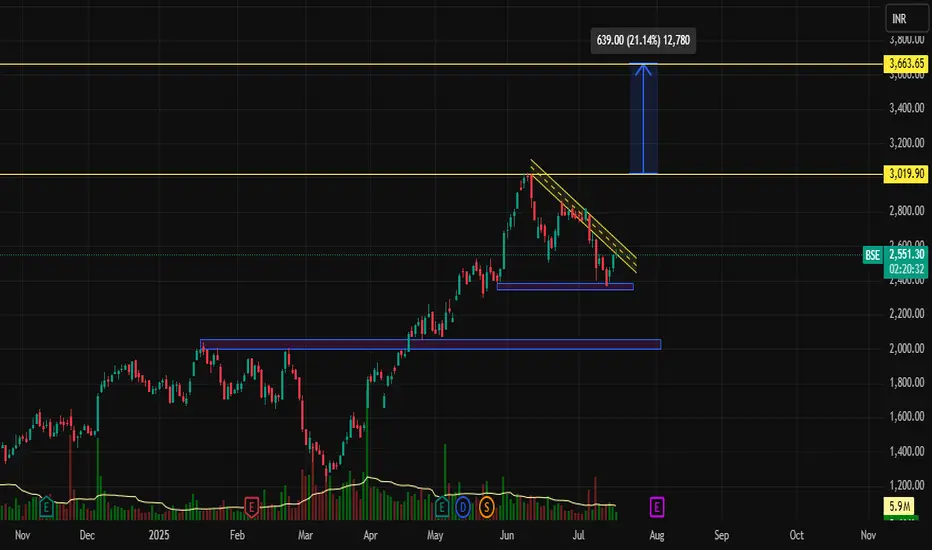
BSE | Falling Wedge Breakout Imminent? Potential Upside of 21%Stock: BSE (Bombay Stock Exchange)
Timeframe: Daily (1D)
Current Price: ₹2,547.90
Potential Upside: ₹639 (+21.14%)
Resistance Levels: ₹3,019.90, ₹3,663.65
Support Zones: ₹2,370 | ₹2,110
📌 Technical Analysis
1. Falling Wedge Formation (Bullish Reversal Pattern)
BSE is currently trading within a well-defined falling wedge pattern, a classic bullish reversal structure. The stock has been consolidating after a strong uptrend and is approaching the apex of the wedge, indicating a possible breakout.
Downward Sloping Resistance Line is being tested.
The support zone around ₹2,370 has held strong multiple times, creating a solid base.
2. Volume Analysis
Noticeably declining volume during the wedge formation signals a healthy consolidation phase.
A spike in volume on breakout would confirm strong buying momentum.
🔍 Breakout Target Projection
If BSE breaks out from the wedge resistance, the measured move suggests a potential upside of ₹639, bringing the target around:
📍 Target: ₹3,180–3,340 range
📍 Long-Term Resistance: ₹3,663.65 (next major hurdle)
🧠 Strategy Suggestion
Type Entry stop loss entry
Swing Trade ₹2,600–2,650 (after breakout confirmation) ₹2,370 ₹3,019 / ₹3,340 / ₹3,663
Note: Wait for daily candle close above the falling wedge with above-average volume for confirmation.
⚠️ Key Observations
🔹 Bullish momentum from previous uptrend still intact.
🔹 Price respecting demand zone at ₹2,370.
🔹 RSI near neutral – enough room for an upside.
🔹 Ideal breakout zone: Between ₹2,600–2,650
📅 Conclusion
BSE is showing a promising setup with a falling wedge pattern supported by strong demand zones. A successful breakout could lead to a 20%+ rally. Keep this stock on your radar as it nears a potential trend reversal.
📌 Disclaimer: This is not investment advice. Do your own research or consult with a financial advisor before investing.
Options Strategy Breakdown – For Educational Purpose Only________________________________________
📈 Options Strategy Breakdown – For Educational Purpose Only
🧠 Learn to Structure a Bull Call Spread Strategically
________________________________________
🔹 Stock Name: BSE
🔹 Spot Price: ₹2546
🔹 Lot Size: 375
🔹 Number of Lots: 1
🔹 Expiry Date: 31-July-2025
🕒 DTE (Days to Expiry): 16 Days
💡 Strategy Type: Bull Call Spread – Limited Risk | Limited Reward Option Structure
________________________________________
📘 Strategy Construction (Illustrative Example):
1️⃣ Buy Call Option – Strike: ₹2500 | Premium Paid: ₹125
2️⃣ Sell Call Option – Strike: ₹2600 | Premium Received: ₹76
🧮 Net Premium Outflow: ₹49
(₹125 - ₹76 = ₹49 * 375 = ₹18,375)
________________________________________
📊 Payoff Metrics (Illustrative & Hypothetical):
• 🔹 Breakeven Point: ₹2549.00
• 📈 Maximum Profit: ₹19,125 (When Spot ≥ ₹2600)
• ⚠️ Maximum Loss (Capital Deployed): ₹18,375 (if Spot ≤ ₹2500)
• 🔄 Real-Time PnL: Subject to market movement
• 🎯 Suggested Profit Booking Threshold: ₹18,375 (illustrative target)
• 🛑 Reversal Exit Point (Invalidation): Spot < ₹2487.75 (Support Violation)
________________________________________
📌 Why Learn This Strategy?
The Bull Call Spread is a risk-defined options strategy designed for moderately bullish views. It reduces premium cost compared to naked options and has a clearly capped loss and reward, making it suitable for learning proper risk management in derivatives trading.
________________________________________
🔍 Key Educational Takeaways:
• Helps manage premium exposure in trending markets
• Builds awareness of breakeven levels and invalidation points
• Encourages use of defined-risk structures over naked positions
• Promotes discipline and technical level-based exits
________________________________________
⚠️ Educational Disclaimer:
📢 This post is intended purely for educational and informational purposes only and does not constitute investment advice, recommendation, or solicitation to trade.
I am not a SEBI-registered investment advisor. All data shared above is illustrative and should not be considered as buy/sell advice.
Trading in derivatives involves risk. Please consult a SEBI-registered advisor before taking any financial decisions.
📘 Past performance or setup structure does not guarantee future results.
Always do your own research and use strict risk management.
________________________________________
💬 Want more educational breakdowns like this?
Drop a comment or message!
🔁 Share this with fellow learners to help them build structured option strategies.
✅ Follow @simpletradewithpatience for charts, clean setups, and educational content based on price action, zones, and risk-managed trades.
________________________________________
BSE – Strong Call Writing | Tested Supply Zone in Play________________________________________________________________________________
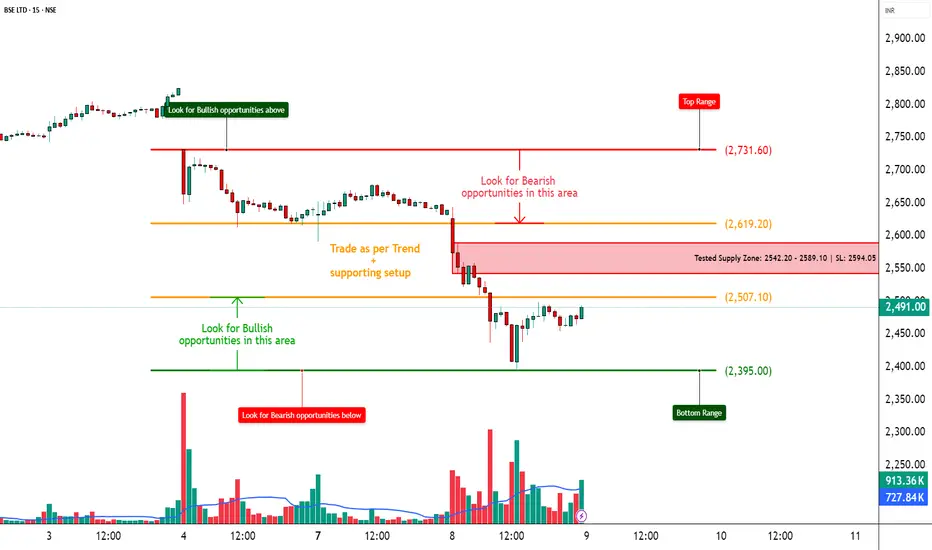
📈 BSE – Strong Call Writing Below 2600 | Tested Supply Zone in Play
🕒 Chart: 15-Min
📆 July 8, 2025
________________________________________________________________________________
🔍 What’s Catching Our Eye:
Massive Call writing seen from ₹2400 to ₹2900, clearly indicating resistance at higher levels.
________________________________________________________________________________📌 What We’re Watching For:
Price is facing selling near the ₹2542–₹2589 supply zone; a rejection here can drag it toward ₹2395 or below.
________________________________________________________________________________📌 OI Inference:
CEs are heavily sold across all levels – especially 2600, 2500, 2700, and 2400 CE.
Strong Put buying from 2400 down to 2000 PE → Market participants are expecting downside.
________________________________________________________________________________🔁 Trend Bias:
🔴 Bearish to Range-Bound – unless price breaks above ₹2594.05 with volume and CE unwinding.
________________________________________________________________________________🧠 Trade Logic / Reasoning:
• 12+ Call Strikes under Short Build-Up = strong ceiling
• Long Build-Up in deep Puts (2500, 2400, 2300, even 2000)
• Tested supply zone between ₹2542–₹2589 = rejection likely
• PE IVs rising = fear building up, especially below 2500
________________________________________________________________________________📍 Important Levels to Mark:
🔺 Top Range (Resistance): ₹2731.6
🔻 Bottom Range (Support): ₹2395
🟢 Demand Zone: NA
🔴 Supply Zone: ₹2542.20 – ₹2589.10 | SL: ₹2594.05(Tested Zone)
________________________________________________________________________________🎯 Trade Plan (Educational Purpose Only):
✅ Sell (Equity): Near ₹2542–₹2589 if price rejects the supply zone
✅ Buy (Equity): Only above ₹2594.05 with strong volume
✅ Best Put to Buy: ₹2500 PE or ₹2400 PE on breakdown
❌ Avoid Call Buying: All Calls are under heavy selling
📌 Strategy Idea (Low Risk):
Bear Put Spread – Buy 2500 PE, Sell 2400 PE
→ Profitable if stock drops, risk stays limited
________________________________________________________________________________⚠️ Invalidation Levels:
🔺 Above ₹2594.05 = bearish setup may fail
🔻 Below ₹2395 = confirms breakdown and trend continuation
________________________________________________________________________________
⚠️ Disclaimer:
This post is for educational purposes only.
STWP is not a SEBI-registered advisor.
No buy/sell recommendations are made.
Please consult your financial advisor before trading.
STWP is not responsible for any trading decisions based on this content.
________________________________________________________________________________
💬 Will BSE break supply and fly, or get rejected again?
⬇️ Share your view in the comments!
🔁 Repost this if you're watching BSE
✅ Follow STWP for clean Options + Price Action insights
🚀 Let’s trade with clarity and confidence!
________________________________________________________________________________