BSE LTD Intraday 22 Dec 2025— +80 Points Bull Setup (BTR)HURRY! Another high-probability intraday trade completed successfully in BSE LTD.
No complexity. No overthinking. Only one rule — Follow BTR Indicator.
🔍 Trade Snapshot
• Stock: BSE LTD
• Date: 22/12/2025
• Timeframe: Intraday
• Indicator Used: BTR Indicator ONLY
🟢 Trade Execution
✔ BTR Indicator generated a clear BUY signal
✔ Entry provided exactly at 2700
✔ Strong bullish momentum followed immediately
🟢 BUY ENTRY: 2700
🎯 Exit Discipline
📌 Follow the system — not emotions
📌 Exit planned and executed as per BTR logic
🔴 INTRADAY EXIT: 2780
📈 TOTAL PROFIT: +80 POINTS
🧠 Strategy Rule (Very Important)
❌ No extra indicators
❌ No noise
❌ No prediction
✅ Only BTR Indicator
✅ Follow the signal
✅ Book profit when system says EXIT
🧠 Strategy Rule (Very Important)
❌ No extra indicators
❌ No noise
❌ No prediction
✅ Only BTR Indicator
✅ Follow the signal
✅ Book profit when system says EXIT
📊 Follow for more high-accuracy intraday setups
💬 Comment if you want to trade using BTR Indicator
Bseanalysis

BSE Intraday Trade — 18 Dec 2025BTR Bullish Setup + Fibonacci Precision | +30 Points Booked
Once again, BTR Indicator delivered a clean bullish intraday opportunity in BSE Ltd, proving the strength of rule-based trading over emotions.
This trade was further refined using Fibonacci Retracement, which helped in defining clear entry confidence, precise stop-loss, and a high-probability exit zone.
🔍 Trade Details
• Stock: BSE Ltd
• Timeframe: 15-Minute
• Setup Type: Bullish (BTR Confirmed)
• Market Condition: Pullback into Demand Zone
🟢 Entry Logic
✔ BTR generated a bullish signal inside a strong demand zone
✔ Price respected 0.5 – 0.618 Fibonacci retracement
✔ Strong bullish candle confirmed buyer presence
🟢 Buy Entry: Near 2670 zone
🎯 Exit & Target Planning
📌 Fibonacci Extension Used for Exit
• 1.618 Fib Level acted as a high-probability exit zone
• Price reacted immediately from this level
🔴 Exit Booked Near: 2700 zone
📈 Net Gain: +30 Points (Intraday)
🧠 Why This Setup Worked
✔ BTR provided directional clarity
✔ Fibonacci gave structure for SL & Exit
✔ Demand zone ensured low-risk entry
✔ System-based exit avoided overtrading
📌 Key Takeaway
Profitable trading is not about prediction.
It’s about alignment:
Signal + Structure + Risk Control
BTR does exactly that — again and again.
📊 Follow for daily intraday trade ideas
💬 DM for BTR Indicator & complete trading rules
Trade what you see. Exit where the system tells you. Stay disciplined. 🔥📈
#BSE #NIFTY #INTRADAY #BULISH #BUY #BSESTOCK #BSEINDIALTD

Rising Wedge Formation | Bullish Engulfing💹 BSE Ltd (NSE: BSE)
Sector: Financial Services | CMP: ₹2,678.30 | View: Rising Wedge + Bullish Exhaustion Setup
📊 Price Action:
BSE Ltd witnessed a powerful uptrend from ₹2,020 to ₹2,718, supported by heavy institutional participation and strong price momentum.
The stock recently posted a 20-day volume breakout, followed by a bullish engulfing candle, signaling strong buying strength at lower levels.
However, post this rally, the price structure has developed into a Rising Wedge pattern, indicating momentum exhaustion and potential short-term consolidation.
The recent rejection near ₹3,030 swing high suggests supply pressure building at upper resistance zones, aligning with the wedge’s narrowing structure.
💼 HNI Trade Levels (STWP Setup):
Aggressive Entry: ₹2,678–₹2,718 | Stop Loss: ₹2,425
Low-Risk Entry: ₹2,595 | Stop Loss: ₹2,415
The near-term trend remains upward but stretched.
HNI and swing traders should monitor the ₹2,595–₹2,650 zone closely — this area represents both the 61.8% Fibonacci retracement and the wedge support base.
Sustaining above it will keep the setup active; a breakdown below ₹2,595 could shift the structure into a corrective phase.
📉 Chart Pattern Analysis – Rising Wedge (Bearish Reversal Bias):
The current structure represents a Rising Wedge formation, identified by two upward-sloping, converging trendlines.
This pattern often develops after strong rallies, marking the final leg of an existing uptrend before a corrective phase begins.
In BSE’s case, the wedge indicates that buying momentum is weakening as the range tightens, while volumes remain high — a sign of profit booking within strength.
The confirmation trigger for reversal would be a breakdown below ₹2,595. Until then, the structure remains short-term bullish but with an elevated risk of pullback.
A breakdown could potentially extend retracement toward ₹2,525–₹2,450.
📈 STWP Trading Analysis:
Entry: ₹2,678–₹2,718 | Stop Loss: ₹2,425.50
The breakout candle displayed exceptional strength with a 20.3M volume surge against a 5.65M average, confirming institutional footprints and momentum expansion.
The price is currently sustaining above its short- and mid-term EMAs, with trend alignment visible across the daily and weekly timeframes.
Holding above ₹2,644–₹2,595 (critical Fibonacci and structural zone) will maintain the bullish bias, keeping the setup active toward ₹2,783–₹2,888 in the near term.
A sustained close above ₹2,888 could further extend the move toward ₹3,030, whereas a breakdown below ₹2,595 may trigger pattern invalidation and shift bias toward ₹2,525–₹2,450 support zones.
📈 Candlestick Pattern – Bullish Engulfing at Apex:
A Bullish Engulfing Candle formed on 4 Nov 2025, initiating the final upward leg from ₹2,443 to ₹2,718.
While it reflected strong buying enthusiasm, the placement of this candle near the apex of the wedge signals possible buyer exhaustion.
Such engulfing candles late in a trend often act as final thrust candles, marking distribution zones rather than breakout initiation.
This makes it essential for traders to track whether follow-up candles sustain strength or fade under resistance.
📏 Fibonacci Analysis:
From swing low ₹2,021.50 to swing high ₹3,030.0:
61.8% retracement @ ₹2,644 → Key structural support.
50% retracement @ ₹2,525 → Ideal pullback level.
38.2% retracement @ ₹2,406 → Deeper retracement aligned with wedge base.
The stock currently trades near the 61.8% golden zone, making ₹2,595–₹2,644 a crucial area for short-term trend control.
A close below this range may invite a deeper retracement, while sustained strength above ₹2,678 could revive momentum toward ₹2,888–₹3,030.
🧭 STWP Support & Resistance:
Resistances: ₹2,783 | ₹2,888 | ₹3,059
Supports: ₹2,595 | ₹2,525 | ₹2,406
The ₹2,980–₹3,020 range acts as a weak resistance zone, where mild profit booking or supply pressure may emerge if momentum continues upward.
On the downside, the ₹2,020–₹2,070 belt continues to serve as a strong structural support zone, backed by historical accumulation and institutional demand footprints.
📊 STWP Volume & Technical Setup:
Today’s volume stood at 20.3M shares vs 5.65M average, signaling heavy institutional activity and potential position rotation post-breakout.
RSI remains elevated near 69, while Stochastic (90) suggests short-term overbought conditions — hinting at a likely consolidation phase ahead.
MACD continues to stay in the bullish zone but shows flattening momentum, consistent with the wedge’s tightening structure.
Trend Direction: UPTREND (Weakening) | Volume Confirmation: High with Distribution Bias
🧩 STWP Summary View:
Final Outlook:
Momentum: Strong | Trend: Bullish | Risk: High | Volume: High
BSE Ltd remains structurally bullish but technically stretched after a steep rally and volume breakout. The Rising Wedge formation, combined with the Bullish Engulfing near the top, reflects a maturing uptrend with signs of short-term exhaustion. Holding above ₹2,595 keeps the pattern valid, but traders should remain cautious of volatility and potential profit booking as the structure nears completion.
⚠️ Disclosure & Disclaimer – Please Read Carefully
This post is created solely for educational and informational purposes and should not be interpreted as investment advice or a buy/sell recommendation.
I am not a SEBI-registered investment adviser. All views are based on technical analysis and publicly available market data.
Trading involves significant risk. Always apply risk management, follow position sizing discipline, and consult a SEBI-registered financial advisor before acting on any trade.
Position Status: No active position in (BSE) at the time of this analysis.
Data Source: TradingView & NSE India
💬 Found this useful?
🔼 Give this post a Boost to help more traders discover structured, professional analysis.
💭 Drop your insights — will BSE’s wedge resolve in continuation or correction?
🔁 Share this with your trading circle to promote disciplined chart-based analysis.
👉 Follow for more institutional-style breakdowns blending price action, structure, and volume logic.
🚀 Stay Calm. Stay Clean. Trade With Patience.
Trade Smart | Learn Zones | Be Self-Reliant 📊

BSE – Strong Call Writing | Tested Supply Zone in Play________________________________________________________________________________
📈 BSE – Strong Call Writing Below 2600 | Tested Supply Zone in Play
🕒 Chart: 15-Min
📆 July 8, 2025
________________________________________________________________________________
🔍 What’s Catching Our Eye:
Massive Call writing seen from ₹2400 to ₹2900, clearly indicating resistance at higher levels.
________________________________________________________________________________📌 What We’re Watching For:
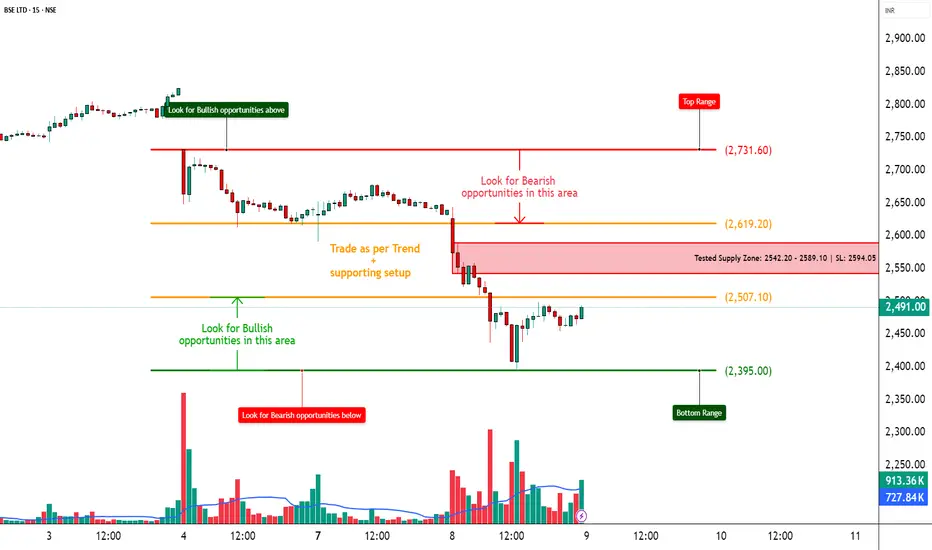
Price is facing selling near the ₹2542–₹2589 supply zone; a rejection here can drag it toward ₹2395 or below.
________________________________________________________________________________📌 OI Inference:
CEs are heavily sold across all levels – especially 2600, 2500, 2700, and 2400 CE.
Strong Put buying from 2400 down to 2000 PE → Market participants are expecting downside.
________________________________________________________________________________🔁 Trend Bias:
🔴 Bearish to Range-Bound – unless price breaks above ₹2594.05 with volume and CE unwinding.
________________________________________________________________________________🧠 Trade Logic / Reasoning:
• 12+ Call Strikes under Short Build-Up = strong ceiling
• Long Build-Up in deep Puts (2500, 2400, 2300, even 2000)
• Tested supply zone between ₹2542–₹2589 = rejection likely
• PE IVs rising = fear building up, especially below 2500
________________________________________________________________________________📍 Important Levels to Mark:
🔺 Top Range (Resistance): ₹2731.6
🔻 Bottom Range (Support): ₹2395
🟢 Demand Zone: NA
🔴 Supply Zone: ₹2542.20 – ₹2589.10 | SL: ₹2594.05(Tested Zone)
________________________________________________________________________________🎯 Trade Plan (Educational Purpose Only):
✅ Sell (Equity): Near ₹2542–₹2589 if price rejects the supply zone
✅ Buy (Equity): Only above ₹2594.05 with strong volume
✅ Best Put to Buy: ₹2500 PE or ₹2400 PE on breakdown
❌ Avoid Call Buying: All Calls are under heavy selling
📌 Strategy Idea (Low Risk):
Bear Put Spread – Buy 2500 PE, Sell 2400 PE
→ Profitable if stock drops, risk stays limited
________________________________________________________________________________⚠️ Invalidation Levels:
🔺 Above ₹2594.05 = bearish setup may fail
🔻 Below ₹2395 = confirms breakdown and trend continuation
________________________________________________________________________________
⚠️ Disclaimer:
This post is for educational purposes only.
STWP is not a SEBI-registered advisor.
No buy/sell recommendations are made.
Please consult your financial advisor before trading.
STWP is not responsible for any trading decisions based on this content.
________________________________________________________________________________
💬 Will BSE break supply and fly, or get rejected again?
⬇️ Share your view in the comments!
🔁 Repost this if you're watching BSE
✅ Follow STWP for clean Options + Price Action insights
🚀 Let’s trade with clarity and confidence!
________________________________________________________________________________
BSE - Support Break with Bullish Recovery SetupSymbol: BSE (Bombay Stock Exchange)
Timeframe: Daily
Key Levels:
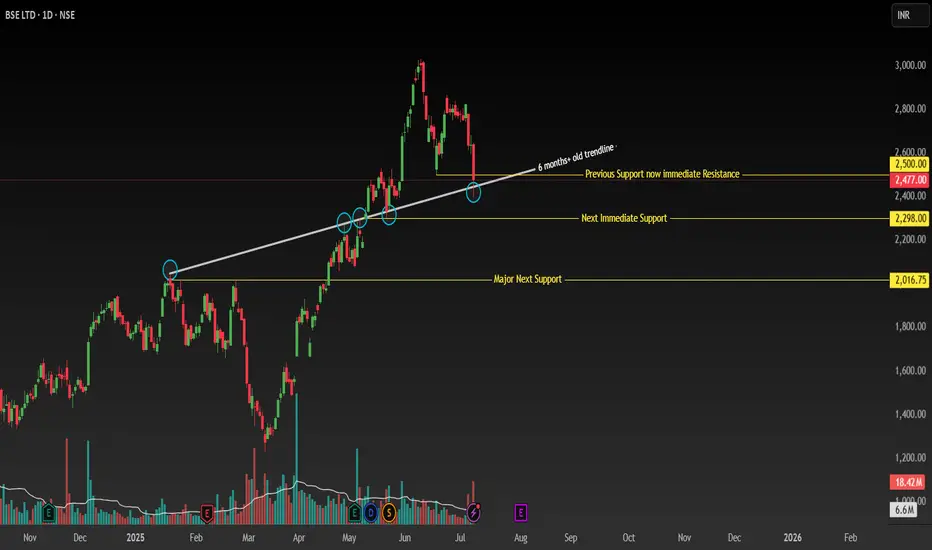
✅ Breakdown: 2500 (closed below) → Next support: 2300 → 2000 (major).
✅ Bullish Anchor: Price > 200 MA + ascending trendline (Jan 20, 2025 breakout now support).
📊 Technical Structure
Critical Support Break:
-Daily close below 2500 (confirmed breakdown of key support).
-Next supports: 2300 (immediate) → 2000 (major swing low).
Bullish Anchors:
-Price above 200-day MA (long-term uptrend intact).
Ascending Trendline Support:
-Originating from Jan 20, 2025 (resistance until May 13 breakout).
-Now acting as dynamic support (resistance-turned-support).
Key Reversal Signal: Watch for reclaim of 2500
-Requires strong bullish candle + above-average volume.
-Confirms failed breakdown and resumption of uptrend.
🎯 Trading Plan
Scenario 1: Buy Dips (Conservative)
Entry Zone:
-Layer 1: 2300 (trendline + horizontal support confluence).
-Layer 2: 2000 (swing low + 200 MA reinforcement).
-Stop Loss: 1950 (below 2000 structure).
-Targets: 2500 → 2700 → 2900.
Scenario 2: Breakout Re-entry (Aggressive)
Trigger: Daily close above 2500 with: Bullish candle (preferably >1.5% gain).
-Volume ≥ 20% above 10-day average.
-Stop Loss: 2450 (below breakout level).
-Targets: 2700 → 2900 (measured move).
⚠️ Risk Management
Position Size: ≤3% capital per trade.
Invalidation Conditions:
-Close below 2000 (invalidates bullish thesis).
-Failed 2500 reclaim (weak volume/rejection candle).
Disclaimer: Not financial advice. Conduct your own due diligence. Past performance ≠ future results. Risk capital only.
🔥 Boost if this analysis helps your strategy!
💡 Comment below any stocks you want me to analyse next!
BSE – Heavy Call Writing Indicates Resistance Ahead________________________________________
📈 BSE – Heavy Call Writing Indicates Resistance Ahead | OI + Price Action Analysis
🕒 Chart Type: 15-Minute
📆 Date: July 7, 2025
________________________________________
🔍 What’s Catching Our Eye:
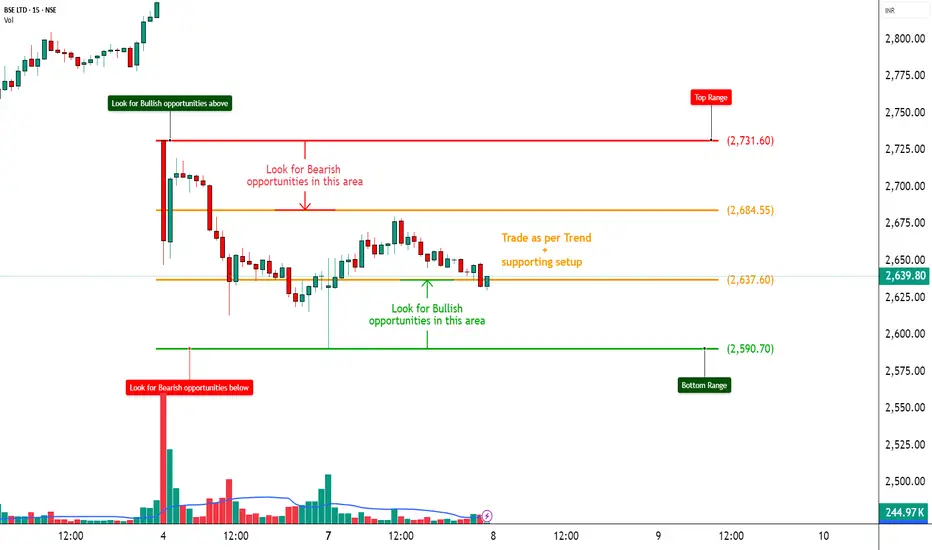
BSE is trading near ₹2636, and the Option Chain is showing aggressive Short Build-Up on Calls from 2650 to 3000, clearly highlighting a resistance zone above current price. Meanwhile, Put writers are unwinding, especially at ₹2600 PE, confirming weak bullish conviction. Traders are playing defensively with bearish bias dominating.
________________________________________
📌 What We’re Watching For:
If BSE breaks below ₹2600, we may see a quick slide toward ₹2550–2500. However, a sharp breakout above ₹2700 with strong volume may trigger a round of short-covering. Until then, upside looks capped due to excessive Call writing.
________________________________________
📊 Volume Footprint:
Options activity is backed by strong volume —
• Over 8.9k contracts at ₹2700 CE
• Over 8.1k contracts at ₹2800 CE
• Over 7k contracts at ₹3000 CE
→ Traders are betting on price staying below 2700–2800 levels, creating a strong supply wall.
________________________________________
📈 Option Chain Highlights:
• Calls (Short Build-Up):
o ₹2700 CE: +81,375 OI | Price ↓ 8.82%
o ₹2800 CE: +18,375 OI | Price ↓ 11.07%
o ₹3000 CE: +77,250 OI | Price ↓ 16.60%
o ₹2650 CE: +38,250 OI | Price ↓ 8.01%
• Puts:
o ₹2600 PE: -42,375 OI | Price ↓ 10.94% → Long Unwinding
o ₹2500 PE: +102,375 OI | Price ↓ 16.55% → Short Build-Up
📌 Inference:
Bulls are on the back foot. CE writers are dominating across all key strikes, and only the 2500 PE is showing fresh interest — which is far from spot, indicating potential room for further downside.
________________________________________
🔁 Trend Bias:
🔴 Bearish to Neutral – Unless 2700 breaks cleanly
________________________________________
🧠 Trade Logic / Reasoning:
Every CE strike from ATM to OTM is under short build-up — that's a clear ceiling forming. With no visible strength in Put writing near spot, the path of least resistance appears to be on the downside. Keep a close eye on ₹2600.
________________________________________
📍 Important Levels to Mark:
🔺 Top Range (Resistance): ₹2731.60
🔻 Bottom Range (Support): ₹2590.70
________________________________________
🎯 Trade Plan (Educational Purpose Only):
✅ Best Buy (Equity): Only if BSE crosses ₹2700 with volume
✅ Best Sell (Equity): Below ₹2600 for target ₹2550–2500
✅ Best CE to Long: ❌ None – All major Calls under Short Build-Up
✅ Best PE to Long: ₹2500 PE – Showing fresh bearish positioning
🟢 Demand Zone: NA
🔴 Supply Zone: NA
⚠️ Invalidation Below:
Bullish view invalidated if price sustains below ₹2600
________________________________________
⚠️ Disclaimer:
This analysis is for educational purposes only.
STWP is not a SEBI-registered advisor.
No buy/sell recommendations are made.
Please consult your financial advisor before trading.
STWP is not responsible for trading decisions based on this post.
________________________________________
💬 Spotting the weakness early helps plan smarter.
What’s your view on BSE – comment below ⬇️
🔁 Share this if you're tracking BSE this week
✅ Follow STWP for clean price + OI based setups
🚀 Be Self-Reliant | Trade with Patience | Learn with Logic
________________________________________
BSE LTD - Daily Chart - Bullish- Good ResultBSE LTD - Daily Chart
Prior Patterns:
Ascending Triangle: From September 2024 to early January 2025, an ascending triangle formed, leading to an upward breakout.
Parallel Channel: After the ascending triangle breakout, the price moved up in a parallel channel for a short period in January 2025.
Box Consolidation: From late January to mid-March 2025, the stock consolidated within a box or rectangular range.
Current Pattern: A "Cup and Handle" pattern has formed more recently.
Cup: Formed from roughly mid-March 2025 to late April 2025, with the low around 3,700.
Handle: A smaller pullback (handle) formed in early May 2025.
Breakout: The price has broken out from this Cup and Handle pattern above the neckline around 5,781.25 - 5,786.25.
Volume: Volume appears to have increased on the breakout from the Cup and Handle.
Target: The depth of the cup (approximately 2,057.90 points) is projected upwards from the breakout point, suggesting a target of around 7,822.15.
Support: The neckline of the Cup and Handle (around 5,781.25 - 5,786.25) is now the key support.
Resistance: The recent high around 6,847.50 is the immediate resistance, followed by the projected target.
Interpretation: The chart shows multiple bullish patterns. The latest Cup and Handle breakout indicates a continuation of the uptrend. The stock is headed towards its target of 7,822.15, with the 5,781.25 level acting as crucial support.

Bse India - Expecting PullbackStock currently in HH HLs in all TFs
Recently broke a resistance area of 4800-5000 with a very strong daily candle
Right now in a pull back phase
So expecting the same area to work as a support zone
Trend lines also suggests the same
Entry Sl accordingly when reaches

BSE 📈 Above that White line closing in weekly than 📈 4617 within 27th May 2024
Disclaimer:
Its a personal view not a financial advise and I assume no responsibility and liability whatever outcome arises.

BSE is trying to achieve, but what?NSE:BSE had been in bearish stance for so long time. Contemporary stocks like CDSL at least holding their upper levels but it is continuously showing lower levels. And today it broke it's 550 and 490-500 seems coming.

BSE Ltd. LongBSE Ltd. is a quality stock as it offers the holders promising fundamentals & the dividend payout is also good.
Possibility of Upside in sight if trend breaks the wedge. Good stock for long position.
Fundamentals: Good
Dividend: Good
Technical: Falling Wedge
Target: 590/616/641/704
Support: 559/545
Time Frame: 12-16 months

Simple Trade Setup | BSE | 01-11-2021 [ INTRADAY]NSE:BSE
Observations:
1) On daily time frame, we can see that it has made bullish spinning top candle.
Also it closed below 21DMA and it is trading above 50DMA.
50 DMA which is placed at 1240.07 level which will work as major immediate support.
and 21DMA which is placed at 1330.53 level which will work as immediate resistance.
Sustainable breakout of 21DMA will make it bullish again.
Please refer below chart : 1day Time Frame.
2) Also On 1day time frame, we can see it is forming cup and handle pattern. Major breakout level is 1400 level.
Please refer below chart : 1 day Time Frame.
-------------------------------------
Trade Setup for Date 01-11-2021:
1) Don't Jump in to trade at the beginning of the market. Let it get settle for 15-20min first and judge the price action.
2) Everything is mentioned on the chart. I hope it is easy to understand.
3) All the levels will work as support, resistance, entry and exit w.r.t price action near that level.
4) Avoid gap up or gap down chase. Wait and trade between levels.
Please refer below chart for levels.
Hope I made it easy to understand it.
Do comment your doubt or suggestion.
Note: Trade with Strict SL. It may or may not hit all the levels. So one can book profit / loss at respective level considering how price action works near that level.

BSE Flag BONSE:BSE
Expecting a retest of BO level
Buy around 1020-980
SL closing below 870
T 1110, 1190,1280, 1380
