BTR Indicator Option Trade | 24 Dec 2025 |+17 Points in BSE PUT Today 24 Dec 2025, the BTR Indicator did not generate any signal in BSE LTD (Cash Market).
Does that mean it was a No Trading Day?
❌ NO. The market never stops.
When the cash market stays silent, professional traders shift focus to OPTIONS.
In this video, I demonstrate:
✔ How to apply BTR Indicator correctly
✔ Why no signal = no trade in cash market
✔ How to identify PUT option opportunity after a bearish bias
✔ BTR-generated BUY entry at 65–66 in BSE PUT
✔ Clean EXIT at 82
✔ +17 points profit using only BTR Indicator
📌 Same Indicator
📌 Same Rules
📌 Different Instrument
⏱️ Timeframe Note
• Recommended for Options using BTR: 5-Minute Chart
• Used in video: 15-Minute (for clarity & learning)
🔑 Key Lesson
Discipline creates consistency.
No force trades. No noise. Only high-probability setups.
📍 Where to Find BTR Indicator
👉 Visit my TradingView Profile
👉 Go to Scripts / Indicators
👉 Add BTR Indicator to your chart
💬 Comment “SCALP” if you want a separate BTR Scalping Guide Video
📊 Follow for more clean intraday & option trades
Follow BTR. Trade Smart. Stay Profitable. 📈🔥
Bsechart

BSE Intraday Trade — 18 Dec 2025BTR Bullish Setup + Fibonacci Precision | +30 Points Booked
Once again, BTR Indicator delivered a clean bullish intraday opportunity in BSE Ltd, proving the strength of rule-based trading over emotions.
This trade was further refined using Fibonacci Retracement, which helped in defining clear entry confidence, precise stop-loss, and a high-probability exit zone.
🔍 Trade Details
• Stock: BSE Ltd
• Timeframe: 15-Minute
• Setup Type: Bullish (BTR Confirmed)
• Market Condition: Pullback into Demand Zone
🟢 Entry Logic
✔ BTR generated a bullish signal inside a strong demand zone
✔ Price respected 0.5 – 0.618 Fibonacci retracement
✔ Strong bullish candle confirmed buyer presence
🟢 Buy Entry: Near 2670 zone
🎯 Exit & Target Planning
📌 Fibonacci Extension Used for Exit
• 1.618 Fib Level acted as a high-probability exit zone
• Price reacted immediately from this level
🔴 Exit Booked Near: 2700 zone
📈 Net Gain: +30 Points (Intraday)
🧠 Why This Setup Worked
✔ BTR provided directional clarity
✔ Fibonacci gave structure for SL & Exit
✔ Demand zone ensured low-risk entry
✔ System-based exit avoided overtrading
📌 Key Takeaway
Profitable trading is not about prediction.
It’s about alignment:
Signal + Structure + Risk Control
BTR does exactly that — again and again.
📊 Follow for daily intraday trade ideas
💬 DM for BTR Indicator & complete trading rules
Trade what you see. Exit where the system tells you. Stay disciplined. 🔥📈
#BSE #NIFTY #INTRADAY #BULISH #BUY #BSESTOCK #BSEINDIALTD

BSE Looing good for Long callsBSE broke the Trend channel of almost 4months, looking good to take long call at around 2268 with stoploss at 1950 for the target at around 2800.
-- This is only for educational purpose, please do your own analysis before taking a call so you have confidence to hold the trade.

BSE : LongThe price action shows a strong rally followed by a period of decline and consolidation.
Key horizontal support and resistance levels are marked, with the current price near the support zone, suggesting buyers are actively defending this area.
The descending trendline indicates a consistent pattern of lower highs, reflecting ongoing selling pressure.
Below, the MACD indicator reveals a recent attempt at bullish crossover, signaling potential upward momentum, but confirmation is awaited.
This setup is useful for monitoring possible trend reversals or continued weakness, and members are encouraged to note these patterns while making informed decisions.

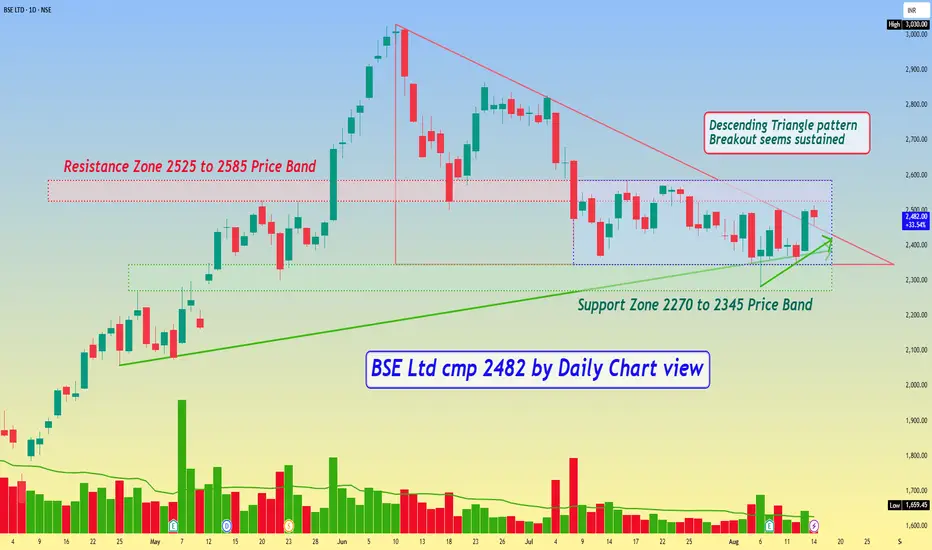
BSE Ltd cmp 2482 by Daily Chart viewBSE Ltd cmp 2482 by Daily Chart view
- Support Zone 2270 to 2345 Price Band
- Resistance Zone 2525 to 2585 Price Band
- Descending Triangle pattern Breakout seems sustained
- Stock seems trading within price range indicating Darvas Box setup
- Volumes seen gradually syncing closely with the average traded quantity
- Most known Technical Indicators BB, EMA, MACD, RSI, SAR seem trending positively
BSE Long Trade SetupBSE is looking good for a short term long trade. Got hold of this while I was looking through stocks thrown up by my scanner. The Stop Loss levels are indicated in the video. If you find it breaching the higher levels as indicated in the video, a long position can be taken and then trailed. Happy Trading.

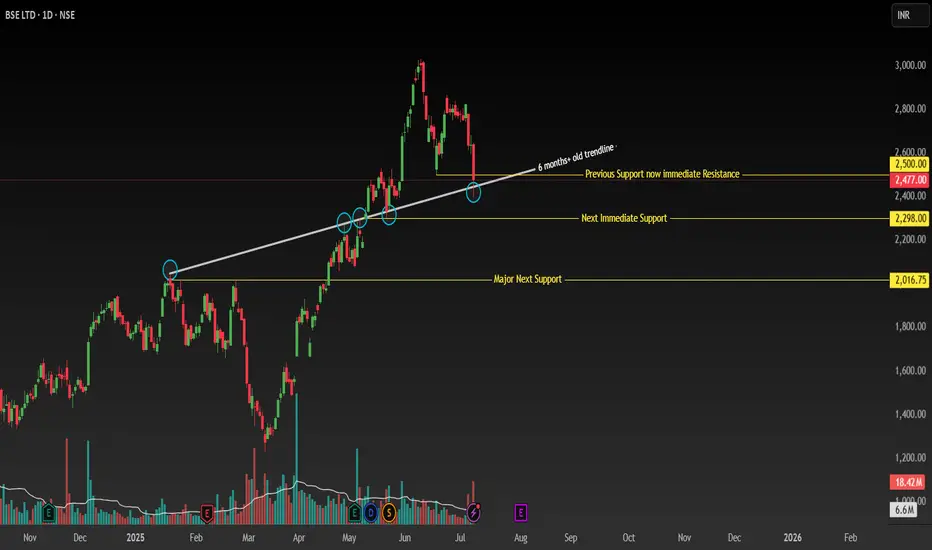
BSE - Support Break with Bullish Recovery SetupSymbol: BSE (Bombay Stock Exchange)
Timeframe: Daily
Key Levels:
✅ Breakdown: 2500 (closed below) → Next support: 2300 → 2000 (major).
✅ Bullish Anchor: Price > 200 MA + ascending trendline (Jan 20, 2025 breakout now support).
📊 Technical Structure
Critical Support Break:
-Daily close below 2500 (confirmed breakdown of key support).
-Next supports: 2300 (immediate) → 2000 (major swing low).
Bullish Anchors:
-Price above 200-day MA (long-term uptrend intact).
Ascending Trendline Support:
-Originating from Jan 20, 2025 (resistance until May 13 breakout).
-Now acting as dynamic support (resistance-turned-support).
Key Reversal Signal: Watch for reclaim of 2500
-Requires strong bullish candle + above-average volume.
-Confirms failed breakdown and resumption of uptrend.
🎯 Trading Plan
Scenario 1: Buy Dips (Conservative)
Entry Zone:
-Layer 1: 2300 (trendline + horizontal support confluence).
-Layer 2: 2000 (swing low + 200 MA reinforcement).
-Stop Loss: 1950 (below 2000 structure).
-Targets: 2500 → 2700 → 2900.
Scenario 2: Breakout Re-entry (Aggressive)
Trigger: Daily close above 2500 with: Bullish candle (preferably >1.5% gain).
-Volume ≥ 20% above 10-day average.
-Stop Loss: 2450 (below breakout level).
-Targets: 2700 → 2900 (measured move).
⚠️ Risk Management
Position Size: ≤3% capital per trade.
Invalidation Conditions:
-Close below 2000 (invalidates bullish thesis).
-Failed 2500 reclaim (weak volume/rejection candle).
Disclaimer: Not financial advice. Conduct your own due diligence. Past performance ≠ future results. Risk capital only.
🔥 Boost if this analysis helps your strategy!
💡 Comment below any stocks you want me to analyse next!
BSE LTD - Daily Chart - Bullish- Good ResultBSE LTD - Daily Chart
Prior Patterns:
Ascending Triangle: From September 2024 to early January 2025, an ascending triangle formed, leading to an upward breakout.
Parallel Channel: After the ascending triangle breakout, the price moved up in a parallel channel for a short period in January 2025.
Box Consolidation: From late January to mid-March 2025, the stock consolidated within a box or rectangular range.
Current Pattern: A "Cup and Handle" pattern has formed more recently.
Cup: Formed from roughly mid-March 2025 to late April 2025, with the low around 3,700.
Handle: A smaller pullback (handle) formed in early May 2025.
Breakout: The price has broken out from this Cup and Handle pattern above the neckline around 5,781.25 - 5,786.25.
Volume: Volume appears to have increased on the breakout from the Cup and Handle.
Target: The depth of the cup (approximately 2,057.90 points) is projected upwards from the breakout point, suggesting a target of around 7,822.15.
Support: The neckline of the Cup and Handle (around 5,781.25 - 5,786.25) is now the key support.
Resistance: The recent high around 6,847.50 is the immediate resistance, followed by the projected target.
Interpretation: The chart shows multiple bullish patterns. The latest Cup and Handle breakout indicates a continuation of the uptrend. The stock is headed towards its target of 7,822.15, with the 5,781.25 level acting as crucial support.

BSE Bombay Stock Exchange Technical👉🇮🇳As per recent data on chart of #BSE #BombayStockExchange has shown significant trading volumes, especially in derivatives like options and futures, indicating active technical trading. The Sensex has been noted for setting new records, suggesting bullish trends that technical analysts would interpret through various indicators. but in my view top has been made please find the 📉chart for your reference.
#bseltd ❣️ #renderwithme #stockmarketsindia #ShareMarket #Nifty #Nifty50 #MarketNews

Bse India - Expecting PullbackStock currently in HH HLs in all TFs
Recently broke a resistance area of 4800-5000 with a very strong daily candle
Right now in a pull back phase
So expecting the same area to work as a support zone
Trend lines also suggests the same
Entry Sl accordingly when reaches

BSE Flag Pattern Breakout - Bullish Momentum AheadThe BSE has shown a promising flag pattern breakout, indicating potential bullish momentum in the near term. Sustaining above the key level of 2890, the index is poised for further upward movement, with a target around 3400. Let's delve deeper into the technical analysis to understand the potential trajectory.
Technical Analysis:
Flag Pattern Breakout: The BSE index has formed a flag pattern, characterized by a sharp upward move (flagpole) followed by a consolidation phase (flag). This pattern often signifies a continuation of the previous trend, in this case, bullish.
Key Resistance Level: The breakout occurred above the crucial resistance level of 2890. This level now acts as a support, validating the bullish bias.
Volume Confirmation: The breakout is further supported by increasing trading volumes, indicating strong buying interest and participation.
Moving Averages: The shorter-term moving averages (such as the 20-day EMA) are crossing above the longer-term ones, signaling a bullish crossover and strengthening the upward momentum.
Trade Idea:
Entry: Consider entering long positions on a confirmed close above 2890.
Stop-loss: Place a stop-loss slightly below the breakout level to mitigate potential downside risks.
Target: Aim for a target around 3400, considering the measured move of the flag pattern and psychological resistance levels.
Risk Management: Always adhere to proper risk management strategies, such as position sizing and trailing stops, to protect capital.
Disclaimer: Trading involves risk, and this analysis is for educational purposes only. It's crucial to conduct thorough research and consider your risk tolerance before making any trading decisions.

BSE ltd positional trading ideaATH breakout of BSE. BSE just broke the upper resistance level of 2600. the volume of the breaout candle is also good. but it didnt consolidate before breakout. so there is a chance that BSE will move in a range for a few days after breakout. and after that if it makes a positive price action, we may go for a long entry.
Disclaimer: All information provided here is for educational purposes and not a recommendation, advice, research report, or stock tip of any nature. Analysis Posted here is just our view/personal study method on the stocks, commodities or other instruments and assets.

SWADESHI POLYTEX Weekly TF Analysis LONG (slow accumalation)SWADESHI POLYTEX looks good on Weekly tf as it is forming base upon base pattern which is basically ACCUMALATION for a Possible RALLY, we have VOLUME dryup while its moving UP which is a good sign.

bse down trendbse downtrend will continue
as it seems to be in zig zag correction
5-3-5 formation
downfall came in five , sharp upmove came in 3 steps
now again down trend continuing possible five wave formation may form ,
let's wait and watch
it is an analysis , not a trading advice trade with your due diligence.

BSE LTDBSE LTD Make Pall & Flag Flag Pattern But not confirm now ,
BSE Breakout 901 and sustained above 900 than confirm Pall & Flag Pattern Confirmation,
BSE Breakout and sustained above 901-10 than next move 955-60 Sustained above 955 than next move on 1024 and than open the sky of pall and flag pattern Target Move 1300 possible ,
But Now the time market Stay in Negative so,
Breakdown also possible,
If 340-38 Breakdown also possible,
Than Next Support 780-85 Possible
so be Careful and trade according your analysis and market view

BSE (Bullish)BSE:
Sector: Banking and Finance
Industry: Exchange
BSE (Daily):
1. Stock is consolidating at 38.2 Fibo levels
2. Forming Penant pattern
3. Long above closing of 920 levels (after breakout)
Addl Points:
1. FII/FPI have increased holdings from 7.59% to 9.06% in Dec 2021 qtr.
2. Mutual Funds have decreased holdings from 1.28% to 0.77% in Dec 2021 qtr
Note:
The above analysis is just for educational purpose.


Simple Trade Setup | BSE | 01-11-2021 [ INTRADAY]NSE:BSE
Observations:
1) On daily time frame, we can see that it has made bullish spinning top candle.
Also it closed below 21DMA and it is trading above 50DMA.
50 DMA which is placed at 1240.07 level which will work as major immediate support.
and 21DMA which is placed at 1330.53 level which will work as immediate resistance.
Sustainable breakout of 21DMA will make it bullish again.
Please refer below chart : 1day Time Frame.
2) Also On 1day time frame, we can see it is forming cup and handle pattern. Major breakout level is 1400 level.
Please refer below chart : 1 day Time Frame.
-------------------------------------
Trade Setup for Date 01-11-2021:
1) Don't Jump in to trade at the beginning of the market. Let it get settle for 15-20min first and judge the price action.
2) Everything is mentioned on the chart. I hope it is easy to understand.
3) All the levels will work as support, resistance, entry and exit w.r.t price action near that level.
4) Avoid gap up or gap down chase. Wait and trade between levels.
Please refer below chart for levels.
Hope I made it easy to understand it.
Do comment your doubt or suggestion.
Note: Trade with Strict SL. It may or may not hit all the levels. So one can book profit / loss at respective level considering how price action works near that level.


BSE Range BreakoutBuy BSE LTD
Closing Price - 701.9
Add More If Price Fall To 625-655
Strict SL - 535 (WCB)
Target - 985/1100

BSE price analysis on daily chart If it breaks its resistance zone then it can reach the target 1st and Target 2nd
