Bitcoin 2H Rejection from Supply – Pullback Before ContinuationOn the 2-hour timeframe, Bitcoin (BTC/USD) has reacted sharply from a marked supply zone near the 69,500–70,000 region. Price tapped into higher-timeframe supply and immediately printed a strong rejection, suggesting sellers are defending this area aggressively.
Structurally, the recent move shows a strong impulsive rally from the 62,000–63,000 demand zone, followed by a sharp upside spike that appears to have taken liquidity above prior highs. However, the rejection wick at supply indicates a potential short-term distribution phase rather than immediate continuation.
Currently, price is hovering around 68,000. If BTC fails to reclaim and hold above the 69,000 level, a corrective move toward the 66,500–67,000 imbalance area becomes likely. A deeper retracement could revisit the 64,000–65,000 region, where prior structure (BOS level) and demand sit.
On the bullish side, if buyers absorb selling pressure and price consolidates above 68,000, a second attempt into 70,000 is possible. A clean 2H close above supply would invalidate the short-term bearish pullback scenario and open upside liquidity toward the 71,000–72,000 region.
Overall, the expected move in the short term favors a pullback from supply before any sustainable continuation higher. The reaction at 69.5K–70K is key — rejection confirms retracement, acceptance confirms breakout.
BTC

$ETH Bearish Flag Breakdown Below $1,800 = Free Fall to $1,300CRYPTOCAP:ETH Bearish Flag Breakdown Below $1,800 = Free Fall to $1,300
#Ethereum Price Still respecting descending channel with multiple BOS confirmations from $4,950 TOP.
🔴 Bearish OB: $3,400-$3,550 ✅
🟢 FVG: $3,200-$3,400 (Short Entry Filled ✅)
🔵 Support: $1,800 (Channel Low)
🟢 Best Accumulation: $1,300 (For Long Term Holders)
No CHoCH on HTF = Bearish bias intact.
Smart Money Likely Targeting Liquidity Below $1,750 Before Any Reversal.
If price breaks down $1,800 bearish flag channel support, high chances ETH revisits $1,300. Which Would be a mind-blowing entry for long-term holders.
Bearish Invalidation: Break Above Channel + CHoCH Above $2,150
NFA | ALWAYS DYOR

Will ARB/USDT Potential 7500% in this alt season?AMEX:ARB WILL MAKE MILLIONAIRES BUT 95% WILL MISS IT | $5+ PRICE FORECAST ( FULL TA BREAKDOWN )
#ARB Has Been In A Brutal -96.36% Drawdown From Its Cycle High Over The Last 2 Years But This Is Where Generational Entries Are Made.
Price Is Sitting At The Bottom Of A Multi-Year Descending Channel Inside A HTF Demand Block With Strong Accumulation Structure Forming.
✅ Cycle High: $2.425 (2024) & Current ~96% Down From ATH
✅ Price Sitting Inside Strong Accumulation Zone: $0.09–$0.06
✅ Wyckoff Phase C / Early Phase D Candidate In Play
✅ Seller Exhaustion + Demand Absorption Signals Active
✅ HTF Market Structure Valid Above $0.06
✅ Turn Fully Bullish Above $0.23 (First BOS Confirmation)
✅ Trend Regime Change Above $0.49 (Descending Trendline Break + R2 Flip)
✅ Breakdown Below $0.06 = Accumulation Thesis Invalidated
Upside Targets (If Structure Flips Bullish): $0.49 ➔ $1.20 ➔ $2.42 ➔ $5 Full Cycle Expansion (5,129%–7,435%)
Key Confluences Stacking At Current Zone:
✔ Bottom Of 2-Year Descending Channel
✔ Historical Capitulation Wick Support
✔ Volume Absorption + Sideways Compression Post-Impulse Drop
✔ Wyckoff Accumulation Structure
✔ Volatility Compression Breakout Setup
Thesis: High-Beta Layer 2 Leader Trading At A Maximum Confluence Demand Zone - Channel Support + HTF Demand Block + Wyckoff Accumulation + Seller Exhaustion All Stacking.
IMO: ARB/USDT Is Currently On Sale With A ~96% Discount From Its ATH. Risk-Reward At These Levels Is Structurally Asymmetric. Downside Contained Within Demand Base, Upside Open Toward 49x–74x Expansion.
This Is A Patience Zone, Not A Momentum Zone. Smart Money Accumulates When Charts Look The Worst.
Purely TA Only | Not Financial Advice | Always DYOR
Your AMEX:ARB Target?
Like + RT + Bookmark

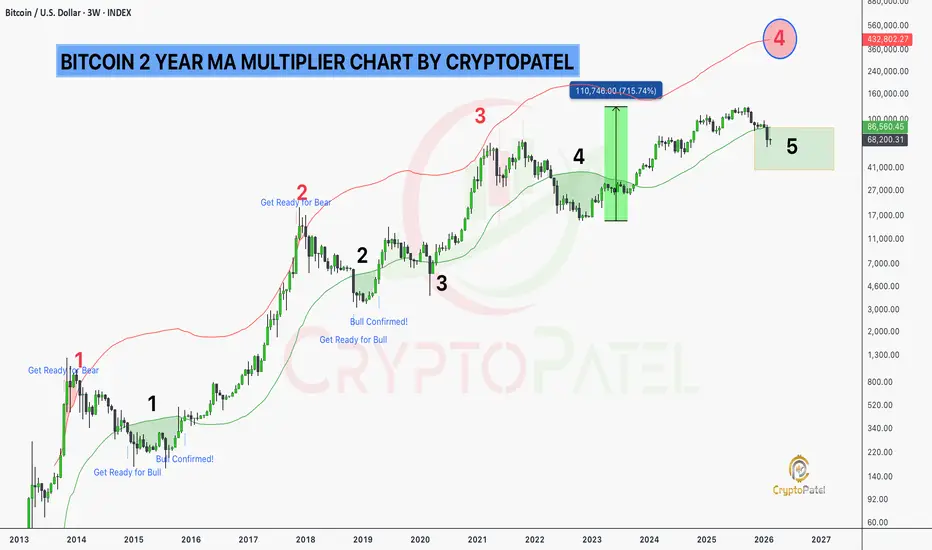
Will Bitcoin Hit $4,30,000 In Near future?IF YOU'RE NOT BUYING #BITCOIN RIGHT NOW, YOU'LL REGRET IT IN 2-5 YEARS - HERE'S WHY THE 2-YEAR MA MULTIPLIER IS SCREAMING "BUY"
CRYPTOCAP:BTC Broke below $85K (the 2-Year MA) and Trading Between $68K-$60K Level.
This has happened only 5 times in Bitcoin's history, and EVERY SINGLE TIME it led to 5-10x gains Minimum!
The Red Line TARGET? $430K 🎯
History Doesn't Lie:
2015: Below MA = Buy → Pumped to Red Zone (+12K%)
2019: Below MA = Buy → Pumped to Red Zone (+1976%)
2022-2023: Below MA = Buy → Pumped (+700%)
2026: Below MA = Buy → We're Here Now!
The Strategy is Simple:
✅ Accumulate SLOWLY Between $65K-$45K
✅ HOLD through the Noise
✅ Sell Near $430K (Red Zone)
This is Literally the Discount Zone Before the Next Massive Bull Run.
Are you Accumulating or Waiting for "Confirmation"? 👇
NFA & ALWAYS DYOR
$RAY Dropped 94% But What's Coming Next Could Shock Everyone 60xNASDAQ:RAY Dropped 94% But What's Coming Next Could Shock Everyone (6,473% Potential)
#RAY Has Corrected ~94% From Its 2025 Swing High, Now Sitting Inside A Major HTF Demand Cluster With Corrective Structure Forming Into Key Order Blocks.
Price Is Compressing At Historical Demand With Repeated Seller Exhaustion Inside A Multi-Year Descending Channel.
✅ Strong HTF Demand & Order Block 1: $0.42–$0.32 (Best Mid-Term Entry)
✅ Deep Liquidity Pocket & Order Block 2: $0.16–$0.20 (Best Long-Term Entry)
✅ Breakout Trigger: HTF Close Above Descending Channel Resistance
✅ Structure Turns Bullish On Reclaim Of Most Recent Lower High
✅ Corrective Decline Into Demand Suggests Distribution Exhaustion, Not Impulsive Selling
✅ Close Below $0.16 = HTF Structure Fully Invalidated
Upside Targets If OB1 Holds: $1.80 ➔ $4.00 ➔ $8.50 ➔ $21.00+
Why I'm Watching RAY/USDT Long Term
→ Same Cycle Pattern That Triggered +6,435% Rally From 2022 Bottom
→ HTF Structure Mirrors Previous Accumulation Base Formation At Order Blocks
→ Corrective Move Into Demand Shows Smart Money Absorption In Progress
→ Multi-Year Descending Channel Compression Signals Expansion Phase Ahead
→ Massive Risk-Reward Asymmetry From Current Levels
HTF Order Blocks + Corrective Structure + Descending Channel Support + Historical Pattern Repeat = Asymmetric Setup.
This Is Where Smart Money Builds Positions. Retail Panics.
Pure TA + Smart Money Concepts | Not Financial Advice | Always Do Your Own Research
What's Your Target For NASDAQ:RAY ? Let Me Know
Like + Share If You Found This Useful!

$RENDER Down 90% From ATH: HTF Bullish OB Test With 2,650% ExpanCRYPTOCAP:RENDER Down 90% From ATH: HTF Bullish OB Test With 2,650% Expansion Potential If $1 Holds
#RENDER Is Trading Inside A HTF Bullish OB After A ~90% Corrective Move From Its ATH, Positioning Price At A Critical Accumulation Vs Invalidation Zone.
Technical Structure
✅ Previous Cycle ATH At $13.83 (Macro High)
✅ BIG Correction PHASE: −91% From ATH Into Current Accumulation Range
✅ Multi-Year Descending Channel (Bull Flag) Compression Near Key Demand
✅ HTF Bullish OB Active At $1.35–$1.10
✅ 0.786 Fib Retracement Level at $0.845 ( Best Accumulation Zone)
✅ Liquidity Grab Below $1 ( Place Bid for Long Term)
✅ Structure Remains Bullish As Long As $0.845 Holds (HTF Close)
✅ Strict STOP LOSS For High Risk Trader: $0.845 (HTF Close Below 0.786 Fib)
Historical Context:
2022-2023 Bull Run: +5,000% Expansion To $13.83 ATH From $0.274
2024–2026 Correction: −91% Decline Into Accumulation Phase
HTF Demand Zone: $1.35–$1 (Accumulation & Liquidity Absorption)
Deep Demand Zone: $0.60–$0.40 (Secondary Order Flow If $1 Fails)
Reclaim Zone: $2.712 (Trend Confirmation & Descending Channel Breakout)
Bull Market Expansion Targets: $2.70 → $5.50 → $13.00 → $28+ (Full Cycle Expansion Projection)
This $1.35–$1.00 Zone May Be The Last Accumulation Opportunity For CRYPTOCAP:RENDER Bulls Before The Next Parabolic Phase.
Invalidation: Weekly Close Below $0.845
Disclaimer: This Is TA Only. Not Financial Advice. Always Do Your Own Research And Manage Risk.

$LINK PRICE FORECAST | IS $100+ POSSIBLE? | CRYPTOPATELBIST:LINK PRICE FORECAST | IS $100+ POSSIBLE? | CRYPTOPATEL
#LINK Is Trading Inside A Multi Year Descending Channel On The 3 Weekly Chart Since The 2021 Cycle High Near $53.
After A 86%+ Cycle Correction, Price Has Compressed Into A Higher Timeframe Demand Block Between $7.50-$5.60. A Critical HTF Accumulation Zone With Confirmed Bullish Order Flow.
Market Structure Suggests Smart Money Absorption At Macro Support With Repeated Sell Side Liquidity Sweeps Fully Absorbed.
Current Technical Structure:
➤ Descending Channel Resistance Intact From 2021 ATH
➤ Price Trading At Range Equilibrium Near $8
➤ Multiple Higher Lows Printed Inside HTF Demand Block
➤ Sell Side Liquidity Swept Into Support + Full Absorption
➤ Extreme Volatility Contraction On 3W Timeframe, Expansion Imminent
➤ Significant Liquidity Pools Resting Above $26 / $52 / $100
➤ Fractal Structure Mirroring Previous Cycle Compression Before Breakout
Key Confirmation Signal: Acceptance Above Descending Trendline Resistance + Break Of Range High On 3W Close.
CryptoPatel Targets: $26.30, $52.22, $100.00
Projected ROI From HTF Demand Zone: 1,232% To 1,675% Expansion. From Current Price To TP3 = ~1,110% Move.
Bullish Bias Remains Valid As Long As: BIST:LINK Holds Above $4.76 On 3 Weekly HTF Demand Zone.
Invalidation: 3W Candle Close Below $4.76 (Structure Failure, Downside Continuation)
This Is A High Timeframe, Patience Based Setup With Asymmetric Risk Reward. Best Suited For Spot Accumulation & Long Term Swing Positioning.
TA Only. Not Financial Advice. Always DYOR.

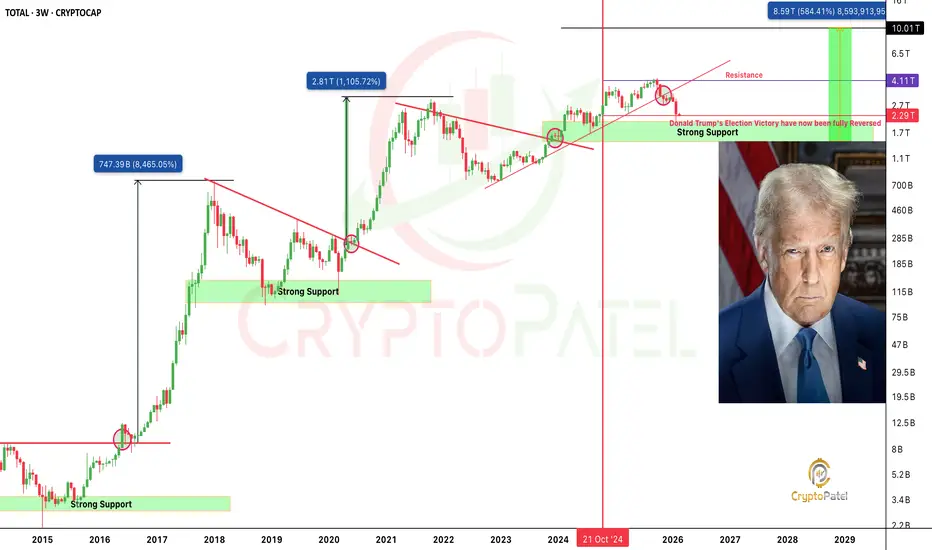
CRYPTO JUST LOST $2 TRILLION: Everything Gained After Trump Won CRYPTO JUST LOST $2 TRILLION: Everything Gained After Trump Won Is Gone
The Entire USA Post-Election Rally Following Donald Trump’S Victory Has Now Been Fully Erased.
The Global Crypto Market Has Dropped $2.22T From Its ATH. A Complete Round-Trip Of The “Trump Trade.”
The Full Cycle:
Election Day (Nov 2024): $2.26T
ATH (15–16 Months Later): $4.27T
Recent Low (Feb 6): $2.05T
From Euphoria ➝ Liquidity Drain ➝ Structural De-Risking.
We Went From Extreme Excitement To Liquidity Drying Up To Investors Pulling Out Risk.
This Isn’t Just Normal Price Swings… It’s A Complete Mood Reset In The Market.
NFA & DYOR
Btc Bottom still below Dips at Oct 2026 Peaks at Oct 2029Btc Bottom still below the current levels
Current cycles bottom Dips at Oct 2026 and
Next Cycle's Peak at Oct 2029

$TAO DOWN -81% INTO A HTF ACCUMULATION ZONETSXV:TAO DOWN -81% INTO A HTF ACCUMULATION ZONE: LAST CYCLE THIS SETUP MADE MILLIONAIRES | $2,000+ TARGET (HTF TA)
#TAO Is Trading Around $170 Inside A Major HTF Fair Value Gap / Accumulation Zone ($85–$135). A HTF Discount Range.
Structure Is Showing Two Major Markdowns (-81.60% & -73.47%) With Price Compressing Toward The Golden Pocket Zone
✅ Accumulation Zone (HTF FVG): $135-$85
✅ 0.618 Fibonacci Support: $134.30 (Golden Pocket)
✅ 0.786 Fibonacci Support: $83.58 (Best Entry Level)
✅ Price Must Hold Above $83 For Bullish Thesis To Remain Valid
✅ Classic Broken Support → Resistance Flip Structure At $220
✅ Liquidity Engineered Below Range Lows Into HTF Demand
✅ Weekly Close Below $83 (0.786 Fib) = Bullish Thesis Invalidated
Upside Targets: $450 ➔ $725 ➔ $1,200 ➔ $2,000+ (~23x From Accumulation Zone)
Thesis: Decentralized AI Narrative Leader Trading At A High-Confluence HTF Demand Zone: Fibonacci Golden Pocket + HTF FVG + Descending Channel Support All Aligning.
IMO: #BITTENSOR Is Currently Trading Inside A Generational Accumulation Range Before Expansion.
Purely TA Only | Not Financial Advice | Always DYOR
Your TSXV:TAO Target This Cycle?
Like + RT + Bookmark

$BTC BEARISH FLAG PLAYED OUT PERFECTLY - $200K Still Possible?CRYPTOCAP:BTC BEARISH FLAG PLAYED OUT PERFECTLY - $200K Still Possible?
Bearish flag breakdown from $88K-$90K zone played out perfectly, Target achieved with a -30% move down to $59,800.
Current Structure: Price consolidating in $65K-$71K range → No Trade Zone.
Key Levels to Watch:
Upside: Expecting a relief bounce toward $80K Bearish OB → High probability rejection zone before next leg down.
Downside: $60K acting as strong support. Break below invalidates the bounce thesis → Opens path to $50K and potentially $40K.
Long-Term Outlook:
For spot/long-term players, accumulating at these levels isn't unreasonable with macro targets of $200K-$500K still intact.
Trade with confirmations. Manage your risk. No overleveraging.
NFA | DYOR

$AAVE -86% CRASH CREATED A ONCE-IN-A-CYCLE OPPORTUNITY CRYPTOCAP:AAVE -86% CRASH CREATED A ONCE-IN-A-CYCLE OPPORTUNITY | $1,000 TARGET STILL IN PLAY?
#AAVE Is Trading Around $124 Above Major Weekly Strong TL Support at $90 Which is HTF Accumulation Zone.
Structure Is Showing Clear Liquidity Sweep + Reaction From Multi-Year Ascending Trendline That Has Held Since 2021.
Already Experienced -86% Correction From It's ATH, Classic Re-Accumulation Setup Forming.
Price Compressing Between Descending Resistance & Ascending Support. Breakout Imminent.
CURRENT TECHNICAL STRUCTURE:
➤ Bullish OB & Support (Accumulation Zone): $110-$90
➤ Price Must Hold Above $74 For Bullish Continuation
➤ Multi-Year Ascending Trendline + 0.618 Fib Confluence = Strong Demand
➤ Descending TL Compression + Higher Low Formation In Progress
➤ Weekly Close Below $74 = Bullish Invalidation
Upside Targets: $190 ➔ $345 ➔ $579 ➔ $1,000+ (~10x From Accumulation Zone)
IMO: #AAVE Is Currently Trading Between 0.618-0.786 Fib Strong Support A Generational Accumulation Range Before Massive Expansion. DeFi Blue Chip At 86% Discount.
Purely TA Only | Not Financial Advice | Always DYOR
Your Aave Target This Cycle?
Like + RT + Bookmark

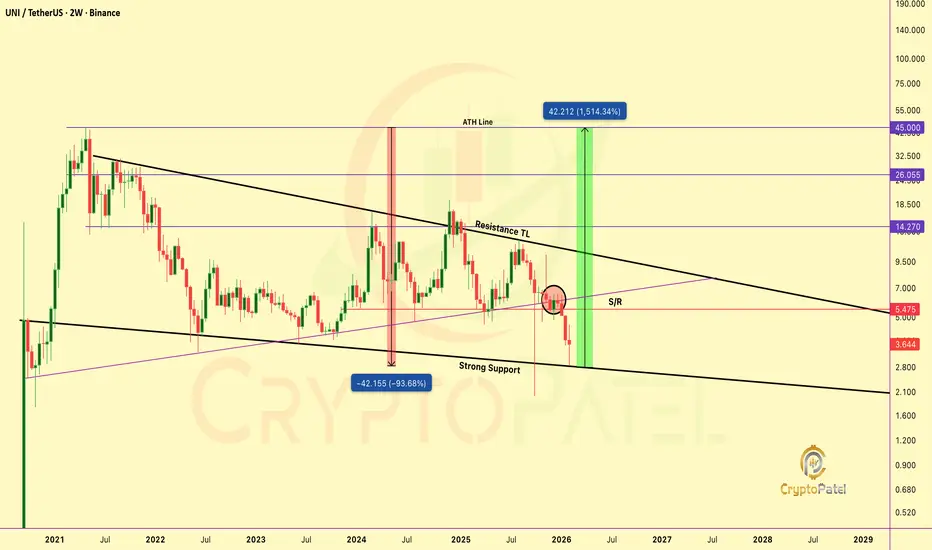
IS UNI/USDT THE GENERATIONAL BUY BEFORE 1,500% RALLY?BME:UNI DROPPED -93% FROM ATH: IS THIS THE GENERATIONAL BUY BEFORE 1,500% RALLY?
#UNI Is Currently Testing A Multi-Year Descending Channel Support That Has Held Since 2022, A Rare, High-Timeframe, Cycle-Level Structure.
The Last Time This Setup Formed, UNI Delivered:
2020: +2,400% (24x From Oct 2020 Lows)
2023 : +400% (4x Rally From Support)
2026: +1,500% (15x Potential)?
Current Technical Structure:
✅ Multi-Year Descending Channel Support Holding
✅ Breakdown Strong Support $6 & Now Trading Below Support Zone
✅ Holding The $2.80 Strong Demand Zone (Accumulation zone)
✅ Major Macro Support At $2.80, Invalidated Below
✅ Brutal -93.68% Correction From ATH, Maximum Pain Zone/Discount Zone
CryptoPatel Targets: If This Structure Holds: $14/$26/$45
Why Expect 3x–8x From Here? The Current Positioning Suggests Smart Money Accumulation At HTF Support With Asymmetric Upside If Structure Flips. The Longer The Base, The Higher The Space.
Based On The Current Cycle, A Move Toward $45 Or Even Higher Could Be On The Cards, Especially With DeFi Narrative Gaining Momentum And Uniswap V4 Development.
Disclaimer: This Is A TA, NFA. Markets Are Probabilistic, Not Guaranteed. Always Manage Risk And Do Your Own Research.
$ZRO Dropped 84% But What's Coming Next Could Shock Everyone CSE:ZRO Dropped 84% But What's Coming Next Could Shock Everyone 🚀
#ZRO Has Corrected ~84% Inside A Multi-Month Descending Channel Since 2024, Now Testing The HTF Breakout Level.
Price Is Compressing At Channel Resistance With Strong Accumulation Around $1.50–$1.20 👇
✅ Strong HTF Demand: $1.50–$1.20
✅ Breakout Trigger: HTF Close Above Channel $2.50
✅ Structure Turns Bullish On Acceptance Above $2.50
✅ Possible Retracement Before Next Expansion Leg
✅ $1.80 = Good Entry Level 1 If Price Pulls Back
✅ $1.50–$1.20 = Major Accumulation Zone (Best Long-Term Entry)
⚠️ Close Below $1.20 = HTF Structure Weakens
Upside Targets If Breakout Confirms: $6.83 ➔ $13.00 ➔ $25.00 (Full Measured Move ~1,500%+)
Why I’m Bullish Long Term On CSE:ZRO 👇
→ Tether Made A Strategic Investment In LayerZero Labs
→ USDT0 Has Processed $70B+ In Cross-Chain Volume
→ Backed By Citadel, Ark Invest, Google Cloud & DTCC
→ Infrastructure Layer For Cross-Chain Finance + AI Economy
→ Price Already Reacted +35% On Institutional News
HTF Compression + Real Adoption + Institutional Backing = Asymmetric Setup.
Pure TA + Narrative Confluence | Not Financial Advice | Always Do Your Own Research
What's Your Target For CSE:ZRO ? Let Me Know 👇
Like + Share if You Found This Useful!

Will $ONDO Potential to hit $5?#ONDO Has Been In A Brutal ~90% Drawdown From Its ATH ($2.15) Over The Last 14 Months But This Is Where Generational Entries Are Made.
Price Is Sitting At A HTF Fibonacci Demand Zone With Strong Accumulation Structure Forming 👇
✅ ATH: $2.15 (14 Months Ago) & Current ~90% From ATH
✅ Price Sitting Inside Strong Bullish OB: $0.19–$0.24
✅ Deeper Demand / 0 Fib Retracement: $0.171
✅ HTF Market Structure Valid Above $0.170
✅ Turn Fully Bullish Above $0.47 (Structure Flip Zone)
✅ Classic Wyckoff Accumulation Phase In Play
⚠️ Breakdown Below $0.171 = Final Support Invalidated
Upside Targets (If Structure Flips Bullish): $1.00 (5x) ➔ $2.15 (ATH 10x) ➔ $5.00+ Full Cycle Expansion (2500%+)
Pro Positive Point:
Do You Know Trump’s World Liberty Financial (WLFI) Bought LSE:ONDO At $1.374 And You’re Getting It Around $0.20, Which Is ~85% Down From Trump’s Entry.
WLFI Holdings: $470,000 Invested For ~342,000 ONDO Tokens.
Thesis:
RWA Narrative Leader Trading At A High-Confluence Demand Zone – Fibonacci + Bullish OB + HTF Support All Stacking.
If Structure Flips Above $0.47, This Sets Up For A Multi-Leg Parabolic Move.
IMO: LSE:ONDO Is Currently On Sale With A ~90% Discount.
TA Only | NFA | Always DYOR
💬 Your LSE:ONDO Target? 👇
❤️ Like + RT + Bookmark

From $6 to $0.10 – The $5 Comeback Story Nobody's Talking About MIL:ENA : From $6 to $0.10 – The $5 Comeback Story Nobody's Talking About Yet
As Predicted, Price dumped 60% after breaking down from $0.24 support, now sitting at $0.10.
Current Status:
✅ $0.08–$0.10 = Prime accumulation zone activated
⚠️ Still possible dip to $0.06 (best long-term entry if it hits)
Long-Term Outlook: Potential target: $5+
This is where patience pays off. Down 94% from ATH means deep value territory but volatility remains high.
Risk Management:
➤ Only invest what you can hold 2-3+ years
➤ DCA strategy recommended
➤ Watch for $0.06 level confirmation
NFA. Always DYOR.

BITCOIN CRASH TO $40K INCOMING? Critical Levels You MUST Know!BITCOIN CRASH TO $40K INCOMING? Critical Levels You MUST Know!
Current Status: BTC forming Lower Lows & Lower Highs - Weakness Confirmed.
After breaking below $90K, Bitcoin tested sub-$70K as predicted, reaching a low of $59,809 yesterday before bouncing to $71,750. This volatility liquidated both high-leverage longs and shorts.
Key Levels to Watch:
Bearish Order Block: $77,516 - $79,290
Bearish Order Flow: $86,035 - $90,585
Expecting price to visit these levels before the next leg down.
Trading Plan:
✅ Short Entry Zones: $80K and $90K levels
✅ Strategy: Wait for price reaction at bearish order blocks
✅ Current LL Confirmation: Any HTF candle close above $79,290
Scenarios:
Bearish Case: If rejected from order blocks → Potential test of $50K-$40K range
Bullish Invalidation: HTF candle close above CHOCH at $97,900
Current LL at $59,809 NOT confirmed yet - waiting for HTF confirmation above $79,290.
Best Strategy: WAIT for clear confirmations at key levels before taking positions. Patience is key in this market structure.
Not Financial Advice & ALWAYS DYOR

$ADA ALTSEASON SETUP | 4,500%+ EXPANSION IF SUPPORT HOLDSCRYPTOCAP:ADA ALTSEASON SETUP | 4,500%+ EXPANSION IF SUPPORT HOLDS
#ADA Is Trading Inside A HTF Bullish OB After A ~93% Corrective Move From Its Local Macro High, Positioning Price At A Critical Accumulation Vs Invalidation Zone.
Technical Structure
✅ Previous Cycle ATH At $3.1 (+1,300% Expansion)
✅ BIG Correction PHASE: −78% From $1 Local High Within Last 6 Months
✅ Multi-Year Strong Support Holding Above $0.24 Level
✅ HTF Bullish OB Active At $0.18–$0.13
✅ Structure Remains Bullish As Long As $0.13 Holds (HTF Close)
✅ Strict STOP LOSS For High Risky Trader: $0.0755 (HTF Close)
Historical Context:
2021 Bull Run: +3,400% Expansion To $3.10
2021-2026 Correction: -92.89% Decline Into Accumulation Phase
HTF Demand Zone: $0.18–$0.13 (Accumulation & Liquidity Absorption)
Reclaim Zone: $0.4374 (Trend Confirmation Area)
Bull Market Expansion Targets: $1.20 → $3 → $5 → $10+ (Full Cycle Expansion Projection)
This $0.18–$0.13 Zone May Be The Last Accumulation Opportunity For ADA Bulls Before The Next Parabolic Phase.
Invalidation: Weekly Close Below $0.13
Disclaimer: This Is TA Only. Not Financial Advice. Always Do Your Own Research And Manage Risk.

$HYPE MASTERCLASS: 60% DOWN, 86% UP From My AnalysisGETTEX:HYPE MASTERCLASS: 60% DOWN, 86% UP - THIS IS WHY YOU FOLLOW THE CHARTS
Remember My Analysis? Let me Break Down the FULL Trade:
WHAT I CALLED ON 23 OCTOBER 2025:
➜ SHORT Setup Signal at $50
➜ Predicted Dump to $20
➜ Marked $20-$15 as PRIME Accumulation Zone
WHAT HAPPENED:
✅ Price dumped EXACTLY to $20
✅ 60% profit on SHORT from $50 to $20
✅ Strong Bounce from Predicted Accumulation Level
Now Trading at $35-$38 Which is 86% Profit on LONG From $20 Entry.
THE RESULTS:
If You Followed the Complete Plan:
✅ Booked 60% SHORT Profits
✅ Flipped to LONG at $20
✅ Now Sitting on 86% SPOT Gains (No Leverage!)
THE LESSON: This is What SMART Trading Looks Like:
Don't Buy Tops
Don't Sell Bottoms
NO FOMO
LONG TERM POTENTIAL: $50 / $100 / $200 / $500
Did You Catch BOTH Moves?
Not financial advice. ALWAYS DYOR.

CALLED ETH CRASH AT $3,700. NOW 65% DOWN. CALLED ETH CRASH AT $3,700. NOW 65% DOWN. ACCUMULATION ZONE ACTIVATED
REMEMBER MY WARNING?
When ETH Broke $3,700-$3,600 Support, I told you: "Major Breakdown Incoming"
THE RESULT:
✅ Entry Warning: $3,700
✅ Current Price: ~$1,700
✅ Total Drop From Our Entry: -54% (65% from Peak in Last 6 months)
ACCUMULATION ZONES:
✅ Zone 1: $2,000-$1,800 - FILLED (First Bids Triggered)
🎯 Zone 2: $1,400-$1,270 (0.786 Fib) - BIDS PLACED
→ This is maximum Pain Zone
→ Historical Bounce Level
→ Best Long-Term Entry
WHY I’M LONg-TERM BULLISH ON CRYPTOCAP:ETH :
→ U.S. ETH ETFs Have Accumulated 6M ETH ($55B) in ~18 months
→ Bitmine Continues aggressive Accumulation, Now Holding 4.28M ETH (~$13B+)
→ Combined with Other ETH-Strategy Firms, Institutions Now Control ~13M ETH
This Level of Structural, Long-Term Demand is Extremely Bullish for Ethereum’s Next Cycle.
Long-Term Targets: $10,000-$20,000 (5-10x Potential)
MY APPROACH:
1️⃣ Scale in Slowly (Not All-In)
2️⃣ Place Bids at Key Technical Levels
3️⃣ Let Market Come to Me
4️⃣ Think in Years, Not Weeks
THE MINDSET (THE REALITY):
❌ Most Bought at $3,700 (Greed)
✅ I'm Buying at $1,800 (Fear)
This is how generational wealth is built in crypto.
IMPORTANT:
This is NOT Short-term Trading, This is LONG-TERM Accumulation
65-80%% Corrections = Normal in Crypto
Next Bull Run = 500-1000% Moves
THE FIBONACCI PROOF:
0.618 Fib ($1,700) = Current Support Test
0.786 Fib ($1,270) = Maximum Opportunity
More Downside Possible Before Reversal.
But When $10K-$20K Hits, You'll Remember this Post.
NFA. ALWAYS DYOR. Scale in Smart.

OCTOBER 18: I CALLED $107K CRASH. TODAY: BITCOIN -44% AT $60K.OCTOBER 18: I CALLED $107K CRASH. TODAY: BITCOIN -44% AT $60K. RECEIPTS INSIDE.
They Called Me "FUD Spreader" When I Warned You On October 18, 2025.
Bitcoin Was At $107K.
Everyone Screamed "BUY THE DIP"
I Showed You The Bearish Divergence And Said: "Protect Your Capital."
THE NUMBERS DON'T LIE:
Bitcoin: $107,000 → $60,000
Total Drop: -44%
Short Profit: $47,000 Per BTC
IF YOU FOLLOWED THIS ANALYSIS:
✅ You Saved Your Portfolio From -44% Destruction
✅ You Made Massive Profits On The Short
✅ You're Now Positioned To Buy At 44% Discount
✅ You Ignored The Noise And Followed The Chart
WHAT HAPPENED:
Weekly Bearish Divergence ✓ CONFIRMED
$104K Support Breakdown ✓ BROKE
$73K Support Level ✓ SMASHED
$66K Zone ✓ CRUSHED
Now At $60K Testing Critical Support
WHAT'S NEXT:
$48K-$49K Zone Still In Play If $60K Breaks.
This Is NOT About Being Bearish.
This Is About PROTECTING CAPITAL And Buying Smart.
Bull Market Will Continue.
But Corrections Are PART Of The Journey.
Now You Can Start Accumulation Bitcoin From $60K Level Slowly
THE DIFFERENCE:
❌ Moonboys: "Buy At $107K, HODL Forever"
✅ Real Analysis: Save 44%, Re-Enter Lower
This Is Why Technical Analysis Matters.
This Is Why You Don't Follow Blind Hopium.
Drop Comment If You Followed This Call.
More Updates Coming. The Opportunity Isn't Over.

$ETH UPDATE: NOW 48% DOWN FROM MY WARNINGCRYPTOCAP:ETH UPDATE: NOW 48% DOWN FROM MY WARNING
When #ETHEREUM Broke $3,700-$3,600 Support, I warned you about a major breakdown.
✅ From $3,700 → $1,928 (48%) in Just 3 Months
✅ Previous Entry at $2,200-$2000 FILLED
NEW ACCUMULATION ZONE:
🔹 $2,000 - $1,500 (Start Building Positions)
🔹 $1,700 (0.618 Fib - Strong Support, Bid Placed)
🔹 $1,300 (0.786 Fib - Worst Case Scenario Bid)
Why I'm Still Confident:
→ $10K Target (5x from current levels)
→ $15K Target (Extended cycle target)
This is NOT for short-term trades.
This is LONG-TERM spot accumulation.
The best opportunities come when everyone else is fearful.
Fibonacci levels don't lie:
0.618 at $1,700 = Historical bounce zone
0.786 at $1,300 = Maximum pain / Maximum opportunity
My Approach:
Scale in. Don't all-in.
Place bids at key levels.
Let the market come to you.
Remember: In crypto, 500-1000% moves happen every cycle. But only for those who accumulate during fear, not FOMO.
NFA. ALWAYS DYOR.

CALLED IT - Bitcoin $107K TO $66K (-40% DROP) 🚨 CALLED IT - $107K TO $66K (-40% DROP)
Remember my warning on October 18, 2025?
When everyone was screaming "TO THE MOON" at $107K, I showed you the bearish divergence and said:
"$104K breakdown could trigger a crash to $73K and $49K."
👉 RESULT: Bitcoin dropped from $107K → $66,700
That's -40% Correction, EXACTLY as predicted.
🔰PROFIT BOOKED:
→ Short from $107K to $66,700
→ $40,000+ per CRYPTOCAP:BTC move captured
→ Those who followed saved their portfolio from -40% destruction
🔰 WHAT THE CHART SHOWED:
✓ Weekly bearish divergence confirmed
✓ $104K support trendline broken
✓ Support 1 ($73K) - SMASHED
✓ Now testing $66K-$68K zone
✓ Support 2 ($48K) still possible if this breaks
🔰 THE LESSON:
This is WHY I always tell you: Never blindly follow moonboys.
Everyone wants to hear "$200K coming" but nobody wants to hear "protect your capital."
Retracements happen in EVERY market. Even in bull runs.
Am I bullish long-term? YES.
Do I ignore warning signs? NEVER.
🔰 If you followed this analysis, you either:
Saved your portfolio from -40% crash
Made massive profit on the short
Bought the dip at better prices
This is the power of REAL technical analysis, not hopium.
👉 Share this with someone who needs to see it.
More updates coming. Stay connected.
