#BTC 🔴 H1 SHORT (BITCOIN) Possibly W1 PPR ⬇️Interesting developments in Bitcoin. It seems that they tried to break through 31k several times, but at the same time, the 30k resistance worked out many times.
But the last powerful impulse on the background of FUD took out the stops of all the longists, who stubbornly gained their positions in the LONG for a long time.
We have been moving in the H1 range for a whole week, and most likely, the last downward impulse predetermined the current situation in BTC.
At the D1 resistance, and the upper limit of the H1 range, a Double Top has formed, a Global Imbalance Level, which the price has already tested. And this gives an excellent signal to open a sell position. A retest of the imbalance is still possible, after which, with a high probability, we will go into the long-awaited correction, to the lower border of the H1 range (29982) and up to the previous Impulse Level (28737)
p.s. In addition, on W1 we have a hint of the formation of a Bearish PPR, the implementation of which will definitely send the price to the level of 28.8-28.6K.
p.p.s. In addition, the current Bitcoin Futures Contract on the Chicago Exchange expires on 07/01/2023. Accordingly, there should be significant volatility in the market.
input: 30605 (on unbalance retest)
stop: 31227
tp-1: 29982
tp-2: 28737
BITCOIN
Btc-bitcoin

BTC | 1H: Today PlanGM. Shorting from $27,000. Monday's range has formed. I'm expecting one more Dump to before Pump. CRYPTOCAP:BTC has yet to break the downtrend. Target is same 26k .Lets Dump it!
Previous day:
VAH: $26695
POC: $26412
VAL : $26344
Date: 20 June 2023

BTC | 1H: Today PlanSeems like a weekend scam pump. Now put it back down. I’ve placed short limit and targeting to 26k again. #Crypto is bullish, CRYPTOCAP:BTC long squeeze please!
Previous day:
VAH: $26095
POC: $25569
VAL : $25157
Date: 17 June 2023

BITCOIN (BTC) analysis by Elliott Wave theory on monthly basisSince 2017 starting point of BTC, it have Ist wave in triangle pattern (means mostly if 1 wave have triangle pattern then 3nd wave is longest which have completed in BTC & hit 3.618% of Fibonacci ratio. 4 wave taken more time consumed & 5th wave also complted as per elliott wave. then big correction has also done (a,b,c in form). hence total 08 wave have complted of elliott wave.
Note: Now new Impluse wave has started. if anyone buying BTC can this level this is only education purpose.
BITCOIN (BTC) analysis by Elliott Wave theory on monthly basis.
Triangle pattern
Triangle pattern
3.618% (64K) touched, fibonacci ratio point exactly
Corrective wave also completed through Elongated pattern
TARGET: Future target but take time (But it can in form of Impulse wave or in other wave. but this is right time to buy BTC

Btc Last Support To attract 31000$This is an educational idea only, do not take it as investment advice.
BTCUSDT looks range bound. If falls below 25800 we can see a fall upto 19800, if bounced back from 25800 we can see a rise upto 31000.
Let us connect and discuss more possibilities on day to day basis.
#btc CRYPTOCAP:BTC #crypto #sec #binance #bnbbull

BTC SHORT ELLIOT WAVEI don't know why othere are talking about head and shoulder patterns however market is in a downtrend and there is a clear elliot wave structure. Target profit level should be 25500 however it is likely that it will go even lower.

BTC Price Forecast till August 🐻Bitcoin Price Action Forecast till August 🐻
Looking Bearish to me !!

BTC long opportunity. Targets 31.4kAs we can see BTC has formed a hammer candle on a retest zone, We might hit a new higher high. If that happens we can surely lookout for long opportunity on next retest near 30460 or if it forms any bullish retest signal above that which will probably give the targets of 31432 & 32000. Let's see & wee.
Why?
Strong hammer on 78.60% fib.
We already have a breakout from a long & strong consolidation from 27.7k to 28.8k.
What can go wrong?
Wait for a new high. It is also possible to have a double top or head & shoulder near recent high level or before that.

btc breakoutbtc broken of 1 month range a smaller resistance and huge resistance.. breaking both of it

Bitcoin Next Step Fast SeeBTCUSDT UPDATE :
BTCUSDT Currently Trading Now $28069. BTCUSDT 1h Local Support At $27455-$27747. And Resistance At $27058-$28258.
According To Our Plan Now Bitcoin Will Dump Till $27500 Then We Can See Pump In BTCUSDT Price.

BTC.D Chart ideaBitcoin Is Moving Sideways. And BTC .D Decrease , So We Can See Pump In Alts
Thanks, Follow Me On Tradingview

Bitcoin chart , direction is clearas the upper line is working as a trend line for btc but not along with its range as the ends the market will move against the sentiments,
beware with your trade the fluctuation will not be slight , it would be highly volatile
for further details
stay connected and stay tuned
thanks!

BTCUSD : Looking for Long!BTCUSD is looking for long and formed larger flag with mass psychology within it.

THIS IS BITCOIN TETHERUSSo as you see on 4H there's CHoCH so I created first POINT OF INTEREST { POI } for long and now waiting for Mitigation so I placed an order for long! But then we saw a rejection on 16FEB23 21:30 with big candle and small body. Next day on 17FEB23 1:30 another HUGE RED CANDLE so I have to mark POI so I mark another POI and wait for Mitigate. MITIGATION means we have to wait for the market to come in the POI price entering the box is called MITIGATION.
18FEB23 1:30 price entered the box and we can see a price consolidate.
19FEB23 13:30 placed short entry and my SL is above New HIGH which created on 16FEB23 21:30 @25250
RRR 1:3
21FEB23 13:30 we saw a rejection again! REJECTION FROM PREVIOUS HIGH!!!
CORRECT ME IF I'M WRONG!!!

$BTC attempts to break my liquidity box$BTC has previously made three attempts to break the liquidity box but was unsuccessful in doing so. A rally to 29k can start with a close above 25.2k. Normally, it takes 4-5 solid volume attempts to crack a box like this.
Not a financial advice
Trade at your own risk

Bitcoin BTC monthly line five waves?Bitcoin BTC monthly five-wave? According to the five-wave model, there is one less wave. Can the monthly line go out of the fifth wave and the last wave in 2023?

ETHEREUM - Elliott Wave ViewThe idea is based on the Elliott Wave Theory. It suggests that the correction cycle may be over and the next bullish cycle could begin from here.


Bitcoin Expected MoveBitcoin Expected Move - BTC Creating Rising Wedge & This Should Be End 3rd Wave of Sub Wave A

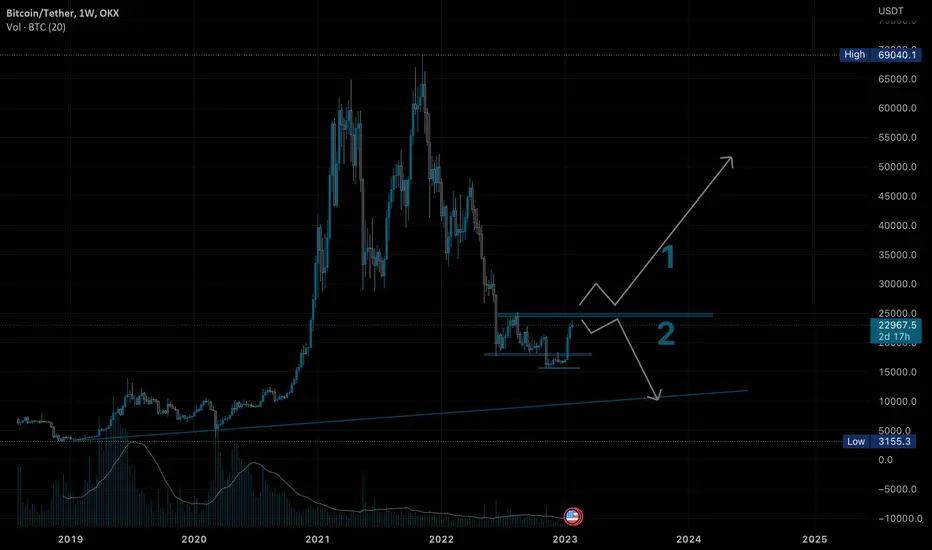
Bitcoin next move update1 or 2 ?
Lets not guess.
Lets react to the market
If guessing is the game i’l go with 1
#fingerscrossed
PPTUSDT : Looking for Long!PPTUSD is looking for a great buying opportunity after having descending channel & double bottom expecting TG to reach at 1.3$

Sell #BTC around 20900, SL 21070 & Target of 20450Sell #BTC around 20900, SL 21070 & Target of 20450, you can adjust to trailing SL every 100 or 150 point downside

Total market cap of cryptoIts a bullish sign of total market cap of crypto currency
Price is popping out of falling wedge and we can see a fake breakdown in weekly time frame
So it’s absolutely bullish sign
