Btc-bitcoin

Weekly analysis: would Bullish wave continue?Midterm forecast:
While the price is above the support 6000.00, resumption of uptrend is expected.
We make sure when the resistance at 9774.80 breaks.
If the support at 6000.00 is broken, the short-term forecast -resumption of uptrend- will be invalid.
Technical analysis:
While the RSI uptrend #1 is not broken, bullish wave in price would continue.
Price is below WEMA21, if price rises more, this line can act as a dynamic resistance against more gains.
Relative strength index (RSI) is 34.
Trade Setup:
We opened 10 BUY trade(s) @ 6715.85 based on 'Hammer' entry method at 2018.04.01.
Total Profit: 1144505 pip
Closed trade(s): 770015 pip Profit
Open trade(s): 374490 pip Profit
Closed Profit:
TP1 @ 7556.25 touched at 2018.04.12 with 84040 pip Profit.
TP2 @ 8180.60 touched at 2018.04.15 with 146475 pip Profit.
TP3 @ 9051.90 touched at 2018.04.24 with 233605 pip Profit.
TP4 @ 9774.80 touched at 2018.05.05 with 305895 pip Profit.
84040 + 146475 + 233605 + 305895 = 770015 pip
Open Profit:
Profit for one trade is 7340.00(current price) - 6715.85(open price) = 62415 pip
6 trade(s) still open, therefore total profit for open trade(s) is 62415 x 6 = 374490 pip
Take Profits:
TP5= @ 11600.00
TP6= @ 12670.65
TP7= @ 15308.00
TP8= @ 17095.65
TP9= @ 19704.20
TP10= Free


BTC afetr 24 hour boom or doom - REd line BTC afetr 24 hour boom or doom - REd line
set stop loss 7700

A Great Trading Opportunity to Buy in Zcash / Bitcoin ...Technical analysis:
. ZCASH/BITCOIN is in a Range Bound and Beginning of uptrend is expected.
. The price is above the 21-Day WEMA which acts as a dynamic support.
. The RSI is at 77.
Trade Setup:
We opened 9 Buy trade(s) @ 0.03571511 (day close price) based on 'Valley' at 05.14.2018 signaled by our "Daily Trading Opportunity".
Entry signal:
Signal to enter the market occurs when the price comes to "Buy zone" then forms one of the reversal patterns, whether "Bullish Engulfing" , "Hammer" or "Valley" , in other words,
NO entry signal when the price comes to the zone BUT after any of reversal patterns is formed in the zone.
Take Profits:
TP1= @ 0.043
TP2= @ 0.052
TP3= @ 0.062
TP4= @ 0.075
TP5= @ 0.093
TP6= @ 0.111
TP7= @ 0.137
TP8= @ 0.170
TP9= Free

There is a possibility for the beginning of uptrend in NEMBTC .Technical analysis:
NEM/BITCOIN is in a range bound and the beginning of uptrend is expected.
The price is below the 21-Day WEMA which acts as a dynamic resistance.
The RSI is at 41.
Trading suggestion:
The price is in a range bound, but we forecast the uptrend would begin.
There is a possibility of temporary retracement to suggested support zone (0.0000390 to 0.0000287). if so, traders can set orders based on Daily-Trading-Opportunities and expect to reach short-term targets.
Beginning of entry zone (0.0000390)
Ending of entry zone (0.0000287)
Entry signal:
Signal to enter the market occurs when the price comes to "Buy zone" then forms one of the reversal patterns, whether "Bullish Engulfing" , "Hammer" or "Valley" , in other words,
NO entry signal when the price comes to the zone BUT after any of reversal patterns is formed in the zone.
To learn more about "Entry signal" and special version of our "Price Action" strategy FOLLOW our lessons:
Take Profits:
TP1= @ 0.0000476
TP2= @ 0.0000578
TP3= @ 0.0000700
TP4= @ 0.0000828
TP5= @ 0.0000957
TP6= @ 0.0001370
TP7= Free

A Great Opportunity to Buy in DASHBTC , let's hunt together …Technical analysis:
DASH/BITCOIN is in a range bound and the resumption of uptrend is expected.
The price is below the 21-Day WEMA which acts as a dynamic resistance.
The RSI is at 47.
Trading suggestion:
The price is in a range bound, but we forecast the uptrend would resume.
There is a possibility of temporary retracement to suggested support zone (0.0455 to 0.0418). if so, traders can set orders based on Daily-Trading-Opportunities and expect to reach short-term targets.
Beginning of entry zone (0.0455)
Ending of entry zone (0.0418)
Entry signal:
Signal to enter the market occurs when the price comes to "Buy zone" then forms one of the reversal patterns, whether "Bullish Engulfing" , "Hammer" or "Valley" , in other words,
NO entry signal when the price comes to the zone BUT after any of reversal patterns is formed in the zone.
To learn more about "Entry signal" and special version of our "Price Action" strategy FOLLOW our lessons:
Take Profits:
TP1= @ 0.0502
TP2= @ 0.0571
TP3= @ 0.0630
TP4= @ 0.0727
TP5= @ 0.0920
TP6= @ 0.0972
TP7= Free

If you missed our first HUNT, you may want to check this!New trading suggestion:
*The price is in a range bound and we forecast the uptrend would resume.
* If you missed our first HUNT, you have a second chance to buy above suggested support line (0.000000504).
Entry signal:
Signal to enter the market occurs when the price comes to "Buy line" then forms one of the reversal patterns, whether "Bullish Engulfing" , "Hammer" or "valley" , in other words,
NO entry signal when the price comes to the zone BUT after any of reversal patterns is formed in the zone.
To learn more about "Entry signal" and special version of our "Price Action" strategy FOLLOW our lessons:
Trade Setup:
We opened 7 BUY trade(s) @ 0.000000399 (day close price) based on 2-day reversal candle (2-day Hammer ) at 03.30.2018 .
Total Profit: 1086
Closed trade(s): 498 Profit
Open trade(s): 588 Profit
Closed Profit:
TP1 @ 0.000000482 touched at 04.11.2018 with 83 Profit.
TP2 @ 0.000000549 touched at 04.15.2018 with 150 Profit.
TP3 @ 0.000000664 touched at 04.18.2018 with 265 Profit.
83 + 150 + 265 = 498
Open Profit:
Profit for one trade is 0.000000546(current price) - 0.000000399(open price) = 147
4 trade(s) still open, therefore total profit for open trade(s) is 147 x 4 = 588
All SLs moved to Break-even point.
Take Profit:
TP4= @ 0.000000757
TP5= @ 0.000000921
TP6= @ 0.000001075
TP7= Free
Technical analysis:
Dogecoin/Bitcoin is in a range bound and resumption of up trend is expected.
The price is below the 21-Day WEMA which acts as a dynamic resistance.
Relative strength index ( RSI ) is 48.

BATBTC , TP3 hit with 11162 profit. New Buy Opportunity..BASIC ATTENTION TOKEN / DOLLAR
New trading suggestion:
*The price is in an up trend and we forecast the uptrend would continue.
*There is possibility of temporary retracement to suggested support line (0.000032) , if so, traders can set orders based on Price Action and expect to reach short-term targets.
Entry signal:
Signal to enter the market occurs when the price comes to "Buy zone" then forms one of the reversal patterns, whether "Hammer" or "valley" , in other words,
NO entry signal when the price comes to the zone BUT after any of reversal patterns is formed in the zone.
To learn more about "Entry signal" and special version of our "Price Action" strategy FOLLOW our lessons:
Trade Setup:
We opened 6 BUY trade(s) @ 0.00002473 (day close price) based on 2-day reversal candle (2-day Hammer ) at 03.19.2018 .
Total Profit: 11162
Closed trade(s): 4181 Profit
Open trade(s): 6981 Profit
Closed Profit:
TP1 @ 0.000032 touched at 03.27.2018 with 727 Profit.
TP2 @ 0.000039 touched at 04.18.2018 with 1427 Profit.
TP2 @ 0.000045 touched at 04.18.2018 with 2027 Profit.
727 + 1427 + 2027 = 4181
Open Profit:
Profit for one trade is 0.000048(current price) -0.00002473(open price) = 2327
3 trade(s) still open, therefore total profit for open trade(s) is 2327 x 3 = 6981
All SLs moved to Break-even point.
Take Profit:
TP4= @ 0.000054
TP5= @0.000068
TP6= Free
Technical analysis:
Basic Attention Token/Dollar is in an up trend and Continuation of up trend is expected.
The price is above the 21-Day WEMA which acts as a dynamic support.
Relative strength index ( RSI ) is 86.

There is still possibility to buy in XRPBTC ...Technical analysis:
RIPPLE/BITCOIN is in a range bound and Beginning of up trend is expected.
The price is below the 21-Day WEMA which acts as a dynamic resistance.
The RSI is at 44.
Trading suggestion:
*The price is in a range bound, but we forecast the uptrend would begin.
*Price is in the support zone (0.00009 to 0.00006), traders can set orders based on Daily-Trading-Opportunities and expect to reach short-term targets.
Beginning of entry zone (0.00009)
Ending of entry zone (0.00006)
Entry signal:
Signal to enter the market occurs when the price comes to "Buy zone" then forms one of the reversal patterns, whether "Bullish Engulfing" , "Hammer" or "Valley" , in other words,
NO entry signal when the price comes to the zone BUT after any of reversal patterns is formed in the zone.
To learn more about "Entry signal" and special version of our "Price Action" strategy FOLLOW our lessons:
Trade Setup:
We opened 5 Buy trade(s) @ 0.00008110 (day close price) based on 'Hammer' at 04.12.2018 signaled by our "Daily Trading Opportunity".
Total Profit: 2135 pip
Closed trade(s): 0 pip Profit
Open trade(s): 2135 pip Profit
Open Profit:
Profit for one trade is 0.00008537(current price) - 0.00008110(open price)= 427 pip
5 trade(s) still open, therefore total profit for open trade(s) is 427 x 5= 2135 pip
Take Profits:
TP1= @ 0.000125
TP2= @ 0.000146
TP3= @ 0.000178
TP4= @ 0.000229
TP5= Free

A second chance to buy in SNTBTC..Status Network Token/Bitcoin
New trading suggestion:
*The price is in a range bound, but we forecast the uptrend would Resume.
*There is still possibility of temporary retracement to suggested support line(0.0000146), if so, traders can set orders based on Price Action and expect to reach short-term targets.
*If the support line at (0.0000146) is broken, the forecast (Resumption of uptrend) will be invalid.
*We will close our open trades, if the Midterm level (0.0000146) is broken.
Entry signal:
Signal to enter the market occurs when the price comes to "Buy zone" then forms one of the reversal patterns, whether "Bullish Engulfing" , "Hammer" or "Valley" , in other words,
NO entry signal when the price comes to the zone BUT after any of reversal patterns is formed in the zone.
To learn more about "Entry signal" and special version of our "Price Action" strategy FOLLOW our lessons:
Trade Setup:
We opened 8 BUY trade(s) @ 0.00001140(day close price) based on the reversal candle (2-Day Hammer ) at 03.27.2018.
Total Profit: 3650
Closed trade(s): 1230 Profit
Open trade(s): 2420 Profit
Closed Profit:
TP1 @ 0.00001260 touched at 03.31.2018 with 120 Profit.
TP2 @ 0.00001600 touched at 04.03.2018 with 460 Profit.
TP3 @ 0.00001790 touched at 04.21.2018 with 650 Profit.
120 + 460 + 650 = 1230
Open Profit:
Profit for one trade is 0.00001624(current price) -0.00001140(open price) = 484
5 trade(s) still open, therefore total profit for open trade(s) is 484 x 5 = 2420
All SLs moved to Break-even point.
Take Profits:
TP4= @ 0.0000237
TP5= @ 0.0000319
TP6= @ 0.0000374
TP7= @ 0.0000480
TP8= Free
Technical analysis:
StatusNetworkToken/Bitcoin is in a range bound and resumption of up trend is expected.
The price is below the 21-Day WEMA which acts as a dynamic resistance.
The RSI is at 51.

XMRBTC , TP3 hit with 2961600 profit. NEW Buy Opportunity...MONERO / BITCOIN
New trading suggestion:
*The price is in an up trend and we forecast the uptrend would continue.
*There is possibility of temporary retracement to suggested support line (0.026) , if so, traders can set orders based on Price Action and expect to reach short-term targets.
Entry signal:
Signal to enter the market occurs when the price comes to "Buy zone" then forms one of the reversal patterns, whether "Hammer" or "valley" , in other words,
NO entry signal when the price comes to the zone BUT after any of reversal patterns is formed in the zone.
To learn more about "Entry signal" and special version of our "Price Action" strategy FOLLOW our lessons:
Trade Setup:
We opened 6 BUY trade(s) @ 0.02503900(day close price) based on 2-day reversal candle (2-day Hammer ) at 03.28.2018 .
Total Profit: 2961600
Closed trade(s): 1008300 Profit
Open trade(s): 1953300 Profit
Closed Profit:
TP1 @ 0.0270 touched at 04.18.2018 with 196100 Profit.
TP2 @ 0.0278 touched at 04.18.2018 with 276100 Profit.
TP3 @ 0.0304 touched at 04.20.2018 with 536100 Profit.
196100 + 276100 + 536100 = 1008300
Open Profit:
Profit for one trade is 0.03155000(current price) - 0.02503900(open price) = 651100
3 trade(s) still open, therefore total profit for open trade(s) is 651100 x 3 = 1953300
All SLs moved to Break-even point.
Take Profit:
TP4= @ 0.0320
TP5= @ 0.0356
TP6= Free
Technical analysis:
Monero/Dollar is in an up trend and Continuation of up trend is expected.
The price is above the 21-Day WEMA which acts as a dynamic support.
Relative strength index ( RSI ) is 70.

A good opportunity to buy in KNCBTC , Don't miss it.KyberNetwork/Bitcoin
New trading suggestion:
The price is in an up trend and we forecast the uptrend would continue.
But there is possibility of temporary retracement to suggested support zone (0.000235 to 0.000187), if so, traders can set orders based on Daily-Trading-Opportunities and expect to reach short-term targets.
Beginning of entry zone (0.000235)
Ending of entry zone (0.000187)
Entry signal:
Signal to enter the market occurs when the price comes to "Buy zone" then forms one of the reversal patterns, whether "Hammer" or "Valley" , in other words,
NO entry signal when the price comes to the zone BUT after any of reversal patterns is formed in the zone.
To learn more about "Entry signal" and special version of our "Price Action" strategy FOLLOW our lessons:
Take Profits:
TP1= @ 0.000274
TP2= @ 0.000313
TP3= @ 0.000369
TP4= @ 0.000440
TP5= Free

If you missed our first HUNT, you may want to check this!New trading suggestion:
*The price is in an up trend and we forecast the uptrend would continue.
* There is still possibility of temporary retracement to suggested support lines (0.1610) & (0.1480), if so, traders can set orders based on Price Action and expect to reach short-term targets.
Entry signal:
Signal to enter the market occurs when the price comes to "Buy zone" then forms one of the reversal patterns, whether "Hammer" or "Valley" , in other words,
NO entry signal when the price comes to the zone BUT after any of reversal patterns is formed in the zone.
To learn more about "Entry signal" and special version of our "Price Action" strategy FOLLOW our lessons:
Midterm forecast:
While the level 0.1480 is not broken, the Midterm wave will be uptrend.
Price may also reach 0.1480, if price reaches this level, we may enter by Daily-Trading-Opportunities, this entry depends on personal strategies.
We will close our open trades, if the Midterm level 0.1480 is broken.
Technical analysis:
Price is above WEMA21, if price drops more, this line can act as dynamic support against more losses.
Relative strength index (RSI) is 70.
Total Profit: 52816 pip
Closed trade(s): 29326 pip Profit
Open trade(s): 23490 pip Profit
Trade Setup:
We opened 9 BUY trade(s) @ 0.09179 based on 'Valley' entry method at 2018.04.16.
Closed Profit:
TP1 @ 0.10400 touched at 2018.04.18 with 1221 pip Profit.
TP2 @ 0.12100 touched at 2018.04.20 with 2921 pip Profit.
TP3 @ 0.13300 touched at 2018.04.22 with 4121 pip Profit.
TP4 @ 0.14800 touched at 2018.04.23 with 5621 pip Profit.
TP5 @ 0.16100 touched at 2018.04.24 with 6921 pip Profit.
TP6 @ 0.17700 touched at 2018.05.06 with 8521 pip Profit.
1221 + 2921 + 4121 + 5621 + 6921 + 8521 = 29326 pip
Open Profit:
Profit for one trade is 0.17009(current price) - 0.09179(open price) = 7830 pip
3 trade(s) still open, therefore total profit for open trade(s) is 7830 x 3 = 23490 pip
Take Profits:
TP7= @ 0.2010
TP8= @ 0.2440
TP9= Free

There is possibility for the beginning of uptrend in BTGBTCTechnical analysis:
BITCOINGOLD/BITCOIN is in a range bound and beginning of up trend is expected.
The price is above the 21-Day WEMA which acts as a dynamic support.
The RSI is at 54.
Trading suggestion:
The price is in a range bound, but we forecast the uptrend would begin.
There is possibility of temporary retracement to suggested support zone (0.0076 to 0.0055), if so, traders can set orders based on Daily-Trading-Opportunities and expect to reach short-term targets.
Beginning of entry zone (0.0076)
Ending of entry zone (0.0055)
Entry signal:
Signal to enter the market occurs when the price comes to "Buy zone" then forms one of the reversal patterns, whether "Hammer" or "Valley" , in other words,
NO entry signal when the price comes to the zone BUT after any of reversal patterns is formed in the zone.
To learn more about "Entry signal" and special version of our "Price Action" strategy FOLLOW our lessons:
Take Profits:
TP1= @ 0.0124
TP2= @ 0.0150
TP3= @ 0.0180
TP4= @ 0.0230
TP5= @ 0.0260
TP6= @ 0.048
TP7= Free

Cardano would probably resume its uptrend again...Technical analysis:
CARDANO/BITCOIN is in an up Trend and resumption of up trend is expected.
The price is above the 21-Day WEMA which acts as a dynamic support.
The RSI is at 60.
Trading suggestion:
The price is in an up trend, but we forecast the uptrend would probably resume.
There is still possibility of temporary retracement to suggested support zone (0.0000250 to 0.0000170), if so, traders can set orders based on Daily-Trading-Opportunities and expect to reach short-term targets.
Beginning of entry zone (0.0000250)
Ending of entry zone (0.0000170)
Entry signal:
Signal to enter the market occurs when the price comes to "Buy zone" then forms one of the reversal patterns, whether "Hammer" or "Valley" , in other words,
NO entry signal when the price comes to the zone BUT after any of reversal patterns is formed in the zone.
To learn more about "Entry signal" and special version of our "Price Action" strategy FOLLOW our lessons:
Take Profits:
TP1= @ 0.0000300
TP2= @ 0.0000345
TP3= @ 0.0000455
TP4= @ 0.0000540
TP5= @ 0.0000689
TP6= @ 0.0000918
TP7= Free

There is possibility for the beginning of uptrend in NXSBTCTechnical analysis:
NEXUS/BITCOIN is in a range bound and beginning of up trend is expected.
The price is below the 21-Day WEMA which acts as a dynamic resistance.
The RSI is at 49.
Trading suggestion:
The price is in a range bound, but we forecast the uptrend would begin.
There is possibility of temporary retracement to suggested support zone (0.000193 to 0.000100), if so, traders can set orders based on Daily-Trading-Opportunities and expect to reach short-term targets.
Beginning of entry zone (0.000193)
Ending of entry zone (0.000100)
Entry signal:
Signal to enter the market occurs when the price comes to "Buy zone" then forms one of the reversal patterns, whether "Hammer" or "Valley" , in other words,
NO entry signal when the price comes to the zone BUT after any of reversal patterns is formed in the zone.
To learn more about "Entry signal" and special version of our "Price Action" strategy FOLLOW our lessons:
Take Profits:
TP1= @ 0.00026
TP2= @ 0.00036
TP3= @ 0.00046
TP4= @ 0.00056
TP5= @ 0.00095
TP6= Free

There is possibility for the beginning of uptrend in STRATBTCTechnical analysis:
STRATIS/BITCOIN is in a range bound and beginning of up trend is expected.
The price is above the 21-Day WEMA which acts as a dynamic support.
The RSI is at 70.
Trading suggestion:
The price is in a range bound, but we forecast the uptrend would begin.
There is still possibility of temporary retracement to suggested support zone (0.00063 to 0.00041), if so, traders can set orders based on Daily-Trading-Opportunities and expect to reach short-term targets.
Beginning of entry zone (0.00063)
Ending of entry zone (0.00041)
Entry signal:
Signal to enter the market occurs when the price comes to "Buy zone" then forms one of the reversal patterns, whether "Hammer" or "Valley" , in other words,
NO entry signal when the price comes to the zone BUT after any of reversal patterns is formed in the zone.
To learn more about "Entry signal" and special version of our "Price Action" strategy FOLLOW our lessons:
Take Profits:
TP1= @ 0.00079
TP2= @ 0.00103
TP3= @ 0.00128
TP4= @ 0.00162
TP5= @ 0.00243
TP6= @ 0.00320
TP7= @ 0.00468
TP8= Free

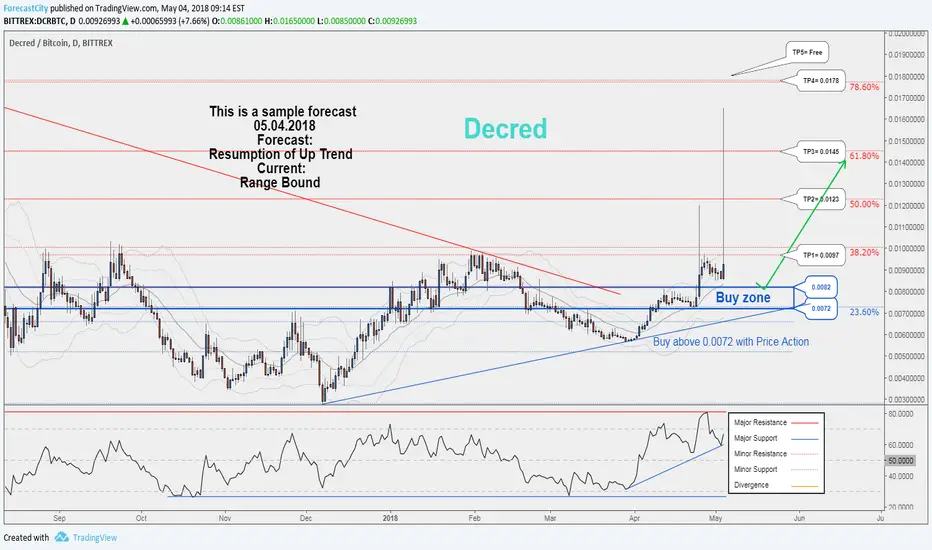
Decred would probably resume its uptrend again...Technical analysis:
DECRED/BITCOIN is in a range bound and Resumption of up trend is expected.
The price is above the 21-Day WEMA which acts as a dynamic support.
The RSI is at 66.
Trading suggestion:
The price is in a range bound, but we forecast the uptrend would probably resume.
There is possibility of temporary retracement to suggested support zone (0.0082 to 0.0072), if so, traders can set orders based on Daily-Trading-Opportunities and expect to reach short-term targets.
Beginning of entry zone (0.0082)
Ending of entry zone (0.0072)
Entry signal:
Signal to enter the market occurs when the price comes to "Buy zone" then forms one of the reversal patterns, whether "Hammer" or "Valley" , in other words,
NO entry signal when the price comes to the zone BUT after any of reversal patterns is formed in the zone.
To learn more about "Entry signal" and special version of our "Price Action" strategy FOLLOW our lessons:
Take Profits:
TP1= @ 0.0097
TP2= @ 0.0123
TP3= @ 0.0145
TP4= @ 0.0178
TP5= Free
There is possibility for the beginning of uptrend in LSKBTCTechnical analysis:
LISK/BITCOIN is in a range bound and beginning of up trend is expected.
The price is above the 21-Day WEMA which acts as a dynamic support.
The RSI is at 58.
Trading suggestion:
The price is in a range bound, but we forecast the uptrend would begin.
There is possibility of temporary retracement to suggested support zone (0.00122 to 0.00100), if so , traders can set orders based on Daily-Trading-Opportunities and expect to reach short-term targets.
Beginning of entry zone (0.00122)
Ending of entry zone (0.00100)
Entry signal:
Signal to enter the market occurs when the price comes to "Buy zone" then forms one of the reversal patterns, whether "Hammer" or "Valley" , in other words,
NO entry signal when the price comes to the zone BUT after any of reversal patterns is formed in the zone.
To learn more about "Entry signal" and special version of our "Price Action" strategy FOLLOW our lessons:
Take Profits:
TP1= @ 0.00156
TP2= @ 0.00173
TP3= @ 0.00220
TP4= @ 0.00288
TP5= @ 0.00336
TP6= Free

A Long-term Trading Opportunity To Buy for REPBTC ....Technical analysis:
AUGUR/BITCOIN is in a range bound and beginning of up trend is expected.
The price is above the 21-Day WEMA which acts as a dynamic support.
The RSI is at 59.
Trading suggestion:
The price is in a range bound, but we forecast the uptrend would begin.
There is possibility of temporary retracement to suggested support zone (0.0036 to 0.0027), if so , traders can set orders based on Daily-Trading-Opportunities and expect to reach short-term targets.
Beginning of entry zone (0.0036)
Ending of entry zone (0.0027)
Entry signal:
Signal to enter the market occurs when the price comes to "Buy zone" then forms one of the reversal patterns, whether "Hammer" or "Valley" , in other words,
NO entry signal when the price comes to the zone BUT after any of reversal patterns is formed in the zone.
To learn more about "Entry signal" and special version of our "Price Action" strategy FOLLOW our lessons:
Take Profits:
TP1= @ 0.0046
TP2= @ 0.0057
TP3= @ 0.0065
TP4= @ 0.0081
TP5= @ 0.0097
TP6= @ 0.0147
TP7= Free

There is possibility for the beginning of uptrend in VERIBTC...Technical analysis:
VERITASEUM/BITCOIN is in a range bound and beginning of up trend is expected.
The price is above the 21-Day WEMA which acts as a dynamic support and it touched the strong uptrend line in Daily Chart .
In RSI the downtrend was broken and "Bullish Exit" is occurred.
The RSI is at 51.
Trading suggestion:
The price is in a range bound, but we forecast the uptrend would begin.
There is possibility of temporary retracement to suggested support zone (0.0111 to 0.0080), if so , traders can set orders based on Daily-Trading-Opportunities and expect to reach short-term targets.
Beginning of entry zone (0.0111)
Ending of entry zone (0.0080)
Entry signal:
Signal to enter the market occurs when the price comes to "Buy zone" then forms one of the reversal patterns, whether "Hammer" or "Valley" , in other words,
NO entry signal when the price comes to the zone BUT after any of reversal patterns is formed in the zone.
To learn more about "Entry signal" and special version of our "Price Action" strategy FOLLOW our lessons:
Take Profits:
TP1= @ 0.0150
TP2= @ 0.0181
TP3= @ 0.0210
TP4= @ 0.0267
TP5= @ 0.0408
TP6= Free

Vechain would probably resume its uptrend again...Technical analysis:
VECHAIN/BITCOIN is in an up trend and Resumption of up trend is expected.
The price is above the 21-Day WEMA which acts as a dynamic support.
The RSI is at 71.
Trading suggestion:
The price is in an up trend, but we forecast the uptrend would probably resume.
There is possibility of temporary retracement to suggested support zone (0.00042 to 0.00032), if so, traders can set orders based on Daily-Trading-Opportunities and expect to reach short-term targets.
Beginning of entry zone (0.00042)
Ending of entry zone (0.00032)
Entry signal:
Signal to enter the market occurs when the price comes to "Buy zone" then forms one of the reversal patterns, whether "Hammer" or "Valley" , in other words,
NO entry signal when the price comes to the zone BUT after any of reversal patterns is formed in the zone.
To learn more about "Entry signal" and special version of our "Price Action" strategy FOLLOW our lessons:
Take Profits:
TP1= @ 0.00051
TP2= @ 0.00062
TP3= @ 0.000815
TP4= Free
