BITCOIN LONG IDEABTC seems to go for long to take liquidity,
Entry 63500 - 64000
Targets 67000, 70000, 73000
Stop 62500
Btc-bitcoin

$BTC | 1H: Today Plan:The local bottom has formed on the daily time frame for Bitcoin. Both spot and perp are showing continuous bids for Bitcoin, leading to higher highs.
The bulls are showing strength in lower time frames with the 50 & 200 EMA and the weekly open, aiming for at least 78k. Let's go! BINANCE:BTCUSDT
Previous Day:
VAH: $65184
POC: $64947
VAL : $65870
Date: 22 Apr 2024

#Bitcoin Bull Flag Analysis #Bitcoin Bull Flag Analysis
The #BTC Bull flag is currently holding $60,000 price Level.
A bull flag is forming with a target lying around $1,18,000
For this pattern to play out CRYPTOCAP:BTC must be above $60,000 Level.
Note: If break $60,000 level then ready for $45000
Like/RT if you agree

Bitcoin Red alertDon't get wrecked! #BITCOIN
Scalping with high leverages during times like these is a risky game. Market makers are toying with global sentiments, especially with the Big #BitcoinHalving just around the corner.
Cut through the noise; stick with spot trading exclusively.
Stay safe, earn safe.

BITCOIN BEARISH OUTLOOOKBitcoin Update: Key Alert!
Quick Analysis:
As previously highlighted, #Bitcoin remains under pressure. Staying below $67,900 has shown us there’s limited upward potential, and now it's more evident with the recent rejection from $67,000. Bitcoin is currently trading below $62,000, signaling a strong bearish trend.
Current Status:
Bearish Outlook: Bitcoin's failure to surpass $67,900 has set a bearish tone. Watch out as it now trades below $63,000, which might trigger further declines.
Support: $51,000
Resistance: $63,900 / $67,700
Suggestion for Traders
Monitor these crucial thresholds and adjust your trading plans accordingly.
Stay prepared for swift market movements.
CRYPTOCAP:BTC #Cryptocrash

Will Bitcoin Go Down? Bitcoin Market Quick Update Will Bitcoin Go Down? Bitcoin Market Quick Update
Bearish Signal: As long as Bitcoin stays under $67,900, it’s likely not going to climb much.
Possible Drop: If #Bitcoin can't rise above $67,900 soon, we might see its price go down to somewhere between $45,000 and $50,000.
Keep an eye on $67,900. Plan your trades and consider stop-losses to manage risk.

What's Next for Bitcoin? Understanding Its Current Price MovesWhat's Next for Bitcoin? Understanding Its Current Price Moves
#Bitcoin Market Brief
Current Status: CRYPTOCAP:BTC is trading near $64,000 amid recent declines. Bearish trends dominate due to global uncertainties affecting crypto markets.
Key Levels:
Support: Watch $63,800. Falling below could lead us to $51,000.
Resistance: Key resistance at $67,600. Below this, expect continued bearishness.
Observations: Recent charts show a trendline breakout and retest, suggesting a possible further drop. Stay alert to these patterns for trading cues.
Action Points: Maintain strict stop-losses to minimize risks. A break above $71,000 could shift momentum to bullish, signaling a potential new ATH.
Suggestion: Focus on technical analysis and update strategies with market changes. Keep an eye on global news that could sway crypto prices.
Looking Ahead: A climb over $71,000 might set the stage for new record highs.
Keep tuned for updates.
#BTC #Cryptocrash

BITCOIN BEARISH MODE SO READY FOR $50,000 ?#BITCOIN BEARISH ALERT
Market Status: Bearish
Key Observations:
Pattern Breakdown: Bullish Pennant formation has been compromised.
Trend Line Status: Currently trading below the key trend line.
Targets: $50,000
Condition:
This target is set under the condition that #BTCUSDT remains below $65,500.
Keep a close eye on the price movement. A sustained position below $65,500 could confirm the bearish momentum towards our target.
Stay tuned for further updates!
CRYPTOCAP:BTC #Cryptocrash

Bitcoin Symmetrical Triangle Fake breakout#BitcoinUpdate | CRYPTOCAP:BTC Trading Insights
Current Formation: CRYPTOCAP:BTC is sculpting a Symmetrical Triangle, suggesting a pivotal movement ahead.
Recent Activity: Noticed a Fake Breakout with $BTC/USDT, reverting to trade within the Symmetrical Triangle.
Bearish Alert: Caution if #BTC plunges below $65k. This level is a critical juncture for future trends.
Strong Support: Steadfast at $65,000. Bulls dominate above this threshold.
Trading Strategy: Hold your trades until a clear Symmetrical Triangle Breakout. Patience is key.
Bullish Outlook: An upward breakout could signify a monumental bull run for Bitcoin.
Engage & Share: RT/Like if you find this setup aligned with your market expectations. Let’s ride the wave together!

Bitcoin Elliott Wave Count ( bullish Toward $200k )#Bitcoin Elliott Wave Analysis CRYPTOCAP:BTC
According to Elliott Wave counting, if things go as predicted, we could see prices hitting $160,000 to $180,000 really soon
RT/Like if you Agree with My EW Setup
NFA #BTC

#Bitcoin Big Fight: Bulls vs. Bears ( Fresh Update )#Bitcoin Big Fight: Bulls vs. Bears ( Fresh Update )
Hey everyone! Right now, Bitcoin is at $66,233
Key Points:
Big Move Alert: If Bitcoin jumps over $70,500, we might just see it hit $100,000 super fast.
Bulls' Hope: Watch out for $62,500. If we stay above this, the bulls have a chance to keep the party going.
Bears' Target: If we fall under $62,500, we could be heading down to $50,000.
Important Levels:
Support (Bulls' Floor): $62,500
Resistance (Wall to Break): $71,000

#Bitcoin Halving Month is Almost Here #Bitcoin Halving Month is Almost Here
Less than 20 days to go!
Here's why this one's for the history books:
1⃣ First Highest weekly candle closed
2⃣ Smashed its All-Time High (ATH) right before the halving
3⃣ 7 straight months of green candles
This is a huge bullish signal!
#BitcoinHalving #Halving

#BITCOIN WEEKLY CANDLE ALERT #BITCOIN WEEKLY CANDLE ALERT
In just 7 hours, #BTCUSDT is on the brink of making history.
Aiming for its highest weekly/monthly close EVER, and the first ever above previous cycle's peak!
Previous Highest Weekly Close : $68,951
Need to Close above $69,000
Will #BTC make Highest Weekly/Monthly Candle ?
CRYPTOCAP:BTC

BTC BUY / SELL zonesHi !
BINANCE:BTCUSDT
BUY and SELL zones
Minimum Stop Maximum Take 💪
Thanks for 🚀 👍

#BITCOIN BREAKOUT CONFIRMED#BITCOIN BREAKOUT CONFIRMED
#BTC Turned into Bullish Mode.
Ready for New All Time High

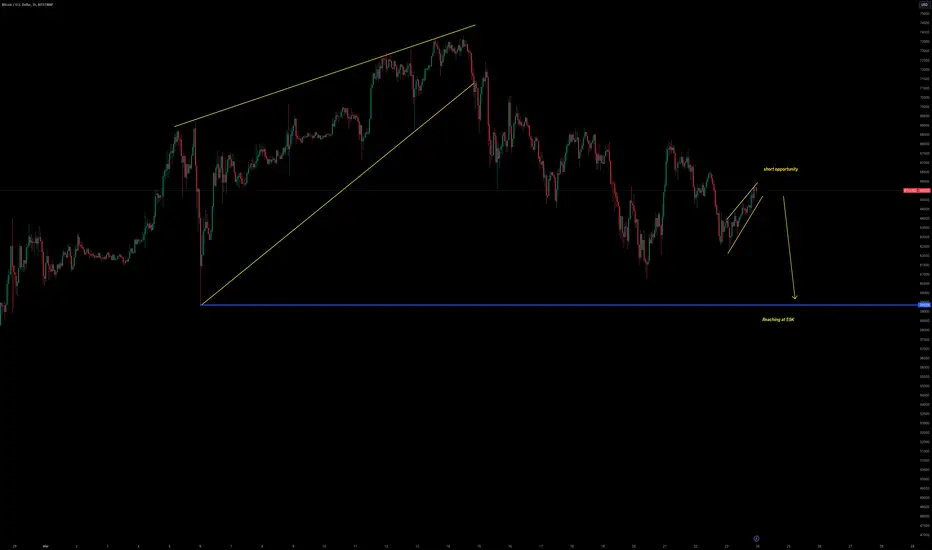
Movement to downsideBTCUSD is looking for short after making ascending channel & has clear formation to the downside.
BITCOIN BEARISH DUMP ALERT #BITCOIN BEARISH DUMP ALERT
1⃣ CRYPTOCAP:BTC Trying to Break Strong Support $61600
2⃣ If $61600 Level Break then Ready for $50700 & $40500
3⃣ Below Red RedLine #BTC is Bearish
4⃣ Keep an Eye on Red Circle is a Critical Zone
5⃣ Overall BTCUSDT Current Trend is Bearish

Looking for short!BTCUSD is looking for short after forming ascending channel & expecting a movement to the downside at 59K

Charting the Future: $BTC HTF Analysis (2024-2026)Bitcoin recently hit a new ATH of around $74k and is now showing signs of forming a local top before a potential correction. There is a significant amount of liquidation expected below $50,700.
The next $Bitcoin halving is predicted to occur on April 21, 2024. The first support level is at 60k, followed by support around 40k. A correction to 50k is expected before potentially reaching 100k.
Buying below 60k could be a good opportunity. Sell after the second quarter of 2025. In my opinion, do your own research before making any decisions. Good Luck! CRYPTOCAP:BTC

BITCOIN Rising Wedge Bearish AlertBreaking: #BITCOIN Broken Rising Wedge Support
1⃣ CRYPTOCAP:BTC Broken Rising Wedge Support $70600
2⃣ Bearish Scenario if not Break $73500 Resistance
3⃣ Retest = $72500 And Target = $52500
4⃣ Trade with Confirmations and Never Trade Blindly and High Leverage

AVAX/USDT Is super Potential as per chart analysis CRYPTOCAP:AVAX Ready for $270 in Bull Run?
1⃣ #AVAX Forming Bull Flag in HTF
2⃣ Breaking out Flag resistance
3⃣ As per Bull Flag Pattern target will be $269
4⃣ For Bull Zone Weekly Candle must hold above $32
5⃣ If 1,2,3 Fractals works then AVAX/USDT will be Super Bullish
6⃣ #Avalanche is a layer-1 blockchain
#cryptomarket

$BTC | 1H: LTF Plan:
1 CRYPTOCAP:BTC = $100,000. Above 70k bitcoin is extremely bullish, with another all-time high reached today.
While some pullback is expected, it's likely to set the stage for another impressive pump. Send it to 75k!
Previous Day:
VAH: $69826
POC: $69418
VAL : $68980
Date: 11 Mar 2024

BITCOIN 2025 ROADMAP for BULL RUN#BITCOIN SUPER BULLISH ROADMAP
1⃣ CRYPTOCAP:BTC Forming Inverse H&S ( IMO )
2⃣ Strong NECK LINE Resistance at $69,000
3⃣ If Rejected from NECK LINE Resistance then We can see Right Shoulder in Play
4⃣ If Right Sholder play then Buying Range will be $35000-$30,000 = Strong Support
5⃣ If #BTCUSDT Play Inverse H&S Pattern Then Target for Bull Market will be $2,50,000
Like and Share if you Want Bitcoin at $250k
