$AKT Could Be the Next 10x AI Coin – Here’s Why I’m Bullish Now!CSEMA:AKT Could Be the Next 10x AI Coin – Here’s Why I’m Bullish Now!
Looking to buy CSEMA:AKT in the $1.50–$1.20 zone — strong support + FVG. If price dips, I’ll accumulate.
➡️ Support: $1.50–$1.20
➡️ Resistance: $2 — breakout could send it flying
➡️ Targets: $5 / $10 / $15
➡️ Invalidation: Below $0.80 = bearish shift
Why I’m Bullish:
Decentralized cloud disrupting big tech. Surging demand from AI workloads. Now supports NVIDIA GPUs, and gaining strong traction in AI & Cosmos communities.
A breakout above $2 could lead to massive upside and High Chances to Hit $10+
— DYOR | NFA
BTC-D

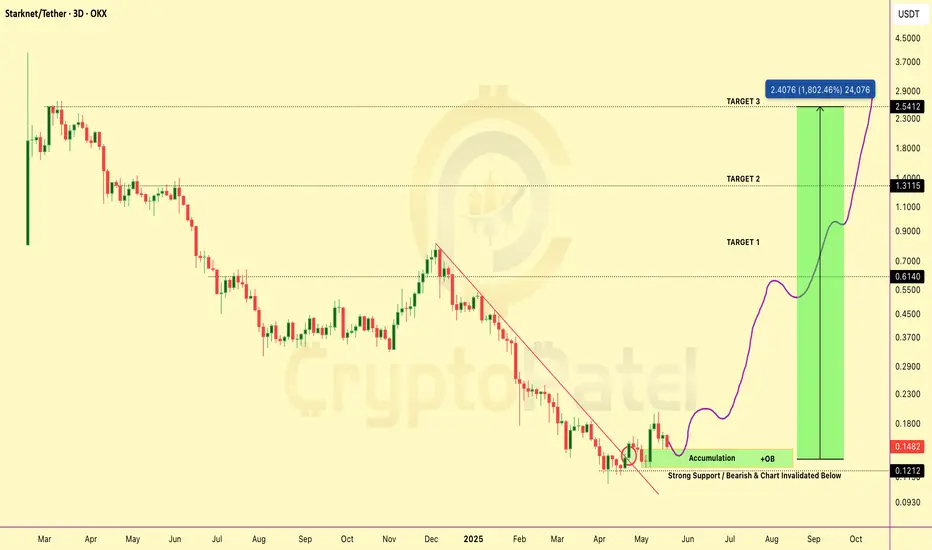
$STRK Technical Setup – 10x–20x Potential Loading🚨 NASDAQ:STRK Technical Setup – 10x–20x Potential on the Table
#Starknet has broken structure and is now retesting the bullish order block zone — classic PA move before the next leg up.
📌 Accumulation Zone: $0.15–$0.13 (Bullish OB)
🔄 Retest in progress – holding above OB confirms strength
🎯 Targets: $0.60 / $1.30 / $2.50
❌ Invalidation: Clean break below $0.12
Structure remains bullish — expecting continuation if OB holds.
High R:R setup. Eyes on it!
Note: This is Not Financial Advice so DYOR before investing in Any Cryptocurrencies.
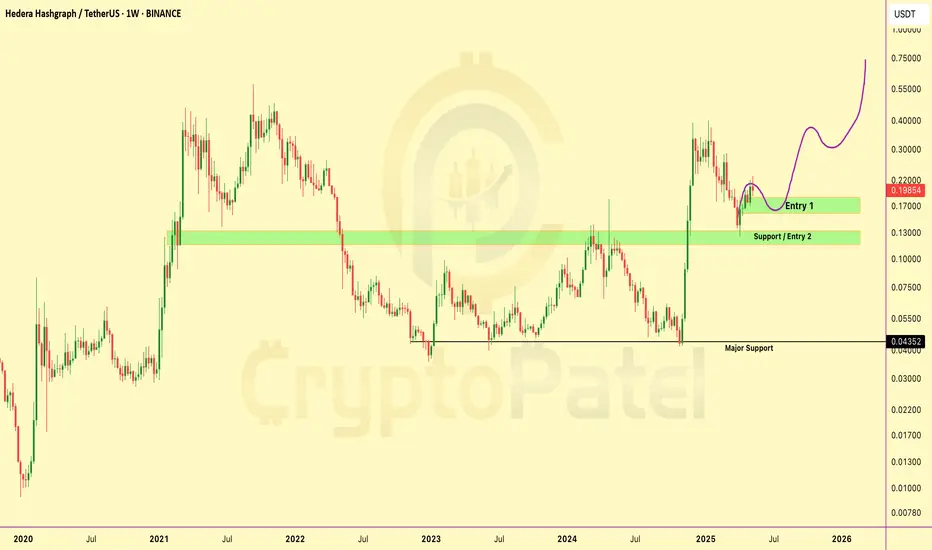
HBAR/USDT Chart Analysis and Price ProjectionMassive CRYPTOCAP:HBAR Rally Loading – Only If This Zone Holds!
Price is holding the critical support at $0.130 — a confirmed base here could trigger a major upside move toward $0.50–$1 🚀
▶️ Accumulation Zone: $0.180–$0.160
▶️ Invalid below $0.124
▶️ Above = ultra bullish structure in play!
DOGECOIN MEGA Bullish In Altseason CRYPTOCAP:DOGE is looking MEGA BULLISH! 🚀
Already did 700% from our first entry and still 300% up — plus it’s now 68% up from our Recent 2nd entry!
Chart shows strong bullish structure — higher highs, clean pullbacks, and massive community momentum backing it up. This bull run, #DOGE has real potential to hit:
▶️ Targets: $0.5 / $1
▶️ Long-Term: $1 / $2 / $3+
The meme king isn’t done — this could be just the beginning! 👑
👉 Are you holding DOGE/USDT?
Like & Retweet if you believe #DOGECOIN will hit $1 this cycle!

EOS Super bullish toward $10 because WLFI Buying$EOS/USDT Weekly Technical Breakdown
🔰 Price Action:
EOS is currently trading at $0.85, following a rejection from the key weekly resistance zone between $1.24–$1.31. This zone has acted as a historical supply area, and the failure to break above it has triggered a short-term corrective move.
🔰 Bullish Development:
EOS has recently broken out of a multi-year falling wedge pattern, signaling a potential long-term trend reversal. Post-breakout, the asset is now retesting lower levels — a common occurrence before continuation.
🔰 Key Demand Zones:
Primary Accumulation Zone: $0.83–$0.69
Major Weekly Support: $0.47–$0.40
These zones coincide with historical consolidation and low-volume nodes, making them ideal for long-term positioning.
🔰 Institutional Interest:
Trump-backed World Liberty Financial has accumulated 3.64M NYSE:EOS for 3M USDT, with an average entry at $0.824 — aligning perfectly with the current range. This reinforces the strength of the accumulation zone and may signal smart money inflow.
🔰 Upside Resistances to Monitor: $2.87 / $5.03 / $10.57 / ATH: $14.90
NYSE:EOS is showing signs of structural reversal on the HTF. As long as the price holds above the $0.69 base, bullish continuation remains valid. A reclaim and weekly close above $1.31 could trigger the next impulsive leg toward $5+.

BTC/USD DAILY PLAN – Will Bitcoin Hit 110K Before Reversing?BTC/USD DAILY PLAN – Will Bitcoin Hit 110K Before Reversing?
After a strong bullish impulse, BTC is now consolidating in a tight range between 103K–106K on the H4 chart. The ascending parallel channel remains intact, but bullish momentum is fading — a sign of potential distribution at the top.
🧠 Macro Context
BTC pumped recently thanks to ETF news and institutional inflows.
However, volume is decreasing, suggesting smart money may be offloading.
DXY and U.S. bond yields are ticking up → this could add pressure on BTC in the short term.
📊 Technical Outlook (H4 Chart)
BTC remains inside an ascending channel. Key levels to watch:
🔺 Resistance:
106,000 – local range high (H4)
110,576 – extended target if price breaks out
🔻 Support:
101,775 – bottom of current range; a breakdown here confirms weakness
94,473 – strong demand zone + EMA200
84,371 – key structural support zone if deeper correction occurs
⚠️ BTC may fake a rally toward 110K and then reverse sharply if broader macro conditions worsen.
🎯 Trading Scenarios
🔹 SCALP BUY:
Entry: 101,800 – 102,000
Stop-Loss: 100,800
Take-Profits: 103,200 → 104,000 → 105,000 → 106,000
Only enter long if price holds above 101.7K and shows strong rejection candles.
🔸 SELL ZONE:
Entry: 110,000 – 110,500
Stop-Loss: 111,200
Take-Profits: 107,000 → 105,000 → 101,775 → 94,473
Watch for exhaustion or false breakout patterns at this psychological zone.
🟢 LONG-TERM BUY ZONE:
Entry: 94,500 – 94,000
Stop-Loss: 92,500
Take-Profits: 96,000 → 98,000 → 100,000 → 103,000
Ideal for swing entries if BTC retraces into the broader demand zone.
⚠️ Key Notes:
BTC is showing signs of “rise slowly – dump fast” behavior.
Keep close watch on 101,775 – a decisive level for intraday direction.
No Fed rate cuts in sight → big money may still stay cautious.
✅ Conclusion:
Stick to trading range setups: BUY at channel base – SELL at distribution zones
Avoid FOMO and only enter trades after clear price action confirmation.
Risk management is essential during this high-trap environment.

Chainlink (LINK) – Momentum Shift with Strong EMA ReclaimLINK is showing a clear structural shift, having reclaimed both the 20-week and 200-week EMAs, signaling a potential transition from accumulation to expansion. The recent sweep of liquidity near $14 further strengthens the bullish case.
This setup provides a clean opportunity to enter on retracement to support, with solid upside if the momentum holds.
🔹 Entry Zone:
$13.00 – $13.50 (support + previous liquidity sweep zone)
🎯 Take Profit Targets:
🥇 $20 (HTF resistance)
🥈 $25 (macro range mid/high)
🥉 $30 (prior major resistance)
🛑 Stop Loss:
Daily close below $12.00 (structure invalidation)

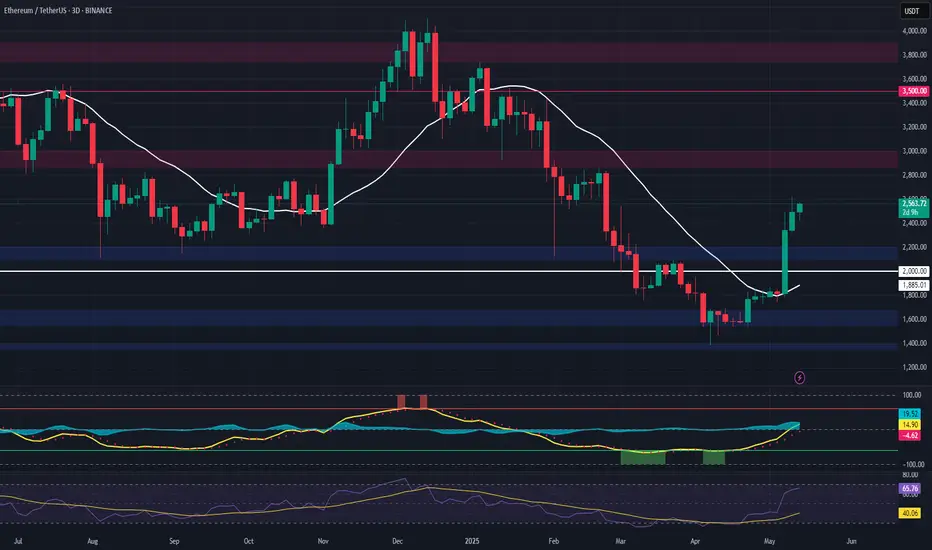
Ethereum (ETH) – Early Recovery Setup After Liquidity SweepEthereum has printed a bullish deviation below key liquidity ($1,500) and reclaimed the 20-day EMA, flipping prior resistance into support — a classic signal of early reversal momentum.
We're now watching for a pullback into the $2,100–$2,200 demand zone to offer an optimal spot entry before a potential move into higher timeframe targets.
🔹 Entry Zone:
$2,100 – $2,200 (pullback into reclaimed support/demand)
🎯 Take Profit Targets:
🥇 $3,000
🥈 $3,500
🥉 $3,900
🛑 Stop Loss:
Close below $2,000 (to invalidate reclaim of structure)
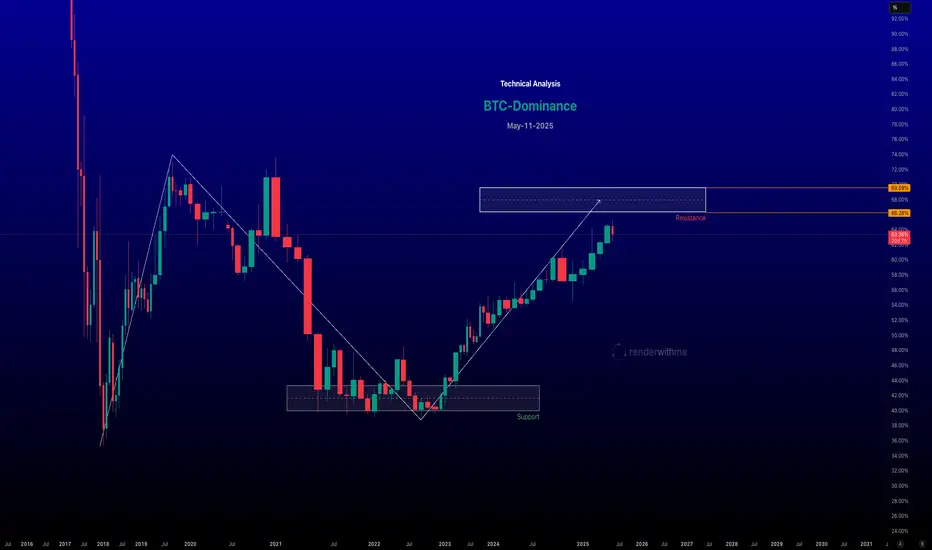
Bitcoin Dominance (BTC.D) waiting for the level to hitBitcoin Dominance (BTC.D) measures Bitcoin’s market capitalisation as a percentage of the total cryptocurrency market cap. It’s a key metric for understanding market sentiment, reflecting whether investors favor Bitcoin (BTC) over alt coins or vice versa. Technical analysis of BTC.D involves studying its chart patterns, indicators, and levels to gauge potential market trends, such as Bitcoin strength or alt coin season.
Chart for your reference
BTC Bulls Must Defend $103K… Or Say Hello to $99K Again Bitcoin completed a clear 5-wave Elliott Impulse and is now forming an ascending wedge (abcde structure), typically hinting at a possible correction.
Key Levels to Watch:
🔴 Key Bull Level: $103,085 – must hold to maintain bullish structure
🟠 Support 1: $99,265 – breach = deeper pullback
🟡 Support 2: $95,965 – last stronghold for bulls
Outlook:
🔼 A breakout above the wedge = continuation toward $110K+
🔽 Breakdown below $103K = expect correction toward lower supports
Strategy:
➡️ Wait for confirmation. A wedge breakdown = potential short trade setup.
➡️ Breakout = bullish continuation. Always manage risk wisely.
Stay sharp, traders!

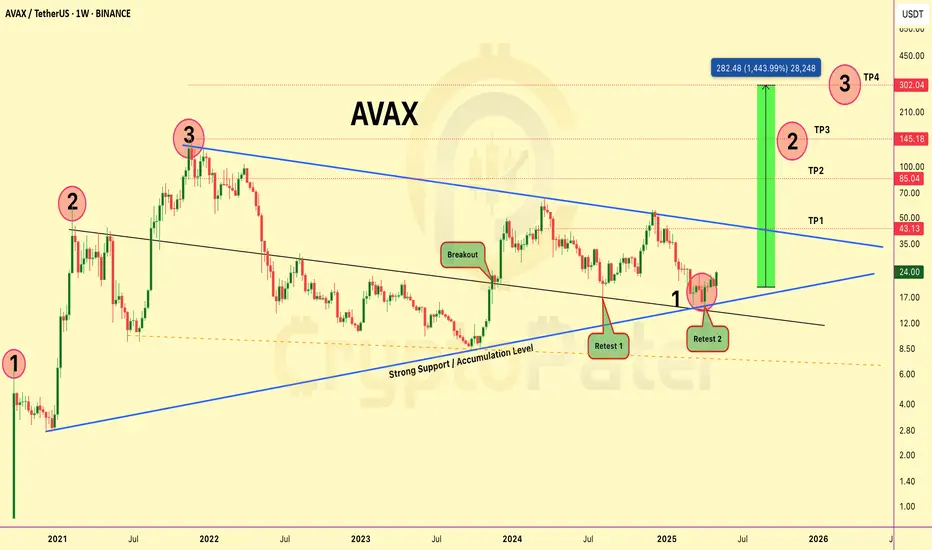
$AVAX Weekly Chart Update – Massive Breakout Brewing!🚨 CRYPTOCAP:AVAX Weekly Chart Update – Massive Breakout Brewing!
#AVAX is showing a textbook falling wedge breakout on the weekly timeframe, and the setup looks 🔥 for a potential 10x+ move!
Here’s what’s happening:
✅ Structure: Multi-year falling wedge since 2021
✅ Breakout: Confirmed in late 2023
✅ Retests: ✅ Retest 1 & ✅ Retest 2 both held perfectly
✅ Support Zone: Strong accumulation by big players
✅ Accumulation Zone: $24-$20 — still in early entry zone!
🔰 Targets: $43/$85/$145/$302+ (Cycle extension target)
▪️ Measured move suggests +1400% upside potential
▪️ This is one of those charts you don’t want to ignore. Accumulation is likely done. Smart money already positioned. Now it’s about patience and trend continuation.
Chart looks ready. Momentum building. Are you riding this AVAX train? 🚀
BTC/USD – Daily Trade Plan | 10 May 2025🟢 BTC/USD – Daily Trade Plan | 10 May 2025
"Breakout Incoming? Price Coiling Tighter Near Key Resistance!"
🔍 Market Overview:
Bitcoin has shown strong upward momentum after breaking past the $99,000 mark, reaching a short-term high at $104,269.47. Since then, price has consolidated within a narrowing range. The daily structure remains bullish, but short-term selling pressure is visible — especially ahead of the weekend and macro uncertainty.
🧭 Technical Landscape:
🔺 Resistance Zones:
$104,269.47 – Local top, price has failed to break this level several times.
$105,765 – $106,917 – Previous rejection zone + Fibonacci confluence.
$108,045 – Possible extension target if breakout confirms.
🔻 Support Zones:
$102,301 – Immediate intraday support; likely first retest.
$99,379 – Strong mid-range support, aligned with Moving Average & FVG.
$97,093 – Long-term trendline & high-demand zone.
📊 Scenario 1: Bullish Breakout Continuation
If BTC holds above $102,300 and breaks H4 resistance:
🔵 Buy Entry: $102,500 – $102,300
🎯 Targets: $104,000 → $105,700 → $106,900 → $108,000
🛑 Stop Loss: $101,800
📉 Scenario 2: Liquidity Grab & Deep Pullback
If BTC loses $102,300 support, expect a move to collect liquidity around $99K:
🔵 Buy Entry: $97,200 – $97,000
🎯 Targets: $99,000 → $101,000 → $102,500
🛑 Stop Loss: $96,400
⚠️ Key Market Considerations:
🧊 DXY Recovery: Short-term USD strength may cap BTC upside.
🏦 Fed Policy Tone: Remains hawkish. Any USD volatility can shift crypto sentiment.
🔼 Long-Term Trend: Still bullish. Focus on buy-the-dip setups rather than chasing highs.
📝 Final Thoughts:
Bitcoin is entering a coiled zone, awaiting high-volume confirmation. Breakouts or sharp rejections from the current range will decide the next leg.
🚀 Stay patient — Wait for clean candle closes (H4 preferred)
🔒 Stick to your SL/TP — Discipline defines success
💡 Avoid mid-range FOMO. Let price tell the story.

Ethereum Wyckoff Accumulation – Weekly Chart BreakdownEthereum Wyckoff Accumulation – Weekly Chart Breakdown
ETH is showing a textbook Wyckoff Accumulation pattern playing out on the 1W timeframe — and if it holds, we could be gearing up for a major breakout rally in the coming months.
Phase Breakdown:
✅ Phase A: Selling Climax (SC) marked the bottom. Automatic Rally (AR) set the resistance. Secondary Tests (ST) confirmed demand at lower levels.
✅ Phase B: Smart money accumulated heavily within the range — no directional move, just shakeouts and traps.
✅ Phase C: The Spring — price dipped below support to liquidate weak hands. Classic bear trap.
✅ Phase D (NOW): Recovery begins. If we see a Sign of Strength (SOS) above resistance with volume, Phase E (markup) is confirmed.
✅ Phase E: Full breakout mode. Higher highs, higher lows. Price discovery.
🟢 Accumulation Zone: $1,600–$1,300
🟢 Key Resistance: ~$3,600–$4,000
🟢 Projection Zone: $4,800 to $7,800+ (if SOS confirms)
✅ Bias: Bullish
Note: Watch for a clean breakout above the resistance zone. Low volume pullbacks = strength.
This is the kind of setup you don’t want to ignore.

Bitcoin At Big Resistance level so What Next?#BTC/USDT Update – Price at Critical Resistance
The chart structure remains unchanged from our previous update.
🔸 After entry, price dipped ~5% below our zone, but has now printed a strong bullish candle, signaling potential upside momentum.
🔸 However, Bitcoin is currently trading at the upper boundary of the ascending channel, acting as resistance.
Key Level to Watch:
If the HTF candle closes above $99,500, it will signal strength, and I’ll consider closing short positions and initiating fresh long setups.
Important Note:
The current pattern resembles a liquidity trap, not a clean bullish continuation. That’s why I remain cautious.
✅ Plan:
🔸 Wait for confirmation > $99,500
🔸 Use tight stop-loss – no blind trades.
Stay sharp, monitor price action closely.

Will Ethereum Break $1875 Resistance this Time?🚨 BREAKOUT WATCH: If Ethereum breaks above the key $1875 resistance, it opens the door for a bullish rally toward $3000 in the coming weeks.
Strong breakout = high momentum setup.

Bitcoin Ready to Dump Again till $85000?CRYPTOCAP:BTC just tapped a key Short POI near resistance!
Bears stepping in hard below $99,550 — this is prime sniper zone.
▶️ Trade Setup (SMC x ICT):
▶️ Entry: $93,800–94,200
▶️ Targets: $90,000 → $86,000
▶️ Stop Loss: $99,600 (above structure)
Liquidity swept ✅
FVGs below ✅
Momentum shifting ✅

Will Veracity Give 40x Return in Near Future?NASDAQ:VRA Targeting ATH Again – Potential for Huge Gains from Current Levels!
Weekly candle breaking major resistance at $0.0025. If price holds above this level, expect a strong upward move.
Potential Target: 40x from resistance if it hits the previous ATH!
Best Accumulation: FVG: $0.002183 - $0.001639
Perfect entry if price retraces to this level!

PLAN BUY ETH NEW WEEK✅ Scenario 1 – Buy at 1830 (Current Price):
Reason to Buy:
Price is close to the EMA 20 and EMA 33 levels – acting as dynamic support.
The 1830–1845 area has been tested multiple times without a clear breakdown.
The upward trendline from the 1720 low is still being respected.
The market may be forming a tight consolidation, preparing for a breakout.
Trading Plan:
Buy Entry: 1,830 USDT
Stop Loss (SL): below 1,800 (around 1,790–1,795)
Take Profit (TP): 1,980 – 2,150 (previous highs and major resistance zone)
Risk/Reward Ratio: Approximately 1:2.5 to 1:4 (excellent if breakout confirms)
⚠️ Scenario 2 – Buy at 1,740 (If Current Trendline Fails):
Reason to Buy:
The 1,740–1,760 zone is a strong support from the longer-term ascending trendline (black line).
Coincides with the EMA 200 on the 4H timeframe – a typical retracement zone during pullbacks.
Potential for a double-bottom pattern if price reacts positively here → forming a higher low.
Trading Plan:
Buy Entry: 1,740 USDT
Stop Loss (SL): below 1,700 (around 1,695)
Take Profit (TP): 1,920 – 2,000 – 2,150
Risk/Reward Ratio: Greater than 1:3 if ETH maintains its higher-low structure
🧠 Strategy Notes:
In both scenarios, ETH must break through the psychological resistance of 1,850–1,880 to confirm bullish momentum.
Volume during the current accumulation phase is relatively low, signaling a potential breakout waiting to happen – watch for large-volume candles on H4/H1.
The long red candle near 1,800 might have been a “bear trap” if the price doesn’t break below recent lows.

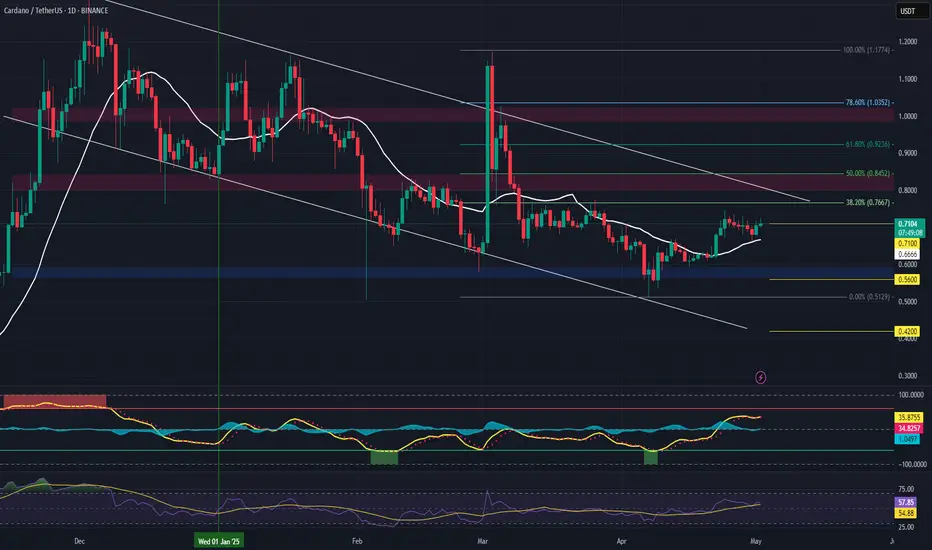
ADA (Cardano) Short Setup – Rejection from Major ResistanceADA is approaching a key resistance zone around the $0.84 level, which aligns with the 50% Fibonacci retracement and yearly open, showing signs of buyer exhaustion and weak momentum.
🔹 Entry:
$0.84 zone (watch for rejection w/ bearish confirmation candle or failed breakout)
🎯 Take Profit Targets:
🥇 $0.71
🥈 $0.56
🥉 $0.42
🛑 Stop Loss:
$0.92 (above key resistance/invalidates setup)
AVAX Trade Setup – Support Zone Long OpportunityAvalanche (AVAX) has pulled back and is now approaching a key support area, offering a high-reward swing setup if bulls defend the level.
🔹 Entry Zone:
$20.00 – $21.00 (Support Zone)
🎯 Take Profit Targets:
🥇 $22.50 – $24.00
🥈 $27.00 – $29.00
🛑 Stop Loss:
Just below $18.50

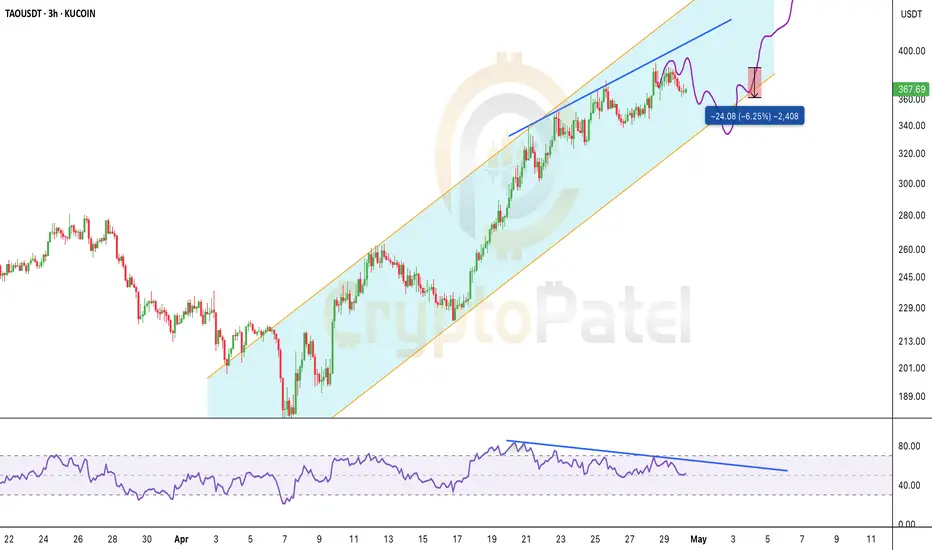
$TAO Update ( 6.20% Down From Our Entry)GETTEX:TAO Update ( 6.20% Down From Our Entry)
Short entry at $385 — triggered perfectly.
Price hit $386 before dropping — now down 6.2% from entry.
▶️ Bearish Divergence still valid
▶️ FVG rejection confirmed
▶️ Holding below $390 = bearish bias intact
Not financial advice — but never be greedy.
✅ Consider partial profits
🔁 Adjust SL to $400 from $410 if managing tighter risk
Let the setup work.
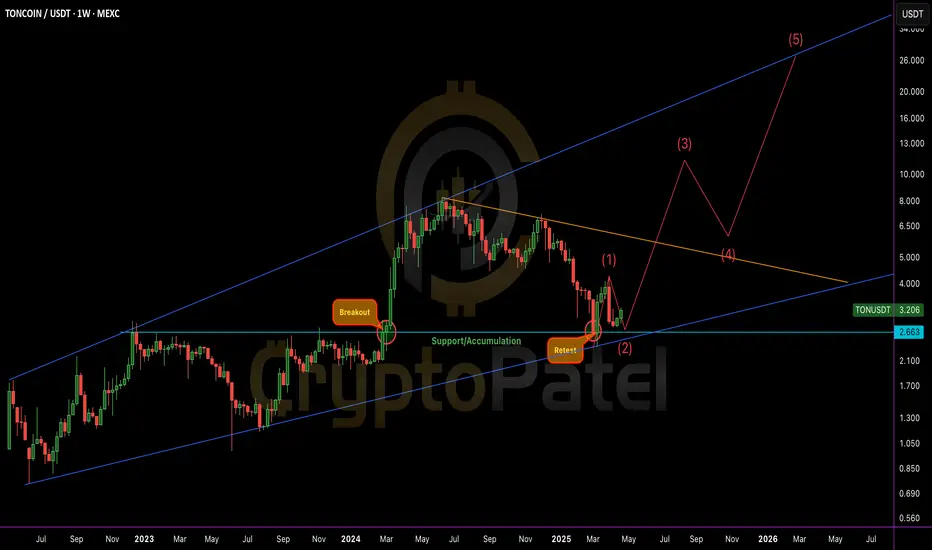
Accumulation Done. Retest Passed. Next: Moon Mode Activated!Accumulation Done. Retest Passed. Next: Moon Mode Activated! 🚀
#TONCOIN is shaping up beautifully! Here’s the full breakdown:
🔹 Breakout & Retest:
TON broke out of a major channel resistance last year around $2.66, followed by a clean retest at the same zone — confirming strong Support and Accumulation.
🔹 Current Structure:
After the successful retest at $2.66 (Support/Accumulation Zone), TON has started a fresh bullish structure.
Price is now building momentum above key dynamic trendlines.
🔹 Smart Money Concepts (SMC) Observation:
✅ Breaker Block (Accumulation Phase) confirmed at the $2.6–$2.7 zone.
✅ Classic Reclaim + Retest + Rally setup — typical Smart Money Accumulation behavior.
🔹 Inner Circle Trader (ICT) Concepts:
✅ Market Structure Shift (MSS) visible: from lower highs/lower lows ➔ shifting to higher highs and higher lows (bullish orderflow).
✅ Strong bullish Fair Value Gap (FVG) likely forming if TON pushes beyond the next local resistance (~$4).
🔹 Elliott Wave Theory Insight:
✅ Probable start of a 5-wave bullish impulsive move:
* Wave 1: Current push from retest zone.
* Wave 2: Minor correction expected.
* Wave 3: Parabolic rally (targeting $8–$10+).
* Wave 4 & 5: Following standard Elliott extensions.
🔹 Potential Targets (Mid to Long Term):
🎯 $5.00
🎯 $8.50
🎯 $13.00
🎯 $20-$50+ (in case of major altseason or BTC strength continuation)
🔹 Invalidation:
A confirmed weekly close below $2.30 would invalidate this bullish setup. Until then, dips are opportunities!
Summary:
TON looks primed for a major breakout continuation. Smart money seems to be accumulating heavily around the $2–$3 zone.
✅ Retest successful.
✅ Bullish structure confirmed.
✅ Massive upside potential.
🔔 Keep a close eye — TON might enter the "Next Big Move" phase soon!
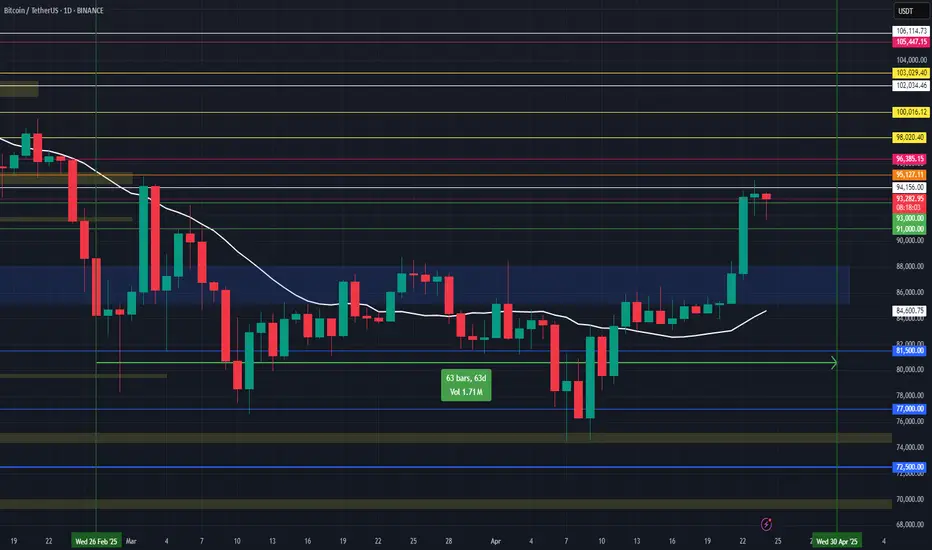
Bitcoin Breaks $88K — Eyes on Key Resistance ZoneSurging Momentum:
In the past few hours, Bitcoin has surged by 10%, breaking through the $88,000 resistance and reaching around $94,000. This marks a powerful continuation of bullish momentum.
Key Resistance Ahead:
The $92,000–$95,500 zone, which acted as strong support between November and February, is now expected to serve as major resistance. A rejection from this range could lead to a short-term retracement.
Retracement Zones:
If Bitcoin fails to break through $95,500:
First support: $91,000
Deeper pullback: $85,000–$87,500
Breakout Scenario:
If Bitcoin decisively breaks and holds above $95,500 on higher timeframes, we could see a continuation toward the next resistance between $102,000 and $108,000.
Conclusion:
Bitcoin is at a key inflection point. Whether it confirms a breakout or sees a short-term correction, this range will be crucial in shaping the next phase of the bull cycle. 📈🔥
#Bitcoin #BTC #Crypto #TechnicalAnalysis #Breakout #Resistance #Support #MarketUpdate #BullRun