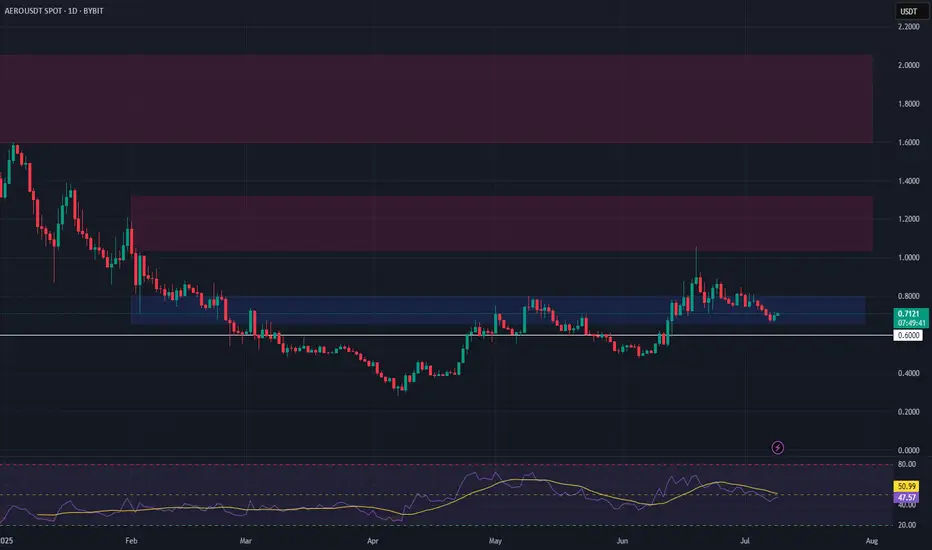
AERO Long Swing Setup – Retest of Range Low SupportAERO has pulled back to test the bottom of its range, now sitting at a key support zone. This offers a potential long swing entry as buyers look to defend the $0.66–$0.80 area.
📌 Trade Setup:
• Entry Zone: $0.66 – $0.80
• Take Profit Targets:
o 🥇 $1.04 – $1.32
o 🥈 $1.60 – $2.05
• Stop Loss: Daily close below $0.60
BTC-D
ETH Long Setup: Key Support Zone at $2,453.72The $2,453.72 zone on CRYPTOCAP:ETH looks promising for our next potential long setup.
It’s a key support level and holds significant liquidity—definitely a zone worth watching.
This is not financial advice. Always trade at your own risk.

$BTC Potential Longing OpportunityWe’ve successfully opened our previous long position at $105,398.80.
What’s next?
I’m currently eyeing the $106,335.70 – $106,716.90 range as a potential zone for the next long entry. Price may retest this area before continuing its move to the upside.
This is not financial advice. Always trade at your own risk.

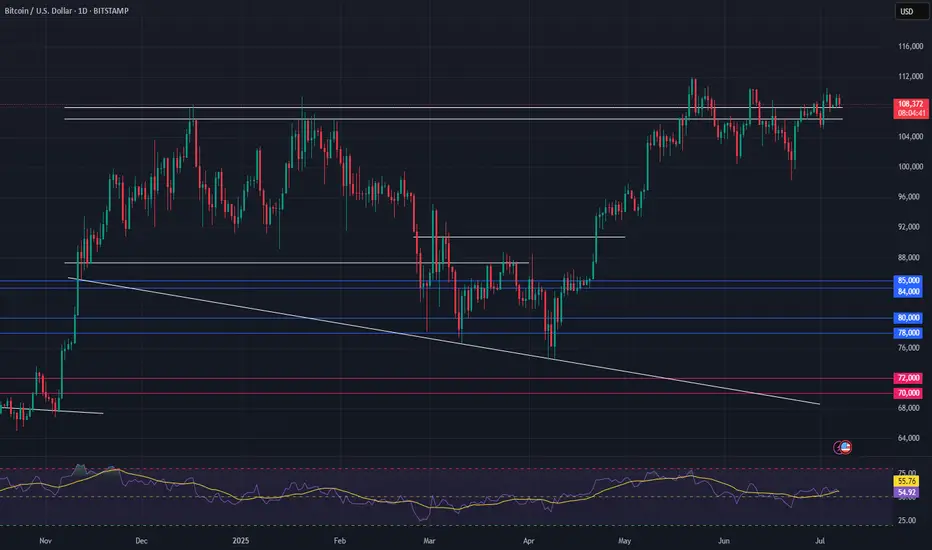
Bitcoin Eyes Breakout — Bullish Setup Gathers StrengthConsolidation Above Key Support:
Bitcoin continues to hold firmly above the $100,000–$105,000 support zone, a critical area that acted as major resistance earlier in 2025. This sustained price action reinforces the prevailing bullish momentum and signals strength beneath the surface.
Wedge Formation Nearing Resolution:
The prolonged wedge pattern now taking shape suggests a substantial move is imminent. The structure supports a breakout scenario, with an initial target of $130,000–$135,000 in play.
Uptrend Intact, No Signs of Exhaustion:
Despite recent weeks of sideways action, Bitcoin continues to consolidate near its highs—a pattern that historically favors continuation, not reversal. The broader trend remains upward and firmly intact.
Focus & Opportunity:
Bitcoin's technical setup justifies close attention in the days ahead. At the same time, traders and investors should keep an eye on select altcoins, which could offer amplified upside as capital rotation picks up momentum.
#Bitcoin #BTC #Crypto #TechnicalAnalysis #BullishSetup #WedgeBreakout #PriceAction #Altcoins #CryptoMarket #MarketUpdate #AllTimeHigh
BTCUSDT – Uptrend intactBitcoin continues to trade within a clear upward trend channel, with multiple Fair Value Gaps acting as strong support zones. After rebounding from the 104,960 area, price successfully retested the ascending trendline and returned to the previous accumulation zone.
Currently, BTC is consolidating near short-term resistance, but bullish momentum remains dominant. As long as price holds above 104,960, a breakout toward the extended resistance zone at 116,971 remains a likely scenario.
Trend: Bullish
Support: 104,960
Resistance: 116,971
Strategy: Favor buying on dips as long as price holds above the trendline and FVG. Nearest target around 116,971.

BTC - new ATH will happenIn the month of April, I clearly pointed out BTC will take support and will move upside only and all news are favorable for up move. In less than 3 months we are seeing the expected up move. From July first week I am expecting BTC to make new ATH and T1 is near 118K and T2 is around 130K and BTC could even see 145 K easily in this year 2025. All the news coming from US are only indicating higher levels for BTC. Avoid all other Alt coins and stay long in BTC for few more weeks to see the biggest profits in 2025.

Trade Recommendation – BUY WTI Crude Oil (USOIL) – Entry #2✅ Trade Recommendation – BUY WTI Crude Oil (USOIL) – Entry #2
📅 Date: July 3–4, 2025
🕒 Timeframe: 1H
🎯 Trade Setup:
Entry Zone: 66.30 – 66.40 USD/barrel (short-term support and EMA20 zone)
Stop Loss (SL): 65.60 USD (below MA200 and previous bullish candle base)
Take Profit (TP):
• Target: 68.40 – 68.50 USD
📊 Technical Analysis:
Healthy pullback after a strong bullish breakout — price is currently consolidating around EMA20, potentially forming a new upward leg.
Volume surged during the July 2–3 breakout, indicating strong institutional buying interest.
Price structure: Clear uptrend with higher highs and higher lows.
Bollinger Bands: Price touched the upper band and is now retracing to the mid-band — a common continuation pattern.
EMA20 is acting as dynamic support.
🧭 Strategy Notes:
Wait for price to retrace into the 66.30 – 66.40 zone with a confirmation signal (e.g. bullish pin bar or engulfing candle).
Consider scaling in and holding the position toward the resistance area of 68.40 – 68.50.
Cut loss if price breaks below 65.60 and invalidates the current bullish structure.
fl me & ytb, winrate 90%! Thank

Bitcoin: Ready to Break Psychological Resistance?BTC is maintaining its bullish structure with strong rebounds from the trendline since April. The price is now approaching the psychological resistance zone at 119,000 – a level that has been rejected three times before.
If support at 104,700 holds and the resistance is broken, BTC could target the 125,000 area. On the other hand, losing this support could interrupt the bullish momentum.
Trade Setup:
Buy around 104,700–106,000
TP: 119,000
SL: below 103,000
Note:
The upcoming NFP report on July 5 may trigger sharp moves if strong data boosts the USD.
Do you expect a breakout or another rejection?

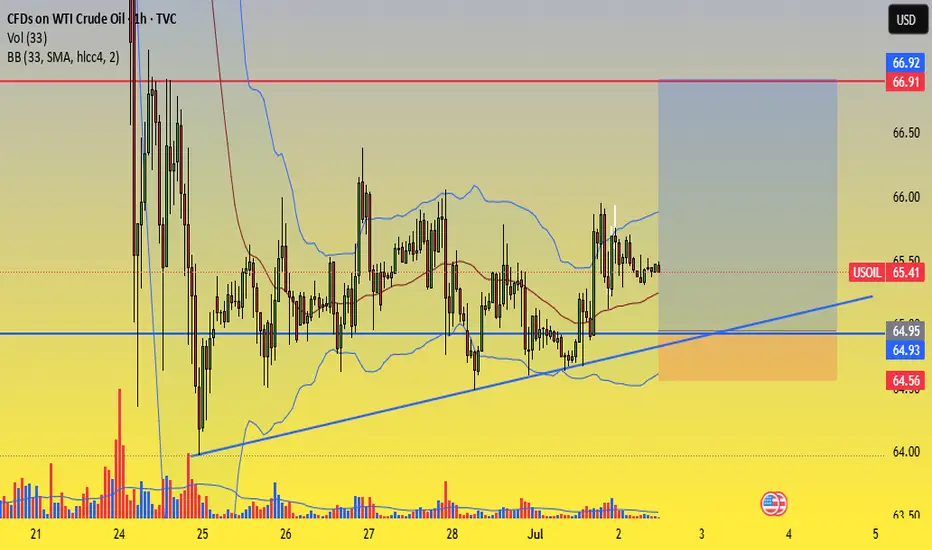
Trade Setup – BUY WTI Crude Oil (USOIL)✅ Trade Setup – BUY WTI Crude Oil (USOIL)
📅 Date: July 2–3, 2025
🕒 Timeframe: 1H
🎯 Trade Parameters:
Buy Zone (Entry): 65.00 – 64.90 USD/barrel
Stop Loss (SL): 64.55 USD (below rising trendline and lower Bollinger Band)
Take Profit (TP):
• TP1: 66.50 USD
• TP2: 67.00 USD
📊 Technical Analysis Highlights:
Rising trendline from June 24 continues to hold, forming a solid support area around 64.9–65.0.
Bollinger Bands are narrowing, indicating potential volatility expansion. Price is consolidating near the mid-band (MA20), often a precursor to bullish breakout.
Volume shows signs of accumulation around the trendline, suggesting buying interest at key support.
Multiple rejections from 64.90 without breakdown reinforces this level as near-term support.
🧭 Strategy Notes:
Enter on price pullback to the 65.00–64.90 zone with confirmation (e.g. bullish pin bar, engulfing pattern, volume spike).
Suggested position management:
• Take 50% profit at 66.50
• Hold the remaining 50% toward 67.00 if momentum is strong.
If price breaks below 64.55 with strong volume, exit the trade to preserve capital.
Good luck Everybody! Fl me here and ytb ! Thanks
BTCUSDT – Targeting 125,000 if Resistance BreaksBTCUSDT is holding a strong uptrend, with price respecting the ascending trendline and consistently filling fair value gaps. The pair is approaching key resistance around 110,000 and may form a breakout–retest pattern, potentially unlocking a move toward 125,000.
On the news front, institutional inflows are returning, spot ETFs continue to attract capital, and the Fed is keeping rates steady — all supporting bullish momentum. As long as price holds above 101,200, the upside scenario remains in play.

BCH Could 10x in the Next Bull Run — But Not YetBCH Could 10x in the Next Bull Run — But Not Yet
Bitcoin Cash is still trading inside a big falling channel.
Every time price hits the lower zone at Bull Flag, it bounces back up — this is the strong Support / Entry Zone.
Right now, BCH is near the upper Trendline Resistance (~$550-$580).
But IMO, we could see one more retracement before the next big bull run. I’m expecting price to revisit the $250–$210 zone before the next leg up.
However, if BCH breaks and holds above $640, that would confirm a bull flag breakout — turning the structure fully bullish with potential long-term targets between $1,800 – $4,000+ by 2026–2027.
Stay alert. The setup is big — but timing is key.
Note: NFA & DYOR

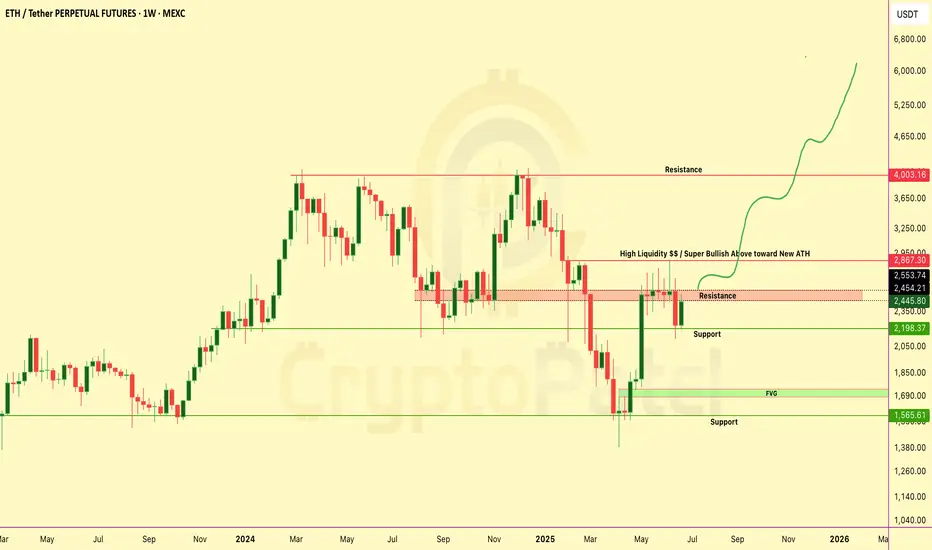
ETHEREUM Weekly Chart Breakdown – Massive Move Loading?ETHEREUM Weekly Chart Breakdown – Massive Move Loading?
ETH just pumped +9.9% this week... but it’s what comes next that really matters 👇
Key Resistance Wall → $2,867
🔹 This zone is packed with liquidity traps and past rejections.
🔹 Break this level = Unlocks ATH push toward $4K–$6K-$10k
Why This Chart Matters:
✅ Bullish structure reclaim
✅ Targeting “High Liquidity” zone above
✅ Possible parabolic rally if breakout confirms
Dips = Opportunities
If ETH dips from here... don’t panic.
→ Every dip = fresh accumulation zone
→ Below $2,000 = golden buy zone for long-term bulls
Liquidity Zone Break it = ATH rally incoming
Reject it = Buy the dip and ride the next wave
Comment & tag a friend who needs this alpha!
NFA & Dyor
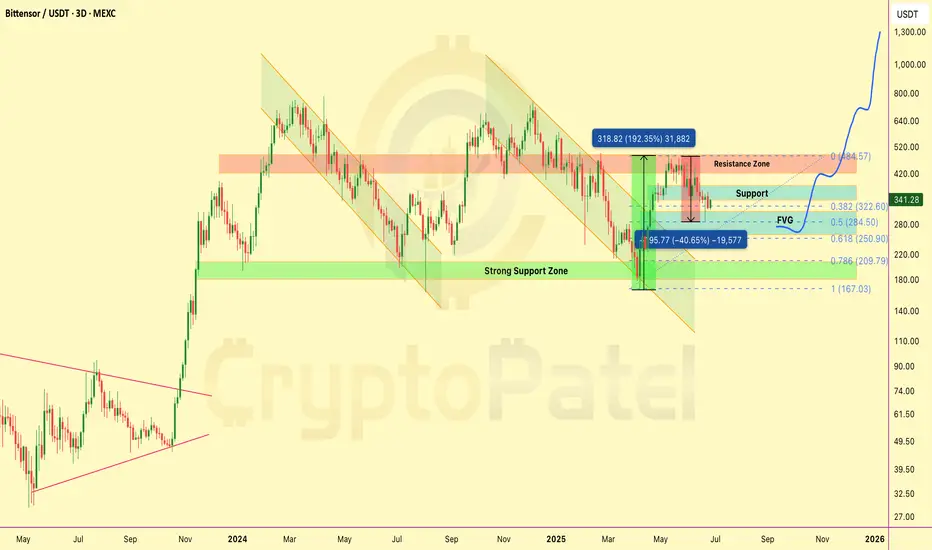
$TAO dumped 40% — exactly as predicted.LSE:TAO dumped 40% — exactly as predicted.
If you didn’t buy the top, you saved cash.
If you shorted near $500, you printed 200%+ profit on 5x.
Now what?
Price bounced cleanly from our FVG zone
Accumulation zone: $250–$200 — it’s coming...
I’m still aiming for $3,000–$5,000 this cycle.
Don’t rush. Accumulate smart.
Patience = profits.
What’s your LSE:TAO game plan now? 👇
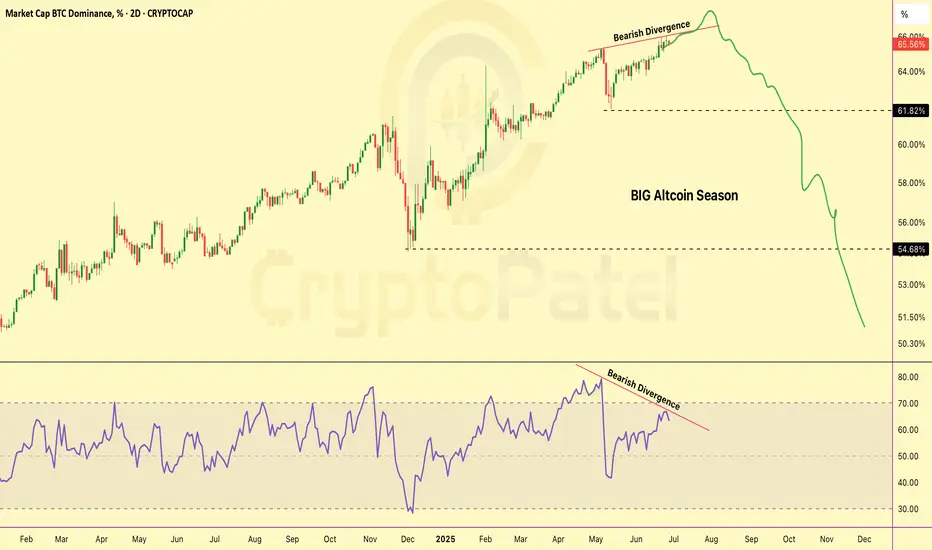
Big Altseason Is Loading... Ready for Big Altseason... but Why?BTC Dominance Showing Bearish Divergence!
Get ready... a massive Altcoin Season could be coming soon!
📉 Chart and RSI both showing weakness
📉 If dominance drops from here, money will likely flow into altcoins
📉 Next target: 50% dominance — same level where ALTs pumped 5x–10x last time!
This could be the biggest altseason of the cycle.
Don’t miss the opportunity!
Comment your top 3 altcoin picks 👇
Stay tuned for updates — we’ll post the best setups!
NFA & DYOR
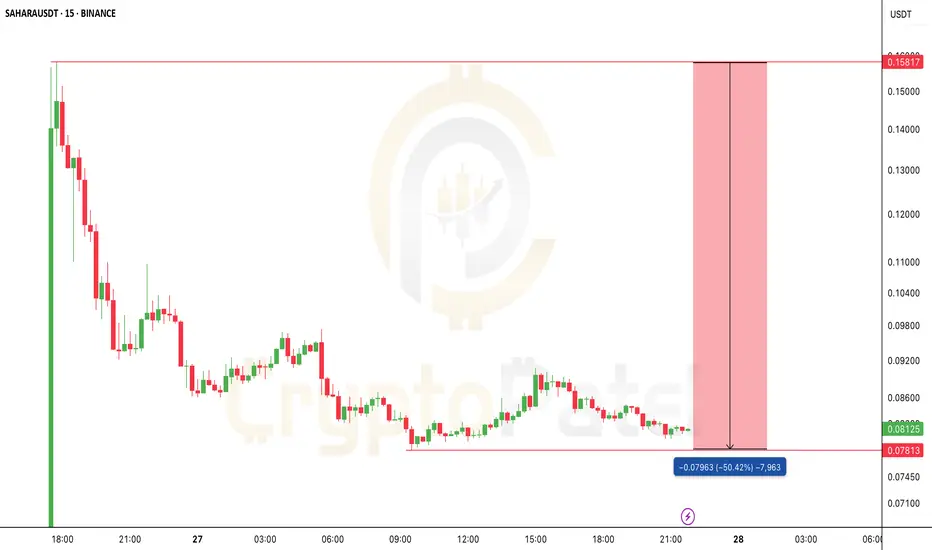
New traders, read this before chasing the next listing pumpNew traders, read this before chasing the next listing pump:
BSE:SAHARA dropped 50% right after launch — but early investors still sit on 10x+ gains from seed.
Why? They got in at
Seed: $0.005
IDO: $0.06
Binance top buyers? Wrecked.
✅ Always study tokenomics
✅ Know seed + public round prices
✅ Let the hype settle before entries
Smart money waits. FOMO gets dumped on.
What’s your rule before buying a new listing?
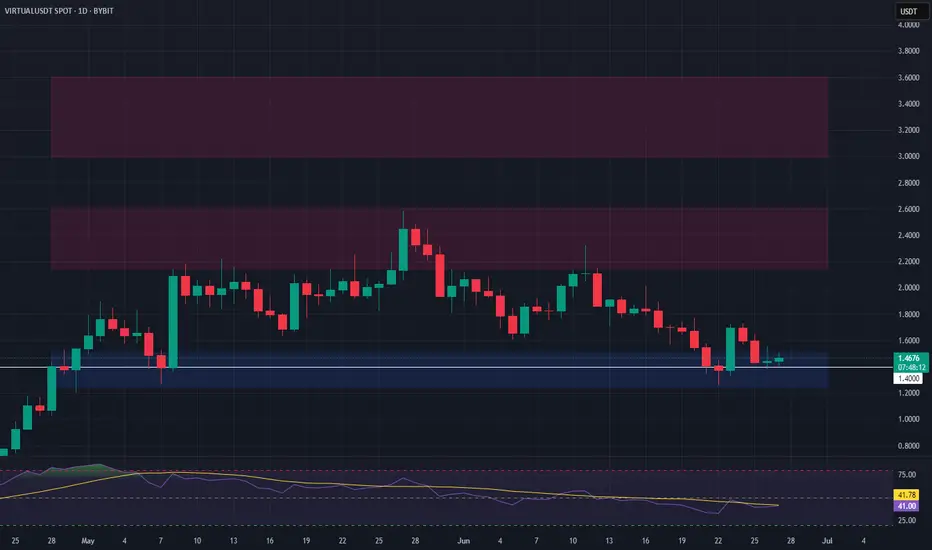
VIRTUAL Long Setup – Watching Key Support with BTC CorrelationVIRTUAL is approaching a major support zone, with a potential long spot entry dependent on Bitcoin stability. We’ll be looking to enter around the $1.50 level, provided it holds as support.
📌 Trade Setup:
• Entry Zone: Conditional on $1.50 holding as support
• Take Profit Targets:
o 🥇 $2.15 – $2.60
o 🥈 $3.00 – $3.60
• Stop Loss: Tight stop, daily close below $1.40
BTCUSDT – Buying Resumes, Bullish Momentum Targets 120,000Bitcoin is flashing strong bullish signals as it continues to hold within a well-defined long-term ascending channel. After a technical bounce from the nearby support zone around 99,614, BTC has regained momentum and is now approaching a key resistance FVG cluster — a potential launchpad for a breakout.
The price structure shows a series of higher lows combined with healthy pullbacks, indicating accumulation and capital rotation back into BTC. A “break–pullback–continuation” pattern is forming, pointing to a likely move toward the psychological resistance level at 120,000 — a target highlighted by many professional traders since the start of the quarter.
Fundamental factors supporting the uptrend:
Large capital inflows are returning to U.S. Bitcoin ETFs, signaling renewed institutional confidence in the bull cycle.
Expectations that the Fed will hold rates steady are weighing on the USD, creating a favorable environment for risk assets like BTC.
Altcoin volatility is fading — often a sign that capital is rotating back into BTC as the market’s leading asset.

Bitcoin is Coiling – Ready to Break Out Toward 112K?On the H8 timeframe, BTCUSDT is forming a clear bullish setup. After a strong rebound from the support zone around 104,489 — which aligns with a previous demand area and Fair Value Gap — price has broken above the descending trendline and is now retesting the resistance near 107,500. This structure is shaping into a broadening triangle pattern, signaling a potential breakout.
If BTC holds the 105,000–106,000 area during the upcoming pullback, there is a high probability of a bullish breakout toward the 112,000 level — a key previous high.
On the news front, market sentiment is improving as U.S.-based Bitcoin ETFs attract fresh inflows, coupled with growing expectations that the Fed will hold interest rates steady amid signs of economic slowdown. These factors are providing strong support for BTC’s medium-term bullish outlook.

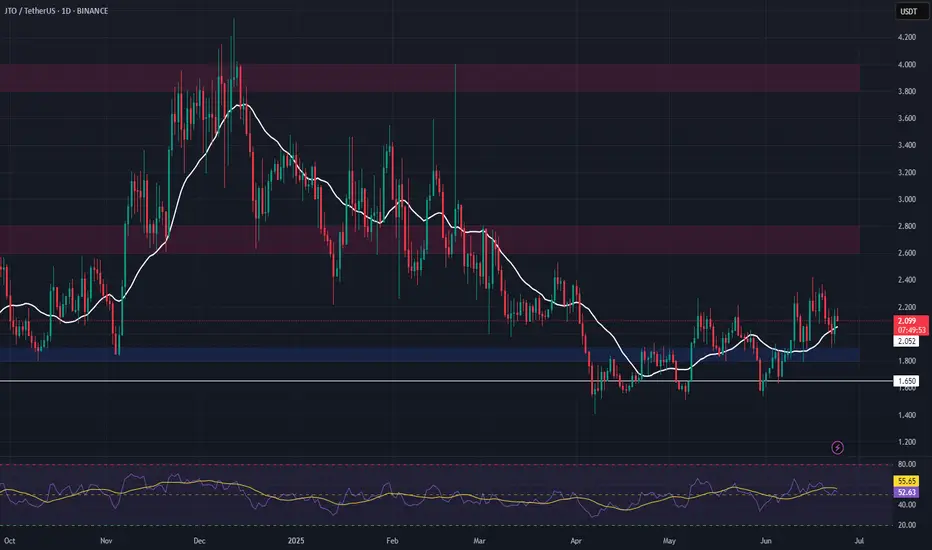
JTO Long Setup – Range Low Accumulation with Bottom PotentialJTO remains range-bound and is showing signs of a potential bottom, with downside liquidity largely cleared. We’re watching the $1.80–$1.90 zone for a long entry, as long as price holds above the key $1.65 invalidation level.
📌 Trade Setup:
• Entry Zone: $1.80 – $1.90
• Take Profit Targets:
o 🥇 $2.60 – $2.80
o 🥈 $3.80 – $4.00
• Stop Loss: Daily close below $1.65
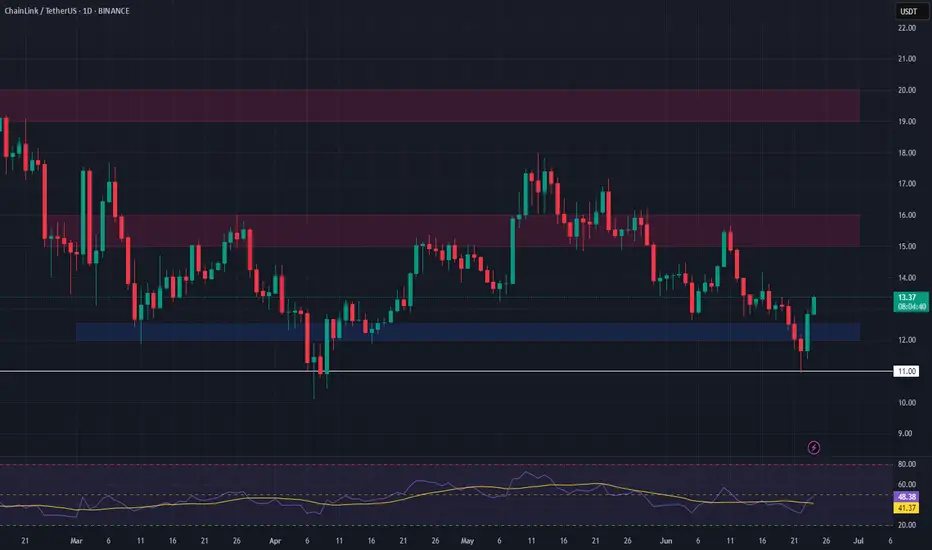
LINK Long Swing Setup – Higher Low Retest at Key SupportLINK has shown strong relative strength in recent weeks and is now retesting the $12 support zone. With broader markets stabilizing, this level could confirm a higher low and set the stage for continued upside.
📌 Trade Setup:
• Entry Zone: Around $12.00
• Take Profit Targets:
o 🥇 $15.00 – $16.00
o 🥈 $19.00 – $20.00
• Stop Loss: Daily close below $11.00
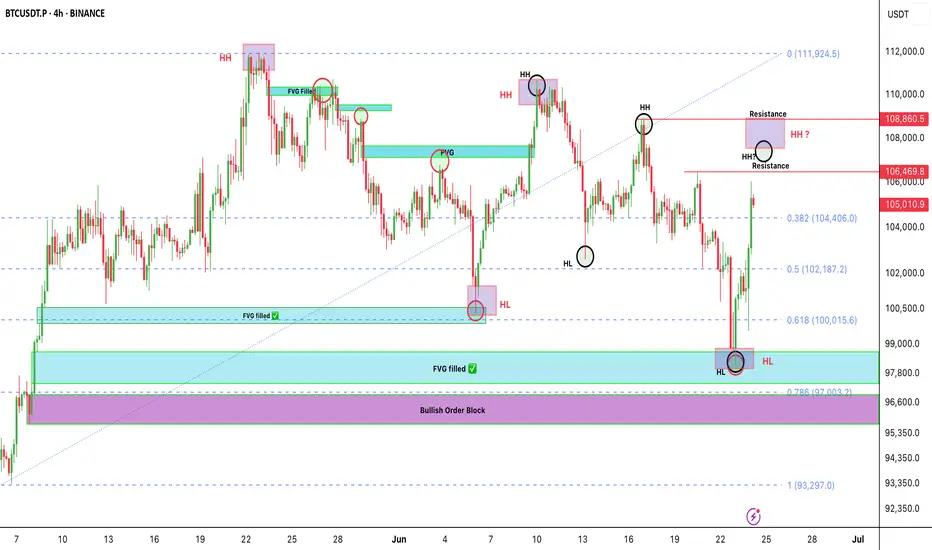
Bitcoin isn’t fully bullish yet — most people are falling for thBitcoin isn’t fully bullish yet — most people are falling for the trap
BTC just bounced beautifully from the $97.8K–$98K demand zone.
It tapped into key confluences:
✅ FVG filled
✅ 0.618-0.786 Fib level
🟪 Bullish Order Block just above 0.786
But let’s be real — we’re not in full bullish mode yet.
This looks more like a short-term pullback, not a trend reversal.
What I'm Watching Closely:
🔹 BTC is forming two HH & HL patterns.
🔹 Super important for us to track both — they’ll guide the next big move.
🟥 LTF last HH = $108,900
🟥 HTF last HH = $110,654
As long as BTC stays below these, the structure is still bearish.
We only flip bullish when candles break and close above them.
If Bullish Breakout happens? We’re eyeing new ATH targets toward $150K 🚀
My Plan Right Now:
🔹 Watching $107K & $109K levels for clean short setups.
Why?
👉 Low-risk entries
👉 Tight SL
👉 Big reward — Targeting around $100K
Stay alert, don’t chase. Let the levels come to us.
Let me know in the comments 👇 Are you flipping bullish, or still cautious?
NFA & DYOR
Biggest Crypto Expiry of the Quarter Is Almost Here🚨 June 27 = Big Expiry Day for BTC, ETH & Markets. Here’s What to Watch 🚀
This Friday — June 27 — marks the quarterly options expiry , and it’s shaping up to be a big one 💥
Especially for Bitcoin and Ethereum , where open interest is currently at its highest compared to all other series. One glance at the chart tells you everything — this expiry matters .
And right now, the Max Pain level for BTC sits at $101K …
Guess what? Price has already arrived.
📈 Over the past week, the heaviest trading volume was seen around:
$100K Puts
$95K Puts
So yeah — we’ve got all the signs pointing to price hanging around this zone before expiry.
It wouldn’t be surprising to see BTC drifting sideways near $100K–$101K , playing cat-and-mouse with the Max Pain level.
🧠 Why This Matters:
Large players may try to pin price near Max Pain 📌
Volatility could stay low until the final stretch ⏳
👉 Your Move:
Mark your calendar. Watch the flow.
We’ll be tracking every move as we approach expiry — follow along for updates.

BTCUSDT – Long-term uptrend intact, target 111,666 USDTBitcoin is maintaining a strong bullish structure on the daily chart, having successfully retested the long-term ascending trendline. The support zone around 93,932 USDT — which aligns with a Fair Value Gap (FVG) and trendline — continues to act as a key rebound level, as seen in late April.
The current chart suggests a “pullback–breakout–consolidation” pattern, with the potential for a higher low if price revisits the trendline and FVG once more. The base case: price consolidates around the 98k–100k zone before targeting the major resistance at 111,666 USDT.
On the news front, investor sentiment is stabilizing after the Fed signaled rate hold. Additionally, BlackRock’s ETF has seen three consecutive days of net inflows — a strong tailwind for the bulls.
