Khuyến nghị giao dịch ETH/USDT(15p): BUY 1830-1835ETH/USDT Trading Recommendation
Optimal Entry Zone: 1,830 – 1,835
Target Take Profit: 1,900
Stop Loss: 1,809
Risk-to-Reward Ratio: ~2.5R (Optimized profit/risk)
Analysis & Outlook:
ETH is in a recovery phase after a strong correction. The price structure indicates:
✅ Strong support around 1,830 – 1,835, where accumulation is evident.
✅ Short-term uptrend with price maintaining above the ascending trendline.
✅ Nearest resistance: 1,900, where price may react before the next move.
Trading Strategy:
Prefer to wait for a pullback to 1,830 – 1,835 before entering a long position.
Strict risk management with stop loss at 1,809 to protect capital.
Expecting ETH to reach 1,900 in the short term, with potential continuation toward 2,050 next week if bullish momentum persists.
🚀 Follow me for more high-probability trading opportunities! 🚀
Btc-e

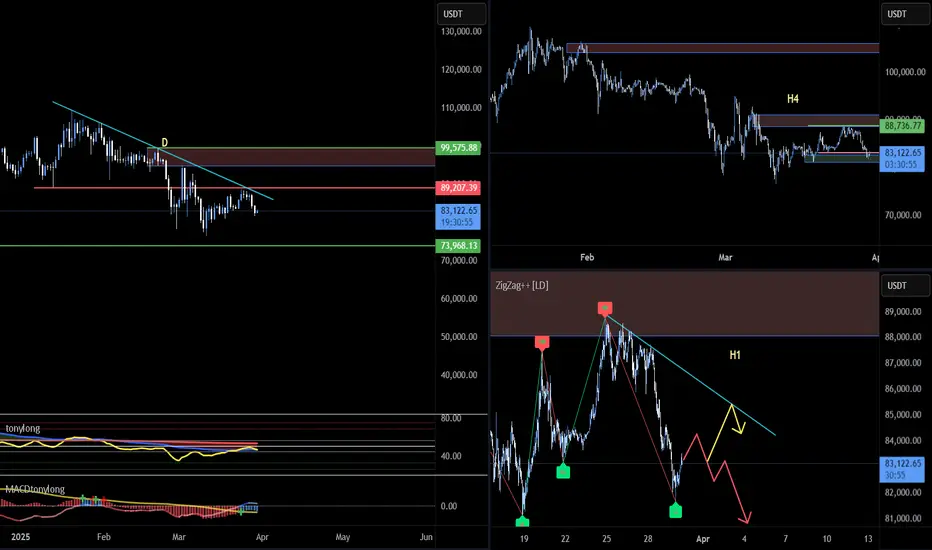
BTC23: BTC falls again. Testing support or finding a new bottom?📊 BINANCE:BTCUSD continued to decrease again in the past 2 days. Let's evaluate and look for opportunities through the multi-timeframe perspective below BINANCE:BTCUSDT :
🔹 **D Frame**: Before the price decrease in the past 2 days, we can see that although BTC had a recovery phase before, the fake decrease structure has not been broken yet.
🔹 **H4 Frame**: The keylever zone has been broken as marked on the chart, however, this is the first decrease after the increase wave in the past days, so it will need clearer confirmation.
🔹 **H1 Frame**: Currently, the price is reacting to the support zone of 81~83k. However, the price is still in a downward wave if looking at the price structure.
🚀 **Trading plan:*
📌 At the present time, we can look for a SELL position in line with the main trend in diagonal resistance areas to look for a trading position in line with the main trend. The current price is at an important support area, so it is no longer suitable to SELL at this time. BUYing in this area is not recommended when the downtrend has not shown any signs of ending. We will have to wait for a clearer signal from the price structure to properly assess the effect of the current support area.
💪 **Wishing you success in making a profit!**
$ETH has dropped -40% since Eric Trump recommended buying it.JUST IN : CRYPTOCAP:ETH has dropped -40% since Eric Trump recommended buying it.
Just a gentle reminder to always DYOR (Do Your Own Research) before making investment decisions.
#Ethereum

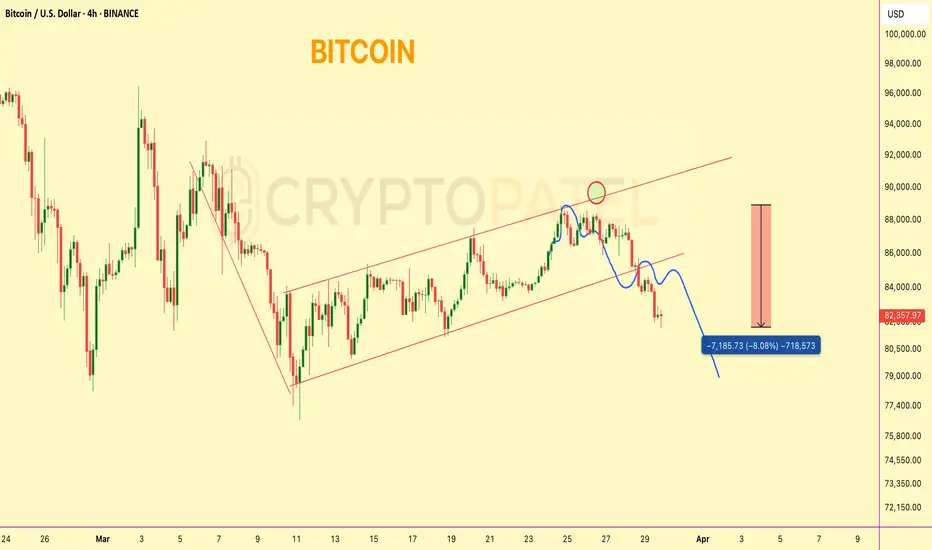
Bitcoin Dumped from our Entry levels and now 8% down#Bitcoin Bearish Flag Update
Price rejected perfectly from $89,000 resistance — our short setup played out with a solid -8% move.
Currently trading around key support at $82,000.
Trend Bias: Bearish below $85,700
Next major support: $75,000–$70,000 zone
Structure still favors further downside unless $85.7K is reclaimed.
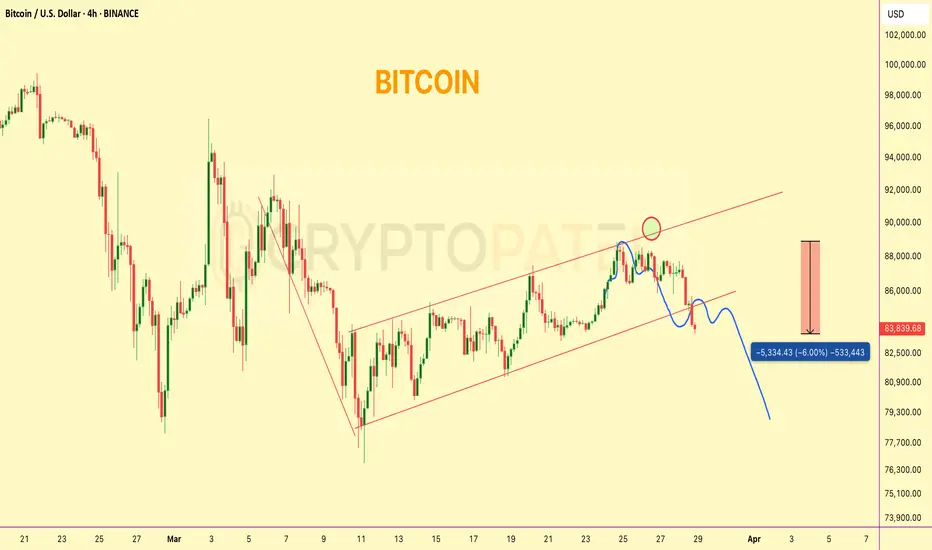
Bitcoin 6% dip form Rejection level✅ #Bitcoin respected our chart perfectly — rejected cleanly from our resistance zone.
🔻 Currently down ~6% from that level.
What’s next?
If CRYPTOCAP:BTC breaks and sustains above $85,650, we may see bullish continuation.
Else, expect further downside targets to unfold.
Bitcoin - Buy for Target 90 KBitcoin is showing bullish pattern and right now taking support at key technical level from where its expected to move up for next target of 90K. view are shared well in advance or in quick mode before waiting for confirmation which will delay the chart and good move will be missed. Price should hold this current support area of 83600 to 83700 area and failing which this view will be cancelled. use this view for educational purpose or to take your own decision and this is not a financial advice. Market is big and like many i am also trying my best to predict the next price move and to share my view with others. Likes, comments are welcome. Thanks

BTC - 28th march TP - 89200 cup and handle BTC - 28th march TP - 89200 cup and handle pattern. Trend is Bullish.

Will ETH/USDT hit $10,000 in this bull run?CRYPTOCAP:ETH is consolidating within a clear accumulation range.
A macro breakout is likely post-April, supported by cyclical structure & on-chain metrics.
HTF target: $10,000 remains valid.
Accumulation precedes expansion. 📈

Will TON/USDT Hit $100 in Near Future? $TONCOIN – Technical Analysis Update
CRYPTOCAP:TON is currently displaying a bullish structure, following a strong bounce from the key support/retest zone at $2.50.
🔹 Support Zone: $2.50
🔹 Accumulation Range: $3.50 – $2.50
🔹 Trend Outlook: As long as price sustains above $2.30–$2.50 zone, the structure remains bullish.
📈 Potential Upside Targets:
▪️ $20
▪️ $30
▪️ $40
▪️ $50
▪️ $100 (macro target on long-term breakout)
🔻 Invalidation Level (Bearish Bias):
If CRYPTOCAP:TON breaks below $2.30 and fails to reclaim it, bearish momentum may resume.
📝 Disclaimer: This is a technical analysis view, not financial advice. Always DYOR before making any investment decisions.

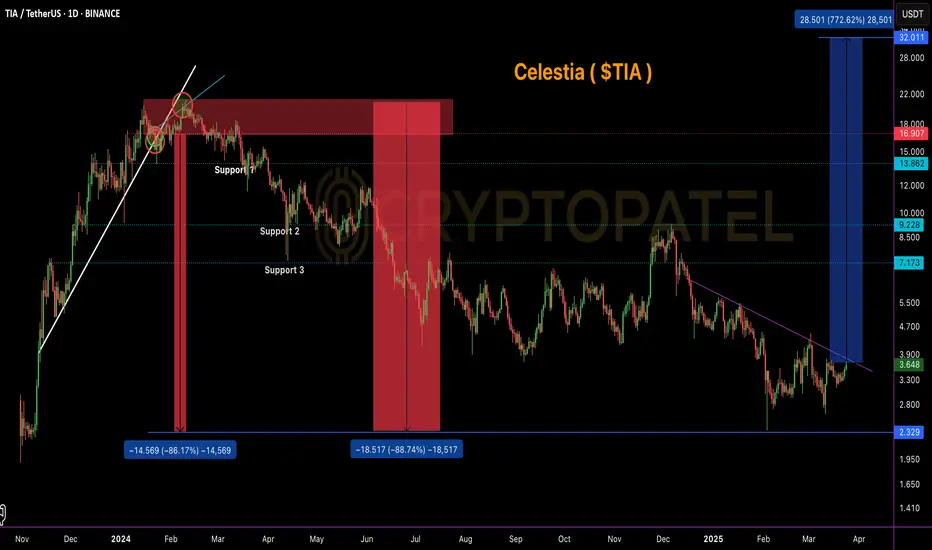
$TIA dropped ~86% from our short entry zone!LSE:TIA Massive Profit Update – Short Call Hit Perfectly 🔥
LSE:TIA dropped ~86% from our short entry zone!
We shared a short setup for LSE:TIA at the $17–$20 range. After a textbook retest rejection, price began its downward move and has now dumped all the way to $2.36, hitting a massive -86% from the top of our short zone. ✅
Current Technical Outlook (Accumulation Zone):
Based on chart structure and historical support levels, we are now entering a potential accumulation range between $3.60 – $2.50.
Long-Term Outlook:
If this zone holds, we could see a strong recovery in the coming months with possible upside targets in the $20–$40 range in the long run.
🚨 Note: This is not financial advice. Always DYOR (Do Your Own Research) before investing or trading.
Breaking: $BTC reclaims $87,000, What Next?🚨 Breaking: CRYPTOCAP:BTC reclaims $87,000 🚀
POI: $88,000–$90,000
This zone is crucial — it will decide Bitcoin's next major move.
Watch closely:
✅ Hold above $90K = bullish continuation
❌ Rejection from POI = possible pullback
#Bitcoin #BTC

BTC#22: BTC recovers slightly. Is the bear wave over?
In the past few days, BINANCE:BTCUSD has been continuously SW in the 81~85k area. Is this a sign that BTC will rise again? Let's analyze in detail and plan a trade BINANCE:BTCUSDT :
1️⃣ **Fundamental analysis:**
📊 The IMF has included Bitcoin and other digital assets in the framework of the global economic report for the first time. This shows that BTC is being recognized as a real asset.
🚀 The probability that the US government will buy Bitcoin in 2025 is 30% with information that the Trump administration may use profits from Gold to increase Bitcoin reserves
2️⃣ **Technical analysis:**
🔹 **Frame D**: the bear wave has not shown any signs of ending. The price has been anchored in the 80~85k area for a long time, but there has been no significant fluctuation and the sign of recovery is still unclear.
🔹 **H4+H1 frame**: The current short-term price structure is temporarily increasing with the appearance of higher peaks and higher bottoms. However, the price has not surpassed the important key zone to change the main trend.
3️⃣ **Trading plan:*
📌 At the present time, the current price has no clear signs when BTC is still fluctuating continuously in the SW area. Currently, the price is in a recovery phase with the nearest target being the resistance area of 88~91k. The current area is also not good for seeking profit from BUY positions. We can wait for the price reaction to the resistance area to consider establishing a SELL position. Prioritize trading in accordance with the main trend.
💪 **Wish you success in making profits!**

Will PolkaDot Hit $50 in near Future?Where is the #POLKADOT Army?
CRYPTOCAP:DOT is in a key accumulation zone between $4.50–$3.50, a historic demand area before major moves.
➡️ Many lost patience, but smart money builds positions here.
➡️ If market cycles repeat, a return to $50 isn’t out of reach.

Bitcoin - BUY for Targets - 90, 92 & 95KIn chart, price has given breakout of immediate resistance line and retested and price moving up. price move clearly indicating bullish and up move. Fib Levels and resistance lines indicating first target at 90K and on breakout possibility of 92 and 95 K as per fib levels. But first move towards 90K is visible in chart. Other Cryptos - ETH and SOL super bullish after good accumulation clearly indicating up move. Hope and wish this move is quicker !!!!

Hedera (HBAR) Spot Trade SetupWith HBAR trading at a key support level, this presents a solid long opportunity if buyers step in to defend the zone. A successful bounce could push the price towards key resistance levels.
🛠 Trade Details:
Entry: Around $0.18 (Support Level)
Take Profit Targets:
$0.25 - $0.285 (First TP Zone - Initial Resistance)
$0.35 - $0.39 (Second TP Zone - Major Resistance)
Stop Loss: Just below $0.175
Watching for bullish confirmation before entry. 🚀

Bitcoin Price Action Analysis - March 20, 2025Bitcoin Price Action Analysis - March 20, 2025
Current Market Status
- Successfully closed above the resistance zone (84000-85000), which is now acting as support
- Currently in a consolidation phase after recovering from the recent drop
- The broken support trendline has been retested as resistance, with price action showing signs of strength
Technical Observations
- The yellow rectangle zone (84000-85000) has been reclaimed and is now functioning as support
- Price is forming a potential higher low pattern after the sharp decline
- The diagonal resistance line (previous support turned resistance) is still a key technical factor
- Volume patterns suggest accumulation after the recent sell-off
Updated Projections
Primary Scenario (Bullish Breakout)
- With price having closed above the 84000-85000 zone and holding it as support, the short-term outlook is turning bullish
- Next target is the 94000-95000 resistance zone (red rectangle area)
- This would represent a significant recovery and potentially signal the continuation of the larger uptrend
- The blue arrow path indicates the most likely trajectory in this scenario
Cautionary Scenario
- If price fails to hold above the 84000-85000 support zone, a retest of lower levels could occur
- The 73000 major support zone (green rectangle) remains a key level to watch if bearish pressure returns
Key Levels to Monitor
- Immediate support: 84000-85000 (yellow rectangle, now confirmed as support)
- Major support: 73000 (green rectangle, strong historical support)
- Near-term resistance: 89000-91000 (previous trendline resistance area)
- Target resistance: 94000-95000 (red rectangle area)
Trade Considerations
- Long entries near current levels with stops below 83500 offer favorable risk/reward
- The reclaimed support zone provides a logical stop-loss level
- Partial profit-taking at 91000 would be prudent, with remaining position targeting 94000-95000 or 100K level.
The successful reclaiming of the 84000-85000 zone is a significant technical development that shifts the short-term bias to bullish. If bulls can defend this newfound support, the path toward 94000-95000 becomes increasingly probable, following the blue arrow trajectory shown on the chart.

Will Bitcoin Fill FVG Before the Next Leg Up?Will Bitcoin Fill FVG Before the Next Leg Up?
📌 FVG 1: $74,483 - $70,796
📌 FVG 2: $64,800 - $62,033
With liquidity gaps below, will BTC retrace before resuming its uptrend? Or are we heading straight for new highs?
Drop your thoughts! 👇 #Bitcoin #Crypto #BTC

BTC - Triangle or Wedge - Bullish?2 views are there. Ascending Triangle - Bullish and Rising Wedge - Bearish. Price is making HL and never closed even once below previous HL indicating price is in Bullish trend. Weekend price bounced with huge volume and 85 to be watched today. if its taken with strong green bars then price will fly upside. view changes if previous HL is broken un till then buy the dips is the safe trade. But in 2025 and later its going to see new ATH as we have new buyer US Govt forming strategic reserve and not to sell from govt side. Investors are having Golden opportunity to invest and hold for few weeks to months to see higher levels for Bitcoin

BTC#21: Fear Index Rising. Will BTC Continue to Fall? 💎 💎 💎 BINANCE:BTCUSDT BTC's decline has somewhat slowed down in recent days with a recovery from 78k. We will plan for BINANCE:BTCUSD next 💎 💎 💎
1️⃣ **Fundamental Analysis:**
📊 The Fear and Greed Index dropped to 30 today, and the level is still fear
🚀 Cumulative net inflows into US spot Bitcoin ETFs have dropped to their lowest level since January 2
📌 The market is still in a pessimistic phase about BTC's bullish outlook. The outflow of money from the market is not only due to BTC's decline but also due to concerns about an economic recession due to Trump's unstable policies.
2️⃣ **Technical analysis:**
🔹 **D frame**: BTC's downtrend has shown signs of slowing down, but the main trend in frame D is still down. We will still need to wait for the price reaction in the resistance area to confirm.
🔹 **H4 frame**: The price trend is still down. The price reaction in the support area of 78K is not as strong as before, showing that market sentiment is still leaning towards the bears.
🔹 **H1 frame**: we are in a short-term correction. The target for this correction is the resistance area of 88-91K as you can see on the chart
3️⃣ **Trading plan:*
As you can see from the multi-frame perspective, the main trend is still down, but we are in a short-term correction. We can choose to wait for the price to return to the resistance area to trade in line with the main trend or if the price has a slight recovery, set up BUY to seek profit. However, because the main trend is down, we need to stop loss fully and not be greedy when the price hits resistance because the price can return to the main trend at any time.
💪 **Wish you success in achieving profits!**

TON/USDT Potential to $50 in long run ?🚨 DUROV BACK TO DUBAI! 🚨
Telegram Founder Pavel Durov has officially left France for Dubai with court authorization – AFP. 🇦🇪
Bullish for CRYPTOCAP:TON
The price surged 20% after the news.
#TON perfectly bounced from the $2.50 support level after a pending retest post-breakout.
IMO, a great entry zone is between $3 - $2.40 for long-term holders.
My personal target for TON/USDT: $50 in the long run!
🔸 Resistance: $5
🔹 Support: $2.40

Why Buy Bitcoin? ( Detail Post about $1M Target )Why Buy Bitcoin?
It’s hard to ignore Larry Fink and BlackRock.
At Davos, Fink said: "Bitcoin could hit $500K to $700K."
Meanwhile, top experts are making bold predictions:
🔹 Tim Draper: $250K by end of 2025
🔹 Michael Saylor: BTC = World's largest asset in 48 months
🔹 Peter Brandt: $120K – $200K by Sept 2025
🔹 Chamath: $500K by Oct 2025, $1M by 2040
🔹 Max Keiser: $200K by end of 2024
🔹 Bernstein: $200K by 2025
🔹 Fidelity: SEED_TVCODER77_ETHBTCDATA:1B per BTC by 2038-2040
🔹 Hal Finney: $10M per BTC long-term
Waiting for the headline: "Bitcoin ‘PLUNGES’ from $1,001,000 to $985,000." – CZ Binance
Are you paying attention yet? 🚀
NFA & DYOR

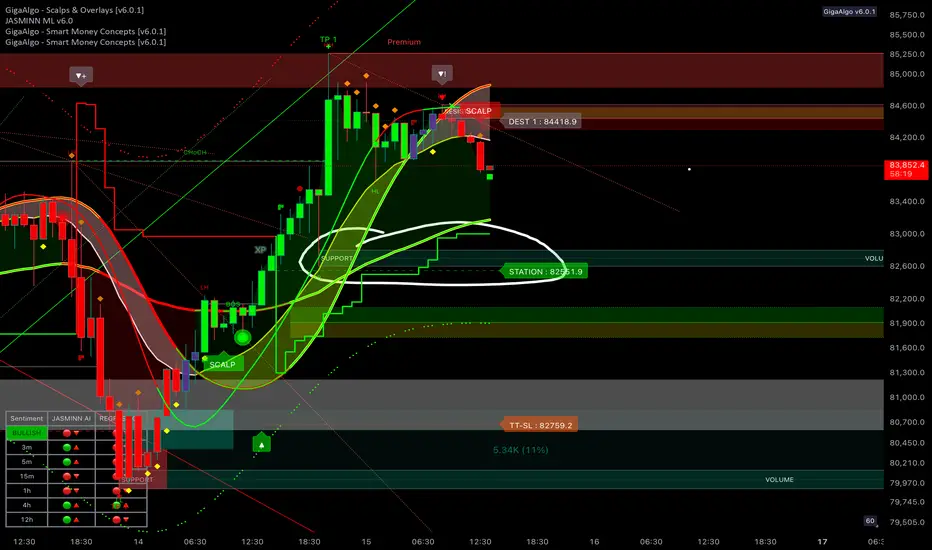
Bitcoin (BTC/USDT) 1-Hour Chart Analysis
Bitcoin is currently in a pullback phase after reaching a local high, showing signs of short-term weakness. The price action reflects a clear upward trend supported by higher lows and strong buyer interest, but recent rejection at a resistance zone indicates profit-taking and potential short-term selling pressure.
A key support zone lies below the current price level, marked by increasing volume and a station level where buyers are likely to step in. If the price holds this support, a continuation of the bullish trend could follow, targeting the previous resistance zone. However, if the support fails, a deeper correction toward lower demand levels is possible.
Market sentiment is mixed — short-term signals show bullish strength, while higher timeframes remain cautious. The next key move depends on whether buyers defend the support zone and push through the overhead resistance. A confirmed breakout above resistance could drive the next upward leg, while a breakdown below support could shift momentum back to the bears.
Bitcoin - At Neckline 15th MarchPrice is testing neckline of head and shoulder. Market is divided and not one sided as fear of 77K is still in market. But price at neckline few taking bullish view. Buy only if price move above neckline zone and in my view right now price could be trapping the late bulls. Sell once break out fails as price move drift down from neckline zone. US policy on Stablecoin making all crypto bearish and Bitcoin on top of strategic reserve news price could test lower level again as no one know how much is being bought on daily basis right now by US Govt.
