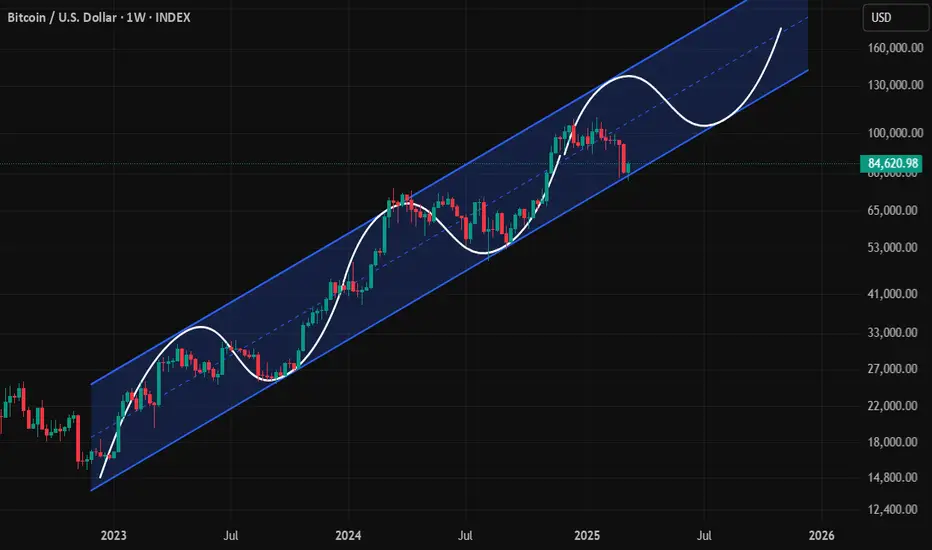
We might be facing some extremely big volatilityI've been sharing my method of tracking the crypto market through BTC uptrend channel that's been in place since late 2022. While it might seem rudimentary, I still believe it's worthwhile and continues to provide reliable signals.
Here's what I'd like to point out regarding the current volatility:
1. Good news: BTC price is still within its linear uptrend channel and receiving pretty solid support, today BTC price increase is proof of that. This allows us to continue observing the market with confidence and expect a new ATH.
2. Bad news: BTC is no longer fluctuating normally like it did in the previous 2 years. If it were fluctuating normally, BTC should be at a $140K peak right now instead of re-accumulating in the $80K price zone. This phase reversal could be an early signal of a trend reversal before we see BTC price in the 6x or 5x price zone.
So, what's gonna happen? I don't know, I can't say for sure. I can only point out 2 scenarios I'll be watching for confirmation:
1. Positive scenario: BTC price will surge to $140K in the short term to make up for the growth delay.
2. BTC price will fall out of the uptrend channel and plunge the whole market into chaos, similar to the May 2021 event, before recovering to the $150K-170K zone by year-end. I'm not hoping for this, I prefer stability and altseason having a chance to explode mid-year.
Anyway, we've got to be prepared for anything. At least, I have a few criteria like that to keep an eye on and act when needed.
Btc-e
#Ethereum Wyckoff Re-Accumulation#Ethereum Wyckoff Re-Accumulation
If this level holds, it could be the ideal accumulation zone for long-term investments.
CRYPTOCAP:ETH

Will BNB hit $5000 in future?Back in 2020, I said GETTEX:BNB will hit $500 when it was just $16… and y’all laughed. 🤡
But guess what? It didn’t just hit $500… it went all the way to $800—a 50x from my entry! 😎💰
And yeah, right after I entered, GETTEX:BNB dumped almost 62%! 💀😂 But diamond hands win in the end! 💎🙌
Now, it won’t even drop below $500! 😏
Just wait… GETTEX:BNB → $5000 is only a matter of time! ⏳🚀
Not financial advice, so don’t blame me later. DYOR! 😆

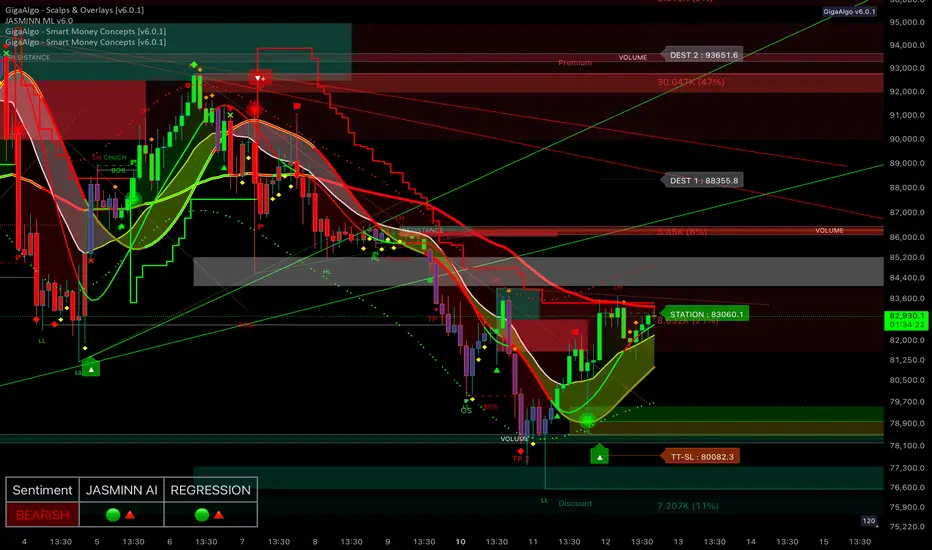
Bitcoin (BTC/USDT) 2-Hour Chart Analysis
Bitcoin is showing signs of recovery on the 2-hour chart after forming a local bottom at a key support zone. The price has bounced from a strong demand area, supported by increased buyer activity, and is currently attempting to push higher within a rising channel. The formation of higher lows (HL) and higher highs (HH) suggests that bullish momentum is building in the short term.
Despite this upward movement, the overall trend remains bearish, indicated by the dominance of red moving averages and the presence of strong resistance overhead. A major resistance zone sits above the current price level, marked by significant volume and selling pressure. The sentiment remains bearish, as confirmed by the red signal on the sentiment panel, although JASMINN AI and regression tools are showing early signs of potential upward strength.
If the price manages to break above the resistance zone and hold, the next upside target lies near the destination levels identified on the chart. However, failure to maintain upward momentum could result in a pullback toward the previous support zone, where buyers are likely to step in again. The key to further upside will be a decisive break and close above the resistance, supported by rising volume and bullish momentum. The overall market outlook remains cautiously bullish in the short term but within a larger bearish trend.
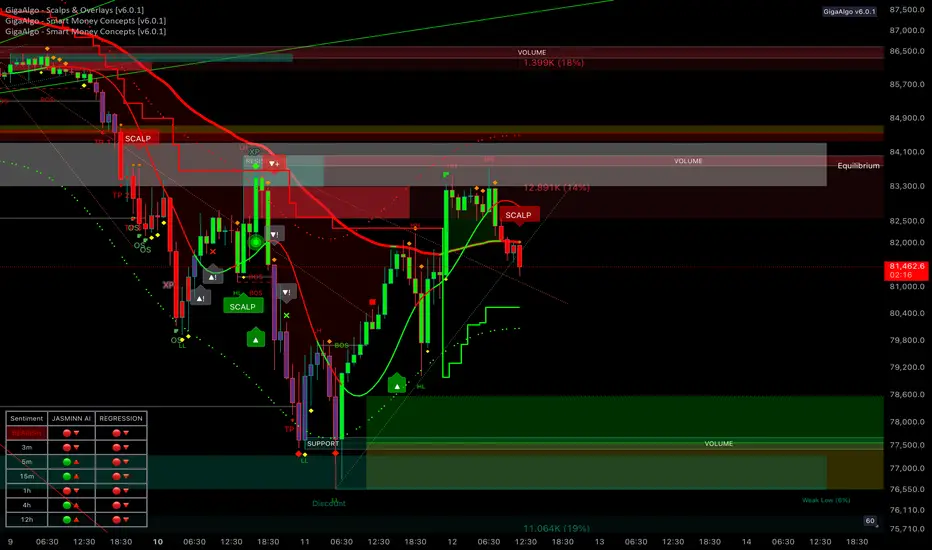
Bitcoin (BTC/USDT) 1-Hour Chart Analysis
Bitcoin is showing signs of bearish pressure on the 1-hour chart after a recent rejection from a key resistance zone. The market structure reflects a mixed trend, with signs of higher and lower lows indicating ongoing volatility. A recent break of structure and expansion suggest that the market is at a turning point.
There’s a clear resistance zone where sellers have stepped in, creating strong selling pressure. On the other hand, a support zone below shows signs of buyer interest, which could act as a floor if the price continues to decline. The equilibrium point near the middle of this range represents a potential decision area for future price movement.
Market sentiment remains bearish across multiple timeframes, reinforcing the downside bias. If the price continues to reject resistance, it could drop toward the support zone, with further downside possible if buyers fail to hold the level. Conversely, a breakout above resistance could signal renewed bullish momentum and lead to higher levels. The current outlook remains bearish, with selling pressure dominating near resistance and moderate buyer interest at support.
HYPE Trade Setup: Major Support Retest HYPE has seen a massive drop in the past few days and is now sitting at a critical support level. If buyers step in, we could see a strong bounce toward the next resistance zones.
🛠 Trade Details:
Entry: Around $14.3
Take Profit Targets:
$18.00 (First TP - Resistance Zone)
$20.00 (Second TP - Potential Breakout Level)
Stop Loss: Below $12.00
This setup offers a solid risk-to-reward opportunity if HYPE holds its support. Watch for volume confirmation before entering! 🚀

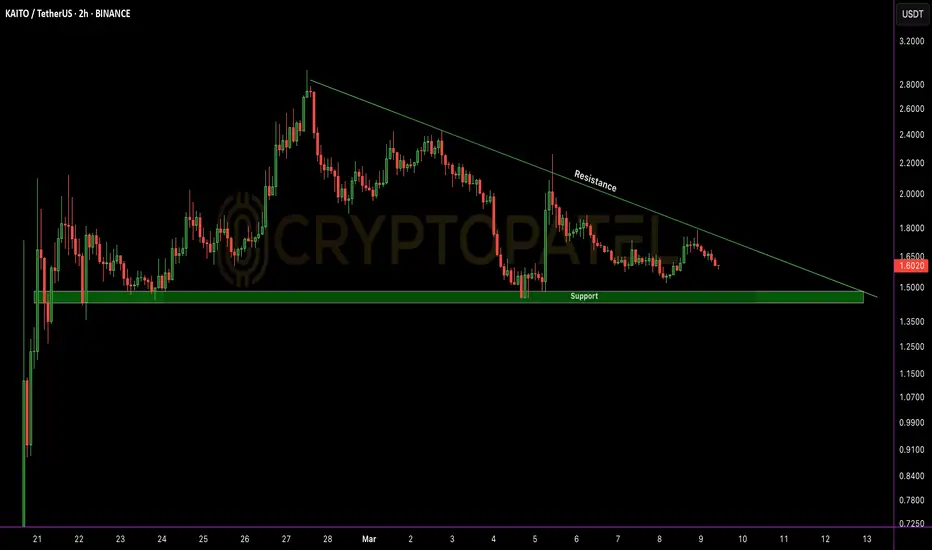
Will $KAITO go down -50% downside move?$KAITO Price Action Update
$KAITO is currently trading at $1.58, holding strong above the key $1.45 support level.
🔹 Key Levels to Watch:
✅ Support: $1.45 – Holding above this level could trigger a strong upside rally, targeting the $1.75 resistance and beyond.
❌ Break Below Support: If $1.45 fails, a 30-50% downside move is possible.
🚀 A decisive move above $1.75 could open doors for further gains. Keep a close watch on these levels for potential opportunities.
🔍 Stay informed, manage risk, and trade wisely.
📢 DYOR – This is not financial advice!
#KAITO #CryptoTrading #MarketUpdate #TechnicalAnalysis
BTC#20: BTC Analysis: Price SW In Triangle – Next Direction?💎 💎 💎As analyzed in the previous article, BINANCE:BTCUSDT gave a bad price reaction when touching the old resistance area of 95~96x. The current price is SW in the triangle. Let's analyze the next plan BINANCE:BTCUSD : 💎 💎 💎
1️⃣ **Fundamental analysis:**
📊President Donald Trump signed an executive order to establish a Strategic Cryptocurrency Reserve that includes 200,000 BTC seized in criminal or civil cases. It will be held as a reserve asset and not sold. In addition, the Government will not purchase additional assets for the reserve.
🚀The Treasury and Commerce Departments may consider budget-neutral Bitcoin purchases. Agencies must provide full accounting books of digital assets to the Ministry of Finance. Regulatory crackdowns on crypto assets are ended
📌 From the above information, it can be seen that BTC and the top 5 coins in the market have been officially recognized as an asset. The legal framework will take time to complete. However, BTC will receive more attention and attention when the US government makes any purchase moves to hoard. This will lead to a huge demand for BTC in the near future.
2️⃣ **Technical analysis:**
🔹 **D Frame**: The price structure is still bearish, we have had a recovery phase to retest the resistance area and give a bad price reaction. It is entirely possible that BTC will go down to the support zone below
🔹 **H4 Frame**: We can see the price reaction more clearly. The continuous reaction of lower peaks in this area shows that the market sentiment is still dominated by the bears even though BTC has been recognized as a reserve asset.
🔹 **H1 frame**: The price is still SW in the triangle area in recent days. The price range is gradually narrowing as shown on the chart
3️⃣ **Trading plan:*
⛔ At the present time, it is no longer suitable to wait for a BUY position. The price has tested the resistance area and reacted badly, so there is a high possibility that there will be a correction below the support area below at any time.
✅ The top priority is to trade in accordance with the main trend in the SELL direction. Although the information about the Reserve Fund has given a positive response, the government not buying more assets for the reserve is also a sign that short-term cash flow will be difficult to push into BTC, especially when tariff policies are giving negative reactions to the economy.
💪 **Wishing you success in achieving profits!**

BTC/USD TECHNICAL ANALYSIS – WHAT’S NEXT?📌 Timeframe: 2H
BTC/USD is currently trading within a symmetrical triangle pattern, signaling a phase of accumulation before a potential major breakout.
📈 TREND ANALYSIS & KEY PRICE LEVELS
1️⃣ Current Trend
BTC is trading around $86,301, moving within a narrowing price channel.
Price is caught between the ascending trendline support and the key resistance zone at $90,000 - $92,000.
A breakout above this zone could trigger a strong bullish move towards $98,000+.
Conversely, a failure to hold support may push BTC down to $82,764, with further downside potential towards $78,000 - $80,000.
2️⃣ Key Levels to Watch
🔺 Major Resistance Levels:
$90,000 - $92,000: Strong resistance; a breakout here could lead to a rally.
$98,000: The next target if BTC successfully breaks above resistance.
🔻 Major Support Levels:
$82,764: Closest support; a breakdown could trigger further downside.
$78,000 - $80,000: A strong demand zone that could provide a solid bounce if BTC dips further.
📉 POTENTIAL TRADING SCENARIOS
📌 Scenario 1 – Bullish Breakout 🟢
If BTC breaks above $90,000 - $92,000, it could confirm a bullish trend continuation toward $98,000+.
Watch for strong volume confirmation and a clear close above resistance.
📌 Scenario 2 – Bearish Rejection 🔴
If BTC fails to break $90,000 - $92,000, it could retrace to $82,764.
A further break below this level could send BTC down to $78,000 - $80,000 before finding strong support.
⏳ CONCLUSION – PREPARE FOR A BIG MOVE!
📊 BTC is in a critical accumulation phase, setting up for a major breakout soon.
📈 If BTC clears $90,000 resistance, the bullish trend will likely continue toward $98,000+.
📉 If BTC rejects and drops below $82,764, a deeper correction to $78,000 is possible.
⚠ Traders should wait for a clear breakout signal & manage risk carefully ahead of the big move!
📢 Do you think BTC will break out or correct further? Share your thoughts below! 🚀🔥

BTC - Support and Resistance as on 7th marchIn cart green and red lines indicating support and resistance. US President clearly said Do not Sell your Bitcoin. Even though he didnt mention how much will be purchased etc but we have a new Govt going to form a strategic reserve with spending tax money so it could be slow to see banana spikes but I think its going to be Bullish for BTC

BTC - 5th march - chart pattern target 94400As per the chart pattern we can see short term target as 94400 and in 2 days we have US Crypto summit. I think mostly it will move up rather than fall. By now it must have fallen and its not happening so that's why i think price is willing to move up now
BTC - Buy again for Target of 98-100KThis correction is excellent re test of support of Support and once again expecting bounce for target of 98 or 100K. RSI is over sold at the breakout level indicating a good buy level. having 7th march - Bitcoin summit as double support I only expect price to rise again ....

Bitcoin Fresh Technical Analysis and Price Prediction AnalysisBTC/USDT – Technical Analysis Update
📊 Current Price: ~$93,000
📈 Recent Move: Strong bounce from $79,000, surging $17,000 in just a few hours.
Key Technical Levels & Market Structure
🔸 Resistance Zone: $95,000 – This level acts as a critical supply zone. A strong rejection here may trigger short-term corrections.
🔸 Breakout Confirmation (BOS - Break of Structure): A decisive close above $99,600 with volume could confirm bullish continuation towards new highs.
🔸 Support & Downside Risk:
If BTC fails to hold above $95,000, a pullback towards $75,000-$70,000 remains a possibility.
EMAs & Trendline Support: Watch for dynamic support from 50 EMA & ascending trendline in case of retracement.
Market Outlook:
- BTC remains in a bullish structure, but volatility is high.
- RSI & Volume Analysis: Overbought conditions on lower timeframes suggest possible consolidation before the next leg up.
⚠️ Risk Management: Always trade with stop-loss and avoid overleveraging in this volatile market.
📡 Stay tuned for real-time insights!
Note: NFA & DYOR

BTC#19: “Cryptocurrency Reserves” and trading plants💎 💎 💎 After Trump posted about his plan to put BTC into the national cryptocurrency reserve, BINANCE:BTCUSDT BINANCE:BTCUSD had a meteoric rise back to 93~95x. Let's plan to trade BTC: 💎 💎 💎
1️⃣ **Fundamental Analysis:**
📊 The current market is dominated by “US crypto assets”.
🚀 Trump: Will put BTC into the national reserve, this will help the crypto sector break out. However, it is also important to note that the US lacks budget support and crypto reserves are just empty words at present.
📌 The probability of the Fed keeping interest rates unchanged in March is 93%.
It can be seen that the current cash flow injected into the market is not really significant because interest rates have not yet decreased and the US tariff policy is still waiting to cause an economic war. Current news plays a role in restraining the downward momentum and fear in the recent past.
2️⃣ **Technical analysis:**
🔹 **Frame D**: it can be seen that the price is looking for an important resistance area. Note that the current price structure is decreasing, so the price can still turn around at any time when it touches the diagonal resistance zone.
🔹 **Frame H4**: It is clear that yesterday's increase has not yet had any technical recovery to be able to break through the current resistance zone.
🔹 **Frame H1**: Temporarily, the price is still in an upward trend influenced by yesterday's positive news. The previously broken trendline will act as an important support for the price to break out in the near future
3️⃣ **Trading plan:*
⛔ The current area is no longer ideal for establishing a trading position, if the price still has no recovery, we can consider looking for a SELL position when the price reaches the diagonal resistance area when a price structure appears on a smaller time frame. BUY should only be made if the price recovers and accumulates in the old resistance area and an increasing price structure appears on a smaller time frame.
✅ On the D and H4 time frames, the price structure is still bearish, besides, H1 has increased strongly without any technical recovery due to the influence of positive news. So we can completely wait for a trading opportunity when the price finds an important resistance and support zone.
💪 **Wishing you success in achieving profits!**

SOLANA DOWN 57% FROM ATH! 🚨 SOLANA DOWN 57% FROM ATH!
People are panicking! But is this just a dip before CRYPTOCAP:SOL pumps to $500? 🤯
Smart investors buy dips, not fear! 🚀
What do you think? Buy or sell? Comment below! 👇💬

Bitcoin Ready for $69000 ?#Bitcoin followed my chart PERFECTLY! 🚀🎯
I warned you, but some laughed. Who’s laughing now? 😏
From $108K to $79K—NEXT STOP: $75K-$70K (prime accumulation zone!) 🔥
Who’s buying this dip? 🤔👇

Bitcoin - Targets 116K 126K 148KIn chart i have shown why price is holding at 83K and may not fall further now. Price height from Point of Control to ATH is all most equal to the price range from POC to low of 83 K . IT could have been taken support at 87 or above 83 but due to fear it has seen 83. True some selling came from various sources and little frauds too. But still price is acting technically now. And in wave theory its completion of 4th wave and once support seems to be taking at 83K and move in 5th wave then targets are coming as 116, 126 and 148 K. Serious. These are 5th wave levels as per wave theory. BTC is sure Bullish and soon +ve news are expected and price will follow the Bullish trend. Time duration is not sure up price will march up and up only

BTC#18: BTC plunges, destination and trading opportunities at th🔥 So BTC has corrected. However, how much it has decreased, we will analyze it right away: 🔥
1️⃣ **Fundamental analysis:**
📊 Widespread Pessimism, Cryptocurrency Market Plunges Sharply
————
⚫Bitcoin and altcoins plunge: Bitcoin drops nearly 5% to $90,000, Ethereum loses more than 10% in two days, Solana drops 15%, Dogecoin drops 13%.
⚫The market is still affected by the $1.4 billion hack last week. Bybit announces compensation but Ethereum is still under pressure.
⚫Weak market sentiment: Many meme coins collapse, limited capital flows cause altcoins to lose value sharply. Solana under selling pressure as it prepares to unlock $1.72 billion in tokens on March 1.
⚫Crypto-related stocks also plunge: Coinbase down for six consecutive sessions, MicroStrategy down 5.7%, BTC mining stocks fall sharply.
🚀 MicroStrategy continues to buy BTC: The company bought another 20,356 BTC worth $1.99 billion, bringing its total BTC holdings to 499,096 VND (~$33.1 billion).
🛫Forecast: The downtrend may continue if market sentiment does not improve and cash flow does not return to altcoins.
2️⃣ **Technical analysis:**
🔹 **Frame D**: the bullish structure has been broken and turned bearish. Pessimistic sentiment covers the entire market so it will be difficult to see an immediate recovery
🔹 **H4 frame**: the bearish price structure is more clearly shown. The nearest resistance zone is 93x
🔹 **H1 frame**: the price line is still quite far from the horizontal or diagonal resistance zone, the current price has recovered a bit but the market sentiment is still hesitant about the Fibo 23.6 area as you can see on the chart
3️⃣ **Trading plan:*
⛔The current time is not suitable to catch the bottom of BTC, not only the market sentiment is pessimistic but the basic information has not seen any positive news for BTC. We will need to patiently wait for confirmation from the price line
✅ Priority at the moment. Currently is looking for a SELL position following the main trend. The sharp price drop will have a recovery adjustment but pay attention to stick to the price structure and do not be greedy.
💪 **Good luck trading!**

BTC - Good Buy at 91KBTC is different from all other coins and Its Buy level for BTC at 91K. Short Sellers will close before monthly expiry. BTC is sure Bullish only ... once resistance line is broken it will give banana spike this month or next month as per 4 year cycle...

BTC#17: How Does Bybit Affect BTC? Traders Need to Know This!💎 💎 💎After a long time, BINANCE:BTCUSDT has not escaped the SW zone. So what is the market reflecting? Let's analyze the price reaction of BINANCE:BTCUSD in this area: 💎 💎 💎
1️⃣ **Notable news:**
📊 Coinbase co-founder: A settlement has been reached with the US SEC, the related lawsuit is expected to be officially approved and withdrawn next week. The dismissal of the lawsuit is said to bring many positive signals to the cryptocurrency market in general. 🚀 The security incident on Bybit caused a recent decline, recording the outflow of money from Bybit including hackers' money of 2,235 billion USD. However, liquidity during this time was still maintained stable.
📌 This incident shows the solidarity of the crypto industry community, not the fragmentation of previous attacks. It can be seen that the future potential of the industry will develop even better.
2️⃣ **Technical analysis:**
🔹 **Frame D**: The price structure is still bullish, but yesterday's closing candle completely destroyed BTC's previous attempt to increase in price. A bearish engulfing candle shows that it will take more time to accumulate to break out of this SW area or the price will have to find a better support zone to break out.
🔹 **Frame H4**: The price line is still in the SW area, however, the recent increase gives us a signal about the possibility of BTC increasing in price. Let's look at H1 to see this signal more clearly
🔹 **Frame H1**: The temporary price structure is an upward price structure. Although it cannot be immediately, this is an ideal area to wait for a position whether it is BUY or SELL
3️⃣ **Trading plan:*
⛔ The current price area tests the patience of traders. Trading in the SW price zone always erodes trading psychology due to greed and expectation. FOMO every time the price signals a break through the SW zone will erode the account and trading psychology. Wait for a clearer signal from the price reaction.
✅ As you can see the plan in the H1 frame. Waiting for a clearer price structure to establish a position is the top priority. We do not predict where the price will go but look at reality to decide what to wait for. "Trade what you see, not you think"
💪 **Wish you successful trading!**

This is the most possible scenario of BTC in Long TermFirst,
It will go in the First Spot zone
Second,
It will fill the CME gap
Third,
Retest and Breakout
Fourth,
Bull Run
Let's see

Bitcoin - Bullish and strong Buy - Target 104KMultiple times in my previous charts i have said price below 97K is seeing buying by big players. Which is very very clear in chart with multi month and week support visible in chart. Any price below 97K is being bought by big players in US and these days outside US as well. Multiple people clearly pointed out the money flow into Bitcoin which is visible in other indicators. only because of long weekend price is sideways to bearish in short term which is cleverly accumulated by big players. I am expecting price above 100K in coming days to test the previous strong resistance above 104K for now.

BTC#16: Price reaction has changed positively.BTC break out SW?💎 💎 💎 In recent days, although important data information has been released, BTC is still in the Sideway zone and there are some positive signs. We continue to plan the next 💎 💎 💎
1️⃣ **Fundamental analysis:**
📊 Financial report, Fed Logan said that if the labor market remains strong, better inflation data does not necessarily mean the Fed can cut interest rates. Inflation data in the next few months will be very important; also pay attention to changes in geopolitics and policies; the impact of these factors on the economy is being closely monitored.
🚀 GameStop is considering investing in Bitcoin and other cryptocurrencies.
Three sources said GameStop is exploring investing in alternative assets, including cryptocurrencies, especially Bitcoin. GameStop shares rose nearly 20% in after-hours trading following the news.
2️⃣ **Technical analysis:**
🔹 **D Frame**: We can see that although the price has not yet escaped the Sideway zone, the continuous appearance of higher lows is a positive signal to pay attention to.
🔹 **H4 Frame**: After the price reaction at 94x, although the 97x zone has not been penetrated, the price reaction in this area is giving positive signals
🔹 **H1 Frame**: The price structure has a change from bearish to bullish. If the trendline area continues to hold, there is a high possibility that the bulls will continue to dominate next week.
3️⃣ **Trading plan:*
⛔ The economic data released last week brought many fluctuations to the US dollar, but the price of BTC still did not have any significant changes. However, with the current price reaction, we should not apply the trading strategy in the SW price zone anymore. The 2 price zones have been tested quite a lot. This is a sign of an upcoming strong fluctuation
✅ The short-term price structure is in favor of the bulls. We can consider looking for a position if the price structure shows signs.
💪 **Good luck trading!**
