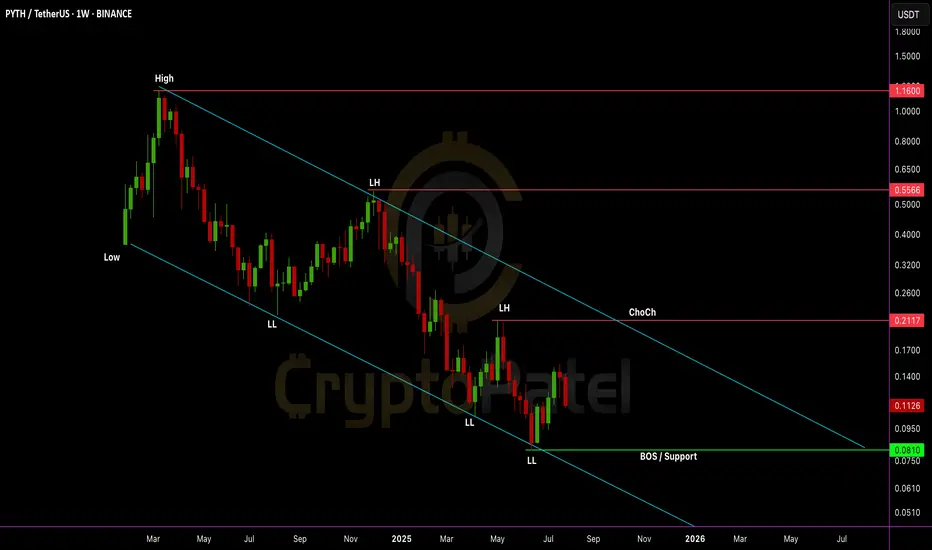
Will $PYTH go to $1 or drop even lower?Will EURONEXT:PYTH go to $1 or drop even lower?
Chart is still bearish with LL + LH structure.
But $0.0810 is a key level. If it holds, a trend reversal is possible. Accumulation zone: $0.085–$0.110
Risky entry, but R:R is huge. Hold = 10x potential to $1+
Break below $0.0810 = new LL incoming.
NFA & DYOR
BTC
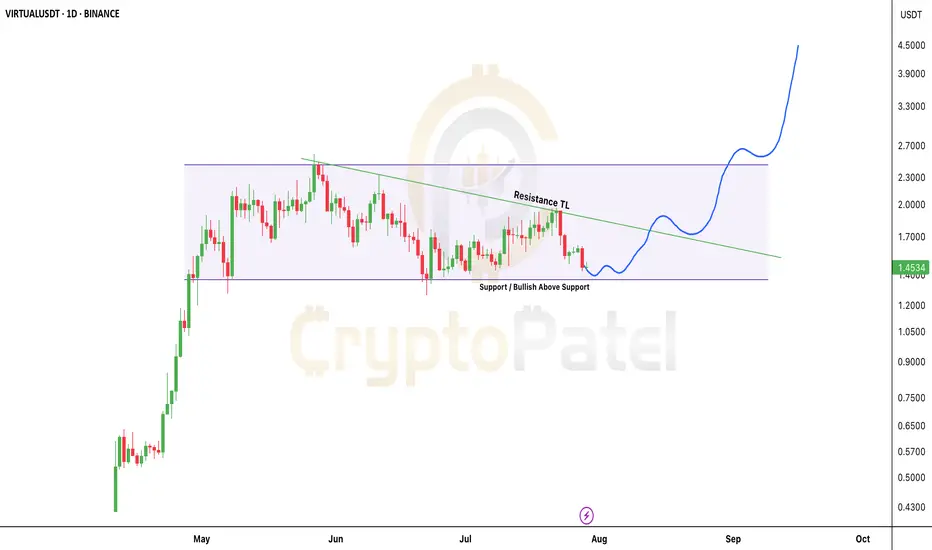
$VIRTUAL Gaining strength- hold above $1.30 could send it to $5$VIRTUAL/USDT: SPARKS:VIRTUAL is Gaining strength- hold above $1.30 could send it to $5+
Price is respecting the accumulation range between $1.30–$1.60 with multiple successful retests of the demand zone at the base.
🔹 Structure: Accumulation phase within a descending triangle
🔹 Support: Strong base at $1.30 – bulls defending this level consistently
🔹 Resistance: Descending TL compressing price- breakout imminent
🔹 Bias: Bullish above $1.30
Expectations:
✅ Clean breakout above the TL (~$1.60) will flip structure bullish
✅ Post-breakout targets: $2.00/$2.70/$4.50+
✅ If $1.30 continues to hold as HTF support, I’m expecting $5+ in the coming days.
Invalidation: Any HTF close below $1.30 shifts the bias.
Watch for breakout volume- confirmation will trigger rapid upside movement.
NFa & DYOR
Will Polkadot Hit $50 Again ?Polkadot Looks Ready to Explode — $3 Might Be the Bottom, and $30+ Could Be Next
DOT is consolidating in the $4–$3 Accumulation Zone, right at the retest of a multi-year trendline breakout.
🔹 IMO: Best accumulation range = $4.00–$3.00
🔹 Holding this zone could trigger a macro reversal
🔹 HTF structure favors bullish continuation if support holds
Targets = Key resistances: $9.24 / $16.67 / $40.85
Expecting $30+ this bull run- $50 is the bonus target.
❌ Invalidation: HTF close below $3 = Exit
NFa & DYOR

BTCUSDT – short-term pullback before heading higherBTCUSDT remains within a clear ascending channel. On the H8 timeframe, price is facing resistance and may pull back toward lower support before continuing its upward move. Several Fair Value Gaps below act as strong backing zones for buyers.
On the news side, market sentiment is improving as investors anticipate the upcoming PCE report and renewed interest in Bitcoin ETFs. Although the Fed holds its hawkish tone, rising recession risks are fueling expectations of a rate cut later this year.
Strategy: Consider BUY setups if price pulls back into support and shows strong reaction. Trend remains bullish unless the ascending structure is broken.

Buy BTC @ 117250 area - FIB LevelEvery one know BTC is in 5th main wave and in that it has done first wave and now second correction wave which is mostly 50% FIB level of first level coming at 117250 area where i strong suggest every one to buy long positions again in BTC

ENA/USDT Now 200% up from our EntryMIL:ENA Update: Strong Momentum in Just a Few Days
I shared an early entry below $0.25, and now MIL:ENA is trading above $0.67 that’s nearly 2.8x your capital from our entry.
Both Target 1 and Target 2 have already been hit.
I remain very bullish on MIL:ENA for the long term, with a potential to reach $5. However, keep in mind the risk is higher at this stage, but the reward could be significant if it reaches that level.
If you entered early, consider booking some profits or at least secure your principal and let the rest ride.
Thanks to everyone who trusted my analysis, slow and steady can bring big returns.
NFA & DYOR

is $VIRTUAL about to fly to $8?Don’t ignore this setup – is SPARKS:VIRTUAL about to fly to $8?
Price action is currently displaying a bullish flag structure on the daily chart — a continuation pattern following a strong impulse leg.
🔸 Impulse Move (Flagpole): +335% vertical rally
🔸 Consolidation Phase: Descending parallel channel forming the flag
🔸 Market Structure: Bullish continuation intact as long as the lower trendline holds
Technical Levels:
▪️ Support Zone: $1.30–$1.10 (confluence of demand & trendline support)
▪️ Breakout Confirmation: Clean daily close above $2.00 with elevated volume
▪️ Projected Target: $8.18 (measured move = flagpole height from breakout level)
Observations:
▪️ No structural breakdown observed — price respecting flag support
▪️ Volume remains muted during consolidation — typical in bullish flags
▪️ Breakout potential increases if price compresses toward apex with decreasing volatility
Invalidation: Break below $1.10 on high volume would shift bias neutral/bearish.
Strategy: Watch for breakout + retest confirmation above $2.00 to target $8.18. Risk can be defined below lower trendline support.
Note: NFa & DYOR

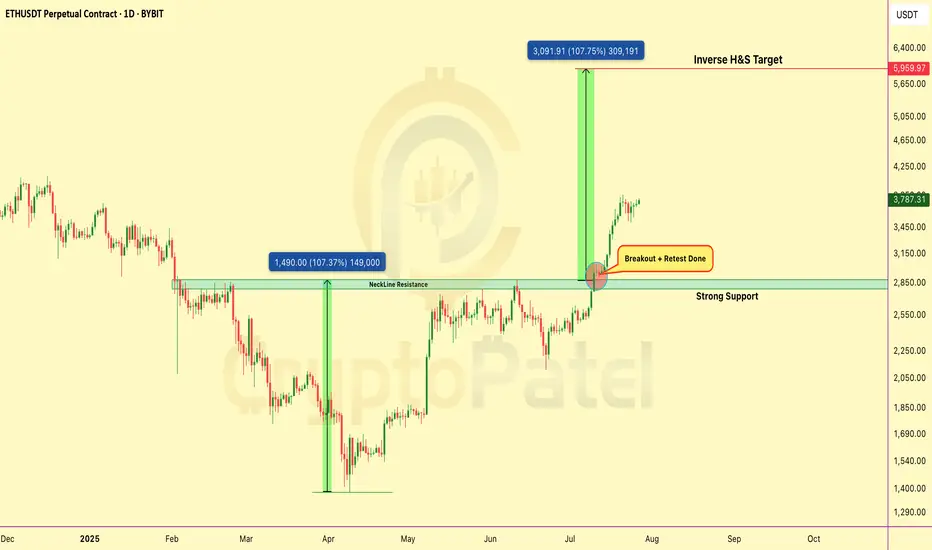
Ethereum Breakout Confirmed – Retest CompletedCRYPTOCAP:ETH has broken out Inverse Head & Shoulders on daily chart.
✅ Neckline breakout above $2,850
✅ Retest successful – strong support confirmed
✅ Targeting full move toward $6,000
Structure is bullish, momentum building. As long as #Ethereum holds above the neckline, continuation is likely.
Note: NFA & DYOR
BTCUSDT – Ready to Break the Resistance Wall?Bitcoin just made a perfect rebound from the $115,000 support zone and is now gathering momentum toward the $119,097 resistance. While price remains inside the descending channel, price behavior suggests a potential bullish breakout.
Latest news:
Grayscale confirmed an additional $1.2 billion investment into its Bitcoin fund.
The Fed is signaling a possible pause in rate hikes at the upcoming meeting → weakening USD → direct boost for BTC.
Technical outlook:
FVG zones have been filled → selling pressure is fading.
A “bounce – retest – breakout” formation is emerging.
The descending channel is under pressure, and buyers seem to be gaining control.

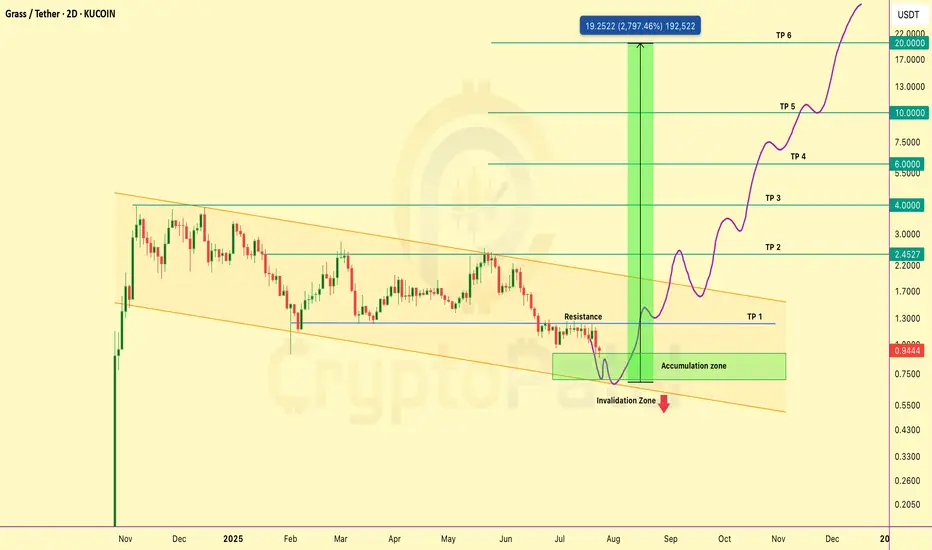
GRASS could grow 10x in this bull run: Don’t ignore this AIGRASS could grow 10x in this bull run: Don’t ignore this AI project
Price is consolidating inside a falling wedge and holding the key accumulation zone around $0.60–$0.85.
A breakout above trendline resistance could trigger a strong bullish move.
🔸 Structure: Falling wedge
🔸 Invalidation: Close below $0.55
Targets on breakout: $1.30 / $2.45 / $4 / $6 / $10 /$20
Fundamental Highlights
🔹 DePIN x AI powered by Solana
🔹 Share your unused internet and earn $GRASS
🔹 Backed by Polychain & Tribe Capital
🔹 Over 2M users across 190 countries
🔹 ZK-proof privacy, passive income, and scalable L2 infra
🔹 Only 29% supply unlocked, next major unlock in Oct 2025
This isn’t just another altcoin. GRASS is building the decentralized data layer for AI.
NFA & DYOR
BTCUSDT – Charging Ahead in an Ascending Channel, Eyes on 120K!Bitcoin is gliding steadily within a rising channel, consistently printing higher highs and higher lows. After tagging the 120K psychological zone, price made a healthy pullback to key support and bounced back swiftly — reaffirming buyer dominance.
Price action reveals sustained bullish momentum, especially with key U.S. economic data on the horizon. If risk-on sentiment holds, BTC is well-positioned to break past psychological resistance and unlock the next leg higher.
This pullback? It’s not weakness — it’s a setup. And the market is gearing up for another breakout move.

BTCUSDT – Rebounding from Fair Value Zone! Is the Bull Run Back?Bitcoin is building a strong base around the FVG support zone after rejecting the resistance trendline twice in a row. The current price structure is a textbook bullish setup: pullback – retest of liquidity zone – accumulation – and now prepping for a strong breakout.
Fair Value Gaps have been consistently filled and are acting as dynamic support, signaling that buyers are still in full control. RSI remains steady and not overheated – creating perfect conditions for a breakout.
Target: The 125,910 USDT area is the next clear price objective if BTC holds above the 116,082 USDT support zone.
Fundamental Catalyst: The crypto market is regaining strength after BlackRock officially confirmed its plan to expand its crypto ETF products – investor sentiment is back on the bullish side.
will $LTC/USDT ready for $500 in bull run?CRYPTOCAP:LTC Took Off from $55 — Now Gaining Momentum Again, and $500 Might Be Closer Than You Think
CRYPTOCAP:LTC has delivered strong gains from both our entries:
✅ First entry at $55 — now up 140%
✅ Second entry at $70 — currently up 85%
Currently, CRYPTOCAP:LTC is trading around $117, sitting right at a key resistance level.
If this resistance breaks, we could see a strong rally toward $300–$500 in this bull run.
My Target:
I’m still expecting $500 as a realistic target and anything beyond that is a bonus.
NFA & DYOR

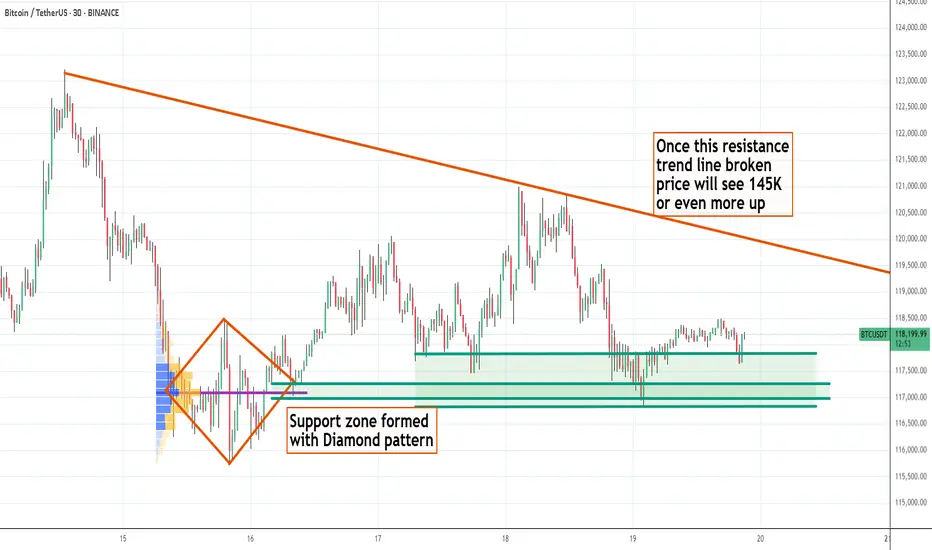
BTC - 19th July - Bullish with sideway correction - Target 145KBTC has been bullish with fundamental reasons - Fiat US $, US Govt Crypto Policy and non stop accumulation by Saylor and ETF, corporates etc ... every week and month new corporates adapting BTC After a good move price is now seeing side way correction and once the newly formed resistance line taken, I strongly expect BTC price to see 145 K easily
DOGE Long Swing Setup – Institutional Narrative Heating UpThe Dogecoin narrative is back in focus! Bit Origin ( NASDAQ:BTOG ) is raising $500M to build one of the world’s largest DOGE treasuries—becoming the first U.S.-listed company to treat CRYPTOCAP:DOGE as a core asset. With institutional interest rising, DOGE could see renewed momentum. Our last trade surged 50%—here’s the next entry:
📌 Trade Setup:
• Entry Zone: $0.20 – $0.21
• Take Profit Targets:
o 🥇 $0.23 – $0.24
o 🥈 $0.27 – $0.28
• Stop Loss: Daily close below $0.18
#crypto #DOGE #BTOG

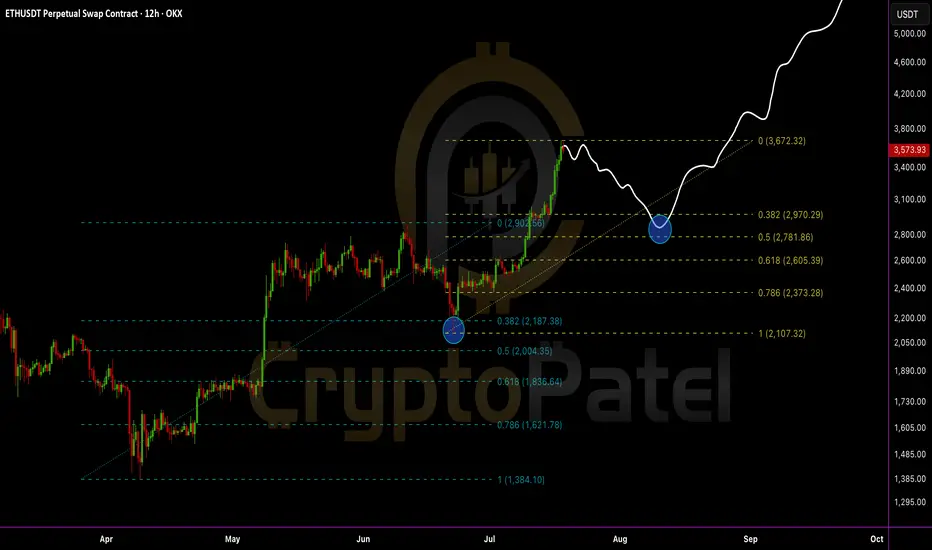
Everyone’s bullish now… but smart traders are waiting for this EEthereum just tapped a key resistance near $3,672 and is starting to show signs of cooling off.
A healthy retracement could bring ETH back to:
0.382 Fib – $2,970
0.5 Fib – $2,781
0.618 Fib – $2,605 (Strong demand zone)
IMO, we can expect ETH to revisit the $2,700–$3,000 zone before the next leg up.
This area will be the golden re-entry for long-term targets of $6,000–$8,000.
Stop-loss: Recent high and candle close above $3,675
Structure remains bullish:
✅ Previous dips into Fibs triggered strong buybacks
✅ Clean higher highs and higher lows
✅ Demand zone + retracement = opportunity
My View: Let price pull back. Then load up again. Bigger wave incoming.
DYOR | NFA
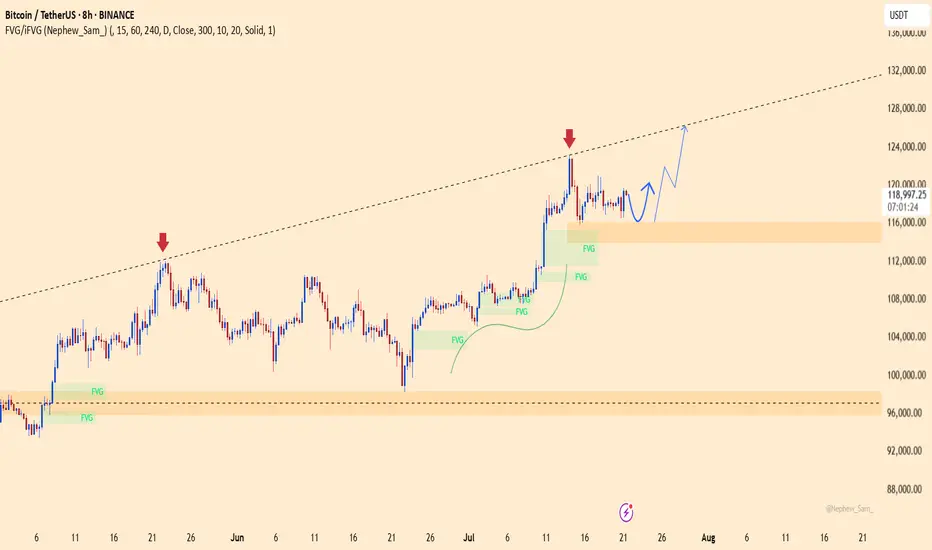
BTCUSDT – Breakout confirmed, bullish momentum continuesBTCUSDT has officially broken above a long-standing resistance channel, confirming a breakout and establishing a base around the nearest Fair Value Gap. The price action maintains a clear uptrend structure with consecutive higher lows and higher highs, supported by consistent buying pressure after minor pullbacks.
In terms of news, the U.S. decision to temporarily delay stricter regulations on spot Bitcoin ETFs, along with stable interest rate signals from the Fed, has boosted market sentiment. Capital continues to flow into crypto, especially as altcoins show limited recovery, making BTC the preferred asset.
As long as BTCUSDT holds above the nearest support zone, the pair is likely to advance toward the next psychological resistance. Any pullbacks could offer a buy-on-dip opportunity in line with the current trend.

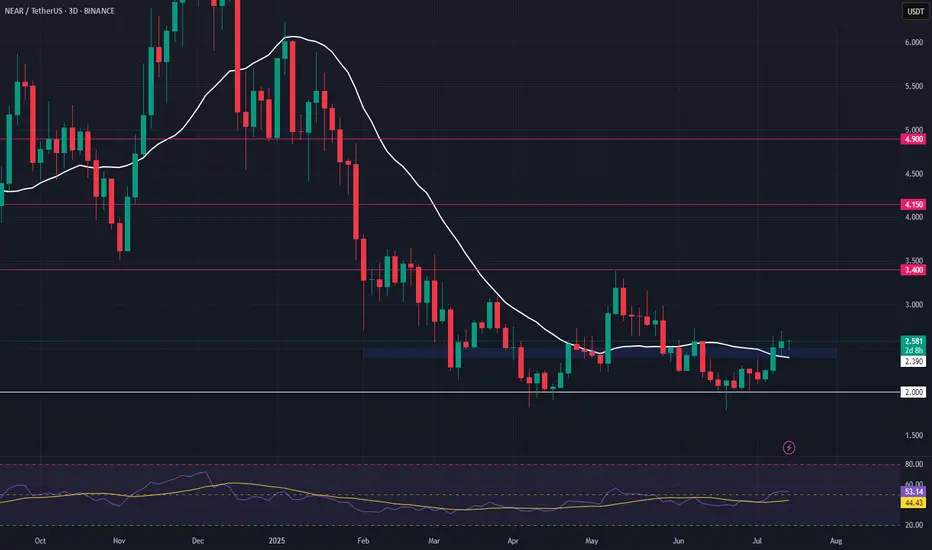
NEAR – High-Timeframe Double Bottom & Bullish DivergenceNEAR is showing strong signs of support, forming a high-timeframe double bottom with bullish divergence after a clean sweep of the $1.80 level. Price has now reclaimed the 20-day SMA, adding confidence to the setup.
📌 Trade Setup:
• Entry Zone: $2.40 – $2.50
• Take Profit Targets:
o 🥇 $3.40
o 🥈 $4.15
o 🥉 $4.90
• Stop Loss: Daily close below $2.00
THETA Long Swing Setup – Bullish Divergence & Range Low ReclaimTHETA has formed a strong bullish divergence off a double bottom, following a deep liquidity sweep to $0.56. With price now reclaiming the 20-day SMA, signs point to a local bottom and potential range low deviation.
📌 Trade Setup:
• Entry Zone: $0.70 – $0.75
• Take Profit Targets:
o 🥇 $0.95 – $1.00
o 🥈 $1.60 – $1.72
o 🥉 $2.13 – $2.25
• Stop Loss: Daily close below $0.65

BTCUSDT: Strong Uptrend, Targeting New HighsBTCUSDT is in a very strong uptrend, consistently setting new highs driven by overwhelming buying pressure and green Fair Value Gaps (FVGs).
Currently at $125,144, Bitcoin could reach $134,128 around July 21, 2025. This rally is fueled by ETF approvals, the Halving effect, a favorable macroeconomic environment (safe-haven, inflation hedge), and the expanding crypto ecosystem.
The preferred strategy is to buy on dips or breakout of resistance, always managing risk tightly.

THENA shows bullish momentum, expanding its community and integrRecent Highlights:
Community Growth: Launched an Italian Telegram community (July 14), signaling localized expansion.
V3.3 Upgrade (May): Enhanced BNB Chain liquidity through modular pools and improved capital efficiency.
Vooi V2 Integration (July 1): THENA's liquidity pools are now accessible via Vooi's chain-abstracted perpetuals platform, potentially boosting protocol fee revenue.
Binance Ecosystem Ties: Vooi's backing by YZi Labs (ex-Binance Labs) suggests strategic alignment with BNB Chain.
Governance Automation: veTHE holders can now vote across chains without bridging, streamlining decentralized decision-making.
Market Performance: Trading volume spiked 307% to $45.9M (24h) alongside Bitcoin's new All-Time High (ATH), indicating correlation with DeFi volume trends.
Outlook: THENA is positioned as a key BNB Chain liquidity provider, but its recent price gains face sustainability tests in a competitive DEX market like PancakeSwap. Its ve3,3 model, with features like modular liquidity and cross-chain voting, aims to differentiate it as chain-abstracted trading becomes standard.

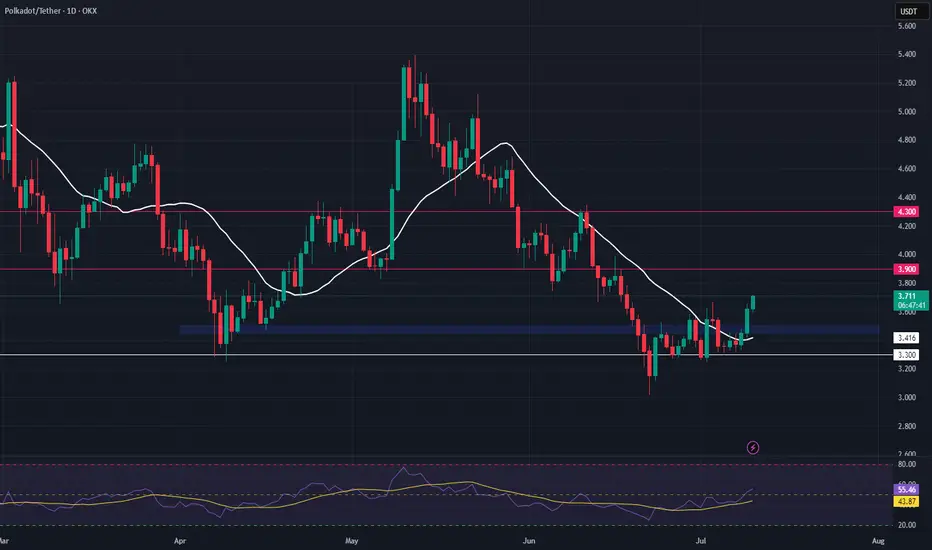
DOT Long Swing Setup – Structural Recovery with Support RetestDOT is showing early signs of recovery, reclaiming its 20-day SMA and flipping key horizontal resistance into support. We’re now watching for a retest of the $3.45–$3.50 zone to confirm the level and trigger a long entry.
📌 Trade Setup:
• Entry Zone: $3.45 – $3.50
• Take Profit Targets:
o 🥇 $3.90
o 🥈 $4.30
• Stop Loss: Daily candle close below $3.33
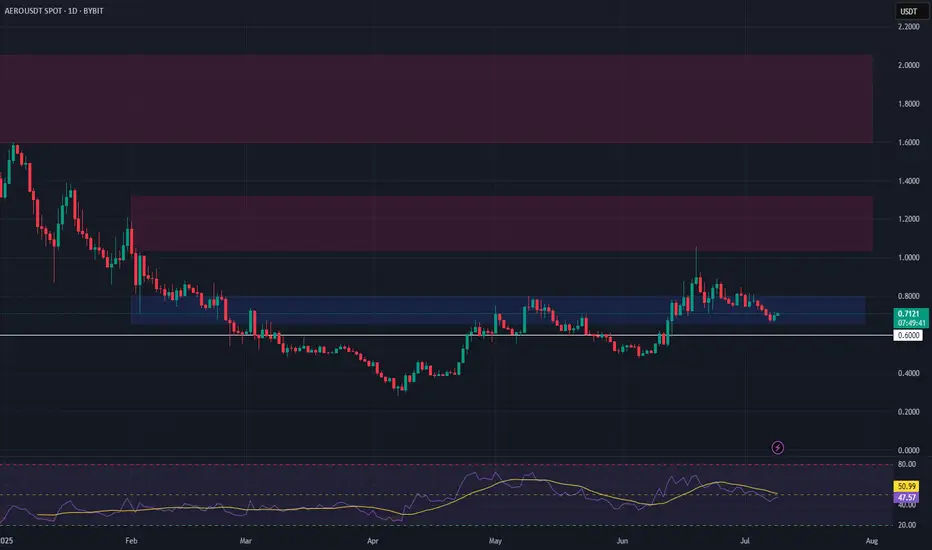
AERO Long Swing Setup – Retest of Range Low SupportAERO has pulled back to test the bottom of its range, now sitting at a key support zone. This offers a potential long swing entry as buyers look to defend the $0.66–$0.80 area.
📌 Trade Setup:
• Entry Zone: $0.66 – $0.80
• Take Profit Targets:
o 🥇 $1.04 – $1.32
o 🥈 $1.60 – $2.05
• Stop Loss: Daily close below $0.60