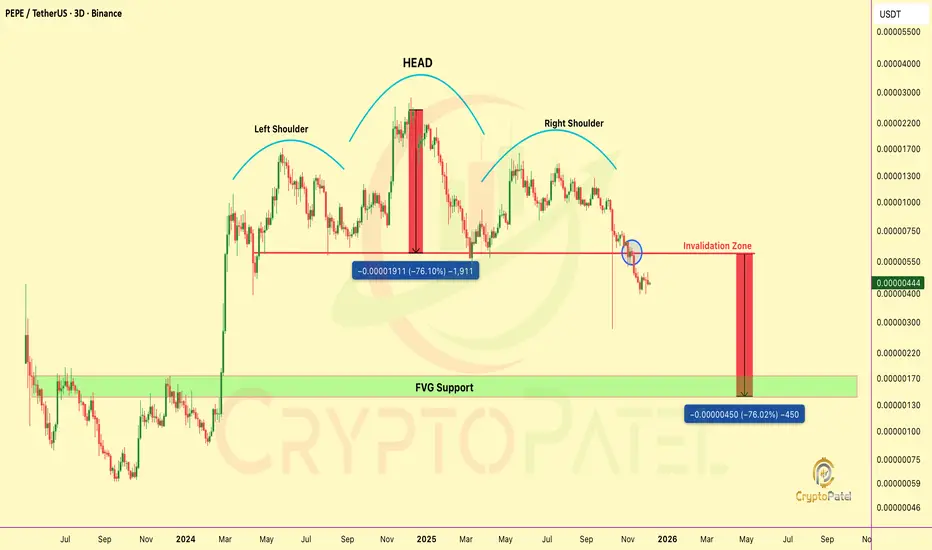
$PEPE TA Update: What PEPE Head & Shoulder Pattern Say?CRYPTOCAP:PEPE TA Update: What PEPE Head & Shoulder Pattern Say?
Head & Shoulders = Bearish
70% retracement possible ( Neck Line Support Broken )
Key Support $0.000006, Now Strong neckline support became strong resistance
Below NeckLine Support = 50-70% drop to $0.00000150
Hold & reclaim $0.000006 = bullish Reversal
NFA & DYOR
BTC
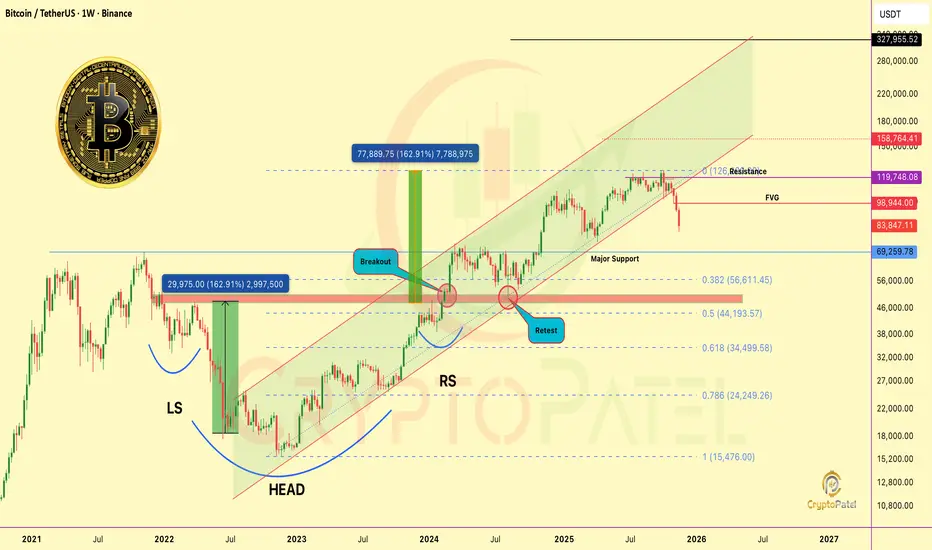
BTC Breakdown Confirmed – Here’s Where BTC Could Surge NextBTC Breakdown Confirmed – Here’s Where BTC Could Surge Next
1️⃣ Long-Term Trendline Breakdown Confirmed
🔹 BTC has decisively broken the multi-year ascending trendline supporting price since Nov 2022.
🔹 The Breakdown + Retest at ~$104k-$108k confirms bearish structure ✅.
🔹 Retest failed in Oct 2025, confirming sellers are in control.
2️⃣ Fibonacci Levels Highlight Strong Demand
🔹 Price is now hovering between 0 Fib ($125,647) and 0.382 Fib ($56,494).
🔹 Measured move Targets: Strong Demand Zone $34,477 - $56,494 (0.618 - 0.382 Fib)
🔹 This is the accumulation zone for long-term positions, historically providing strong bounce potential.
3️⃣ Critical Support / Resistance Zones
🔹 Immediate Support: $85k-$87k (psychological)
Major Support:
🔹 $56,494 (0.382 Fib, upper demand)
🔹 $44,133 (0.5 Fib, middle demand)
🔹 $34,477 (0.618 Fib, “Golden Pocket”, lower demand)
Resistance: Broken trendline now acting as key supply
4️⃣ Potential Scenarios
Bearish (High Probability)
🔹 Continuation down to Strong Demand Zone ($34k-$56k)
🔹 Represents 38-61% retracement from ATH, typical after trendline breakdown + retest
Bullish (Needs Reclaim)
🔹 Reclaim broken trendline (~$95k-$100k)
🔹 Close above $104k = false breakdown, continuation to new highs
Why I’m Watching $56,500 - $34,500 for Longs
🔹 Historical accumulation zone with high probability of a strong bounce
🔹 After breakdown + retest, price often retraces to 0.5 or 0.618 Fib before resuming bull trend
🔹 Perfect long-term entry for those aiming for multi-year BTC upside
BTC may test the $56k-$34k demand zone soon. For long-term holders, this is a prime accumulation area before the next bull cycle. Stay patient and strategic – $1M BTC dreams require discipline, not FOMO.
Guys, don’t judge me: I’m a Bitcoin lover too. I’m just reading what the chart is showing. Even if the short-term looks bearish, I see the setup for a massive long-term move toward $1M 🚀
NFA & DYOR

$BCH hasn’t hit a new ATH since 2017: Dead or Utimate Sleeper?SET:BCH hasn’t hit a new ATH since 2017: Dead or the Utimate Sleeper?
SET:BCH ATH: $4,212 (Dec 2017)
CRYPTOCAP:BTC ATHs: $19,800 (Dec 2017), $69,000 (2021), $126,000 (2025)
Observation:
SET:BCH hasn’t touched a new ATH since 2017.
CRYPTOCAP:BTC surged 6x+ after 2017 ATH, but SET:BCH stalled.
Is SET:BCH dead ❓
Key TA Levels:
🔹 Strong accumulation zone: $465 – $375
🔹 Critical support: $375 (holding this is essential)
🔹 Potential upside: $2,000 – $4,000 if momentum returns
Eyes on these levels. SET:BCH could be a sleeper play if it reclaims support.
Pro Tip: Patience + volume confirmation = key before any breakout.
NFA & DYOR

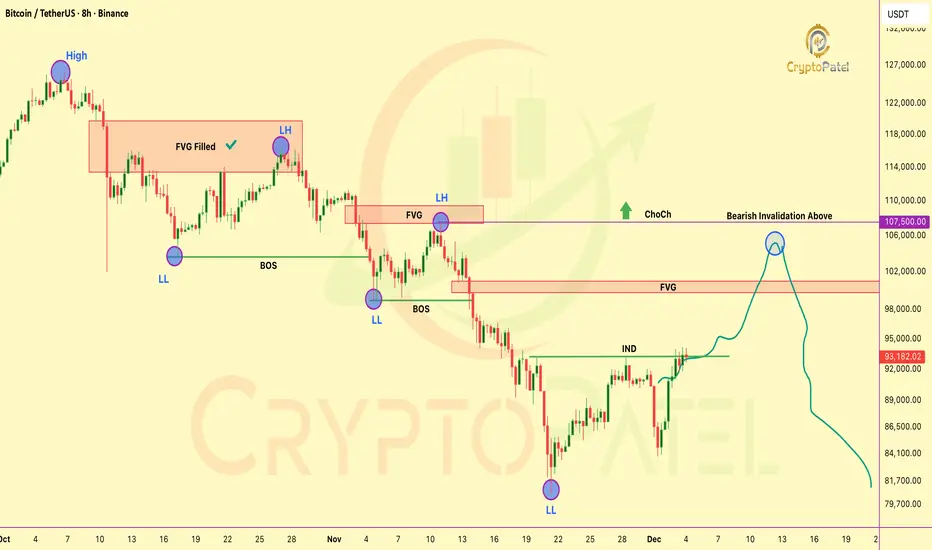
HTF ChoCH Alert: BTC’s Macro Bias Is Still BearishHTF ChoCH Alert: BTC’s Macro Bias Is Still Bearish
BTC is still following clean HTF bearish order-flow (LH → LL → BOS).
The current push up is just a premium retracement, driven by internal liquidity grabs.
Price is reaching for the premium FVG at 99,866–101,184, the next clear draw on liquidity and a prime reversal zone.
Below 107,500 bias stays bearish (Bearish Invalidation / HTF ChoCH)
Expect: BSL sweep → FVG fill → mitigation → sell-side continuation.
ICT view:
Market is simply rebalancing inefficiency before delivering lower.
NFA & DYOR
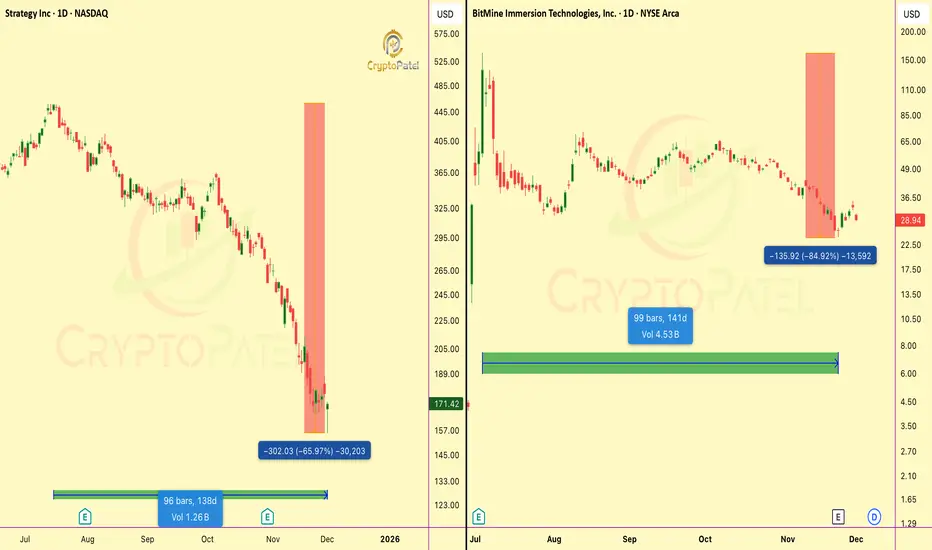
TOP TREASURY COMPANIES BLOODBATHTOP TREASURY COMPANIES BLOODBATH
👉 NASDAQ:MSTR : -64% from ATH ($457→$156) ( BITCOIN TOP HOLDER)
👉 AMEX:BMNR : -82% from peak ($161→$25) (ETHEREUM TOP HOLDER)
Is this capitulation or just the beginning?
NFA & DYOR
BTCUSD — extending the declineThe most likely scenario I see is a move to the 70k area or slightly lower. From that level we can then look for the next move.

$TRUMP TOKEN: A 92% MASSACRE IN JUST 316 DAYS$TRUMP TOKEN: A 92% MASSACRE IN JUST 316 DAYS: WHAT THE HELL JUST HAPPENED? 😡
Let’s talk about the BRUTAL reality of celebrity/president tokens:
THE NUMBERS DON’T LIE:
🔹 ATH: $79.70 (January 19, 2025)
🔹 TODAY: $5.69 (December 1, 2025)
🔹 DOWN 92.58% IN LESS THAN A YEAR
316 DAYS: Not even a full year and your portfolio is DESTROYED.
THE REALITY CHECK:
If you bought $1,000 at ATH → Your bag is worth only ~$71 TODAY 💀
WHO PROFITED?
✅ Early insiders who dumped on retail
✅ VCs who got free or discounted tokens
✅ Influencers who promoted and then silently exited
WHO GOT REKT?
❌ Retail investors who FOMO’d at the top
❌ Newbies who trusted the hype
❌ Anyone who didn’t take profits
MY REPEATED WARNING:
NEVER INVEST IN INFLUENCER/PRESIDENT TOKENS!
This is exactly why I keep saying:
🔹 Don’t chase celebrity coins
🔹 Your money is HARD-EARNED
🔹 These are pump & dump schemes disguised as “movements”
Is this crypto or a 3rd class memecoin casino? YOU DECIDE.
LESSON: Hype doesn’t pay bills. Due diligence does.
STAY SAFE. TRADE SMART. PROTECT YOUR CAPITAL.
NFA & DYOR
TShort

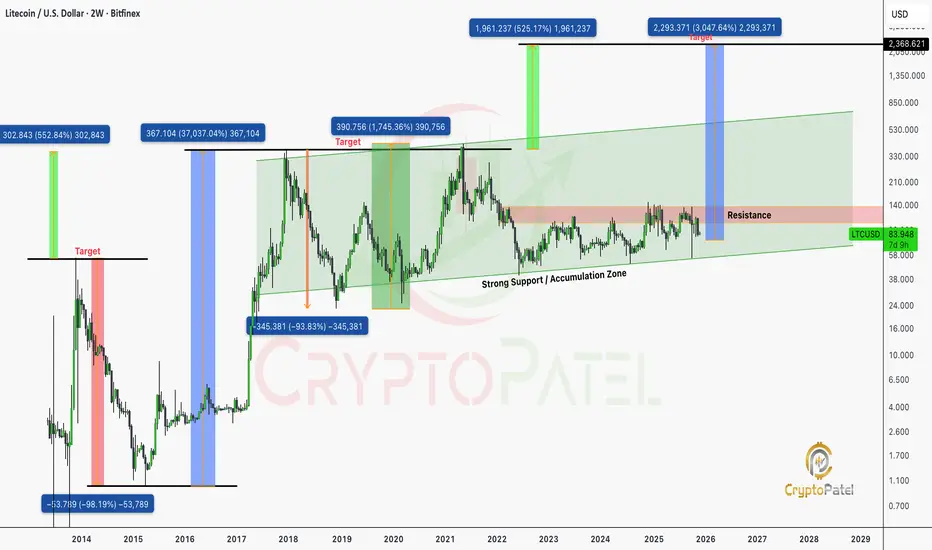
Is $LTC Dead? The Same Question Asked Before Every Major Rally…Is CRYPTOCAP:LTC Dead? The Same Question Asked Before Every Major Rally…
When markets forget history, they repeat it. Litecoin has gone through multiple full-cycle Retracements, Each time followed by explosive multi-X expansions. Let’s walk through the data:
🔰 2013–2015 Cycle: “LTC is Dead” #1
🔹 LTC hit an ATH of $55 from $1.
🔹 Retraced ~98%, bottoming at $0.985 within 16 months.
🔹 Retail sentiment: “LTC is dead.”
🔹 Smart money quietly accumulated.
Result?
$0.985 → $9 in 4 months (≈ +900%)
Eventually: $0.985 → $370 in 3 years (≈ +37,000%)
🔰 2017–2018 Cycle: “LTC is Dead” #2
🔹 New ATH: $370
🔹 Retracement: 92%, down to $23
🔹 Again: retail capitulation.
Result?
$23 → $146 in 6 months
$23 → $413 by May 2021 (≈ +1700%)
🔰 Current Market Structure (2021–2025)
🔹 Previous ATH: $413 (May 2021)
🔹 Current price: ~$84
🔹 Drawdown: 80%
Retail narrative: “LTC is dead.”
TA narrative: This is historically the accumulation zone.
Technical Outlook (Cycle-Based TA Projection)
Every prior deep-cycle retracement (80–98%) has led to:
🔹 Fresh multi-year impulse waves
🔹 New macro highs
🔹 Massive ROI expansion for accumulator wallets
Based strictly on historical cycle symmetry, volatility bands, and LTC’s halving-driven structure:
LTC Bull-Run Projection:
$600 – $1,000 is a reasonable and technically sound target range for the current macro cycle.
This would represent:
🔹 Breaking the 2021 high
🔹 Completing a full 5-wave macro structure
🔹 Returning to historical expansion ratios seen in every prior cycle
So You Already Know What Happens Next.
Litecoin’s entire history is built on max pain → max gain cycles.
Every 80–98% retracement has delivered its largest multi-X rallies after retail gave up.
Smart investors accumulate when the chart says accumulate, not when the crowd screams “dead.”
FINAL MESSAGE
LTC is not dead. It is in the same deep-value zone where every previous mega-cycle began.
If the market delivers another historical impulse, the $600–$1000 range remains a technically justified target.
Accumulate dips.
Ignore noise.
Let the chart speak.
Not Financial Advice so Always Do your Own Research Before Any Investments.
Is $LTC Dead? The Same Question Asked Before Every Major Rally…Is NYSE:LTC Dead? The Same Question Asked Before Every Major Rally…
When markets forget history, they repeat it. Litecoin has gone through multiple full-cycle Retracements, Each time followed by explosive multi-X expansions. Let’s walk through the data:
🔰 2013–2015 Cycle: “LTC is Dead” #1
🔹 LTC hit an ATH of $55 from $1.
🔹 Retraced ~98%, bottoming at $0.985 within 16 months.
🔹 Retail sentiment: “LTC is dead.”
🔹 Smart money quietly accumulated.
Result?
$0.985 → $9 in 4 months (≈ +900%)
Eventually: $0.985 → $370 in 3 years (≈ +37,000%)
🔰 2017–2018 Cycle: “LTC is Dead” #2
🔹 New ATH: $370
🔹 Retracement: 92%, down to $23
🔹 Again: retail capitulation.
Result?
$23 → $146 in 6 months
$23 → $413 by May 2021 (≈ +1700%)
🔰 Current Market Structure (2021–2025)
🔹 Previous ATH: $413 (May 2021)
🔹 Current price: ~$84
🔹 Drawdown: 80%
Retail narrative: “LTC is dead.”
TA narrative: This is historically the accumulation zone.
Technical Outlook (Cycle-Based TA Projection)
Every prior deep-cycle retracement (80–98%) has led to:
🔹 Fresh multi-year impulse waves
🔹 New macro highs
🔹 Massive ROI expansion for accumulator wallets
Based strictly on historical cycle symmetry, volatility bands, and LTC’s halving-driven structure:
LTC Bull-Run Projection:
$600 – $1,000 is a reasonable and technically sound target range for the current macro cycle.
This would represent:
🔹 Breaking the 2021 high
🔹 Completing a full 5-wave macro structure
🔹 Returning to historical expansion ratios seen in every prior cycle
So You Already Know What Happens Next.
Litecoin’s entire history is built on max pain → max gain cycles.
Every 80–98% retracement has delivered its largest multi-X rallies after retail gave up.
Smart investors accumulate when the chart says accumulate, not when the crowd screams “dead.”
FINAL MESSAGE
LTC is not dead. It is in the same deep-value zone where every previous mega-cycle began.
If the market delivers another historical impulse, the $600–$1000 range remains a technically justified target.
Accumulate dips.
Ignore noise.
Let the chart speak.
Not Financial Advice so Always Do your Own Research Before Any Investments.

ETH Could Skyrocket to $7.8K After FUSAKA Upgrade: History ShowsCRYPTOCAP:ETH Could Skyrocket to $7.8K After FUSAKA Upgrade – History Shows
The last Ethereum Pectra Upgrade on 7 May 2025 triggered a massive move:
✅ +55% in 35 days
✅ +168% in 109 days
What’s next?
The FUSAKA Upgrade is scheduled for 3 December 2025. If history repeats:
👉 Target 35 days post-upgrade: $4,500 (7 Jan 2026)
👉 Target 109 days post-upgrade: $7,800 (22 Mar 2026)
Note: This is Purely Fractal Analysis Based on Pectra. Always DYOR – Markets can behave differently, and “Sell the News” Scenarios Happen.
Get ready for a potential ETHEREUM rally!
NFA & DYOR

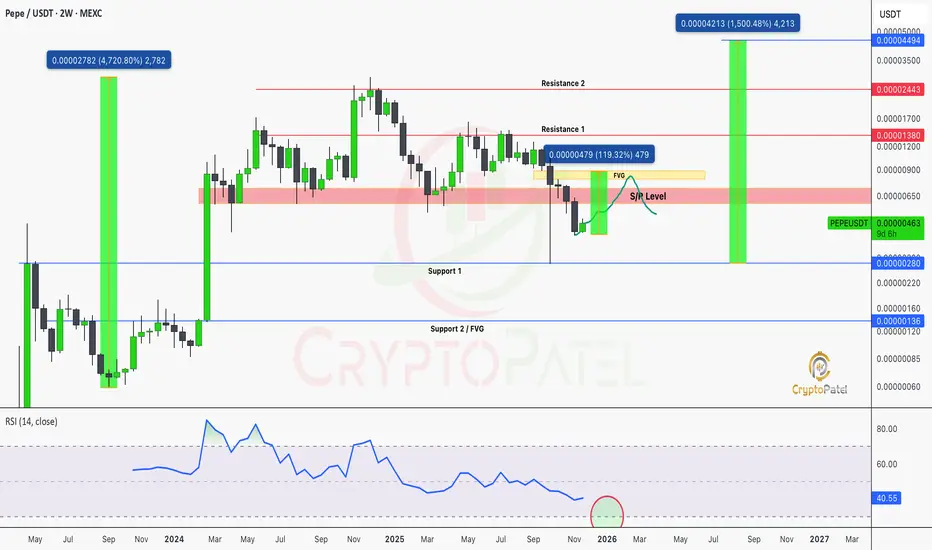
$PEPE Weekly Support Broken Or the Perfect Trap Before a Pump?CRYPTOCAP:PEPE Weekly Support Broken Or the Perfect Trap Before a Pump?
CRYPTOCAP:PEPE lost its weekly support and is now trading below it, which looks more like a full liquidity sweep than a real trend shift. I’m expecting a 50–100% relief rally before the next major move.
If key S/R flips and holds, we could see another memecoin cycle, with 1,000–1,500% upside back on the table.
Support / Accumulation: $0.00000280 / $0.00000136
Resistance / Targets: $0.00000914 → $0.00001380 → $0.00002443 → $0.00004494
Watch my levels closely before entering any trades.
NFA & DYOR
Biggest Altseason 10x-20x Loading for 2026?If You're Panicking Right Now, You're About To Miss The Easiest 5x-20x Of Your Life
The Total Market Cap (excluding BTC & ETH) just painted a picture we've seen before...
HISTORICAL CONTEXT:
Last bull run → 1200% pump after breakout & retest
Current situation → Long-term trendline support broken
This looks like a classic liquidity sweep before the next major leg up.
KEY LEVELS TO WATCH:
🔴 Strong Support: $750B - $600B
🟡 Strong Resistance: $1.1T
🟢 2026 Target: $4.25T
THE MATH:
If we hit that Target, we're looking at a 5x on total alt market cap
Individual Altcoins could Easily do:
Quality projects: 5x-10x
High potential gems: 10x-20x
Moonshots: Beyond 20x
MY TAKE:
This current "Crash" is NOT the beginning of a Bear Market. It's a shakeout. Big money is accumulating while retail panics.
The setup is almost identical to previous cycles:
✅ Panic selling at support
✅ Fear at maximum levels
✅ Long-term holders getting shaken out
This is exactly when you want to be positioning for the REAL altseason ahead.
RISK MANAGEMENT:
DCA at support zones ($750B-$600B)
Don't go all-in at once
Keep some powder dry for further dips
Focus on fundamentally strong projects
The biggest gains come to those who stay calm when others panic.
Are you ready for what's coming? 🚀
Not financial advice. DYOR. Manage your risk.

Adani Ports & Special Economic Zone LtdCurrent price shown: ₹1,450.50, up ₹7.40 (+0.51%).
The chart displays a strong uptrend from late August onward.
A rising trendline (blue, upward-sloping) supports the price from the lows of September through November.
Price has recently pulled back slightly but is still near the upper resistance zone.
Major resistance zone highlighted: around ₹1,515–₹1,530.
Support level marked near ₹1,467–₹1,480 (shaded lower red area).
The price is currently trading close to resistance.
Volume bars at the bottom show moderate trading activity, with occasional spikes.
No abnormal volume at the latest price area.

Essential Guide to Support and Resistance 1️⃣ The Importance of Support and Resistance in the Highly Volatile Crypto Market
- The cryptocurrency market operates 24/7/365 and shows significantly higher volatility than traditional financial markets. This volatility creates exceptional profit opportunities but also triggers intense fear and greed, placing substantial psychological pressure on traders.
- Support and resistance act as critical reference points within this chaos, highlighting areas where price is likely to react. Beyond technical analysis, they reflect the collective psychology of traders. Understanding them is essential for long-term success in crypto trading.
2️⃣ The Nature of Support and Resistance and Their Psychological Foundation
Support and resistance form where buying and selling pressures clash strongly enough to slow down or halt price movement.
Support:
At this level, buyers perceive the asset as “cheap enough” and are willing to enter, forming a psychological and structural barrier against further decline. Traders previously stuck in losing positions may sell at breakeven, adding layered reactions around these levels.
Resistance:
At this level, sellers believe the asset is “expensive enough” and reduce exposure, while trapped traders near the top may sell with a “better late than never” mentality, limiting further upward movement.
※ The Meaning of Breakouts and Fakeouts
- When support breaks, active buyers may panic and trigger stop-loss selling. Conversely, breaking resistance often invites aggressive buyers, accelerating the trend.
- However, many breakouts turn into fakeouts, designed to exploit trader psychology. Avoid jumping in too early without confirmation.
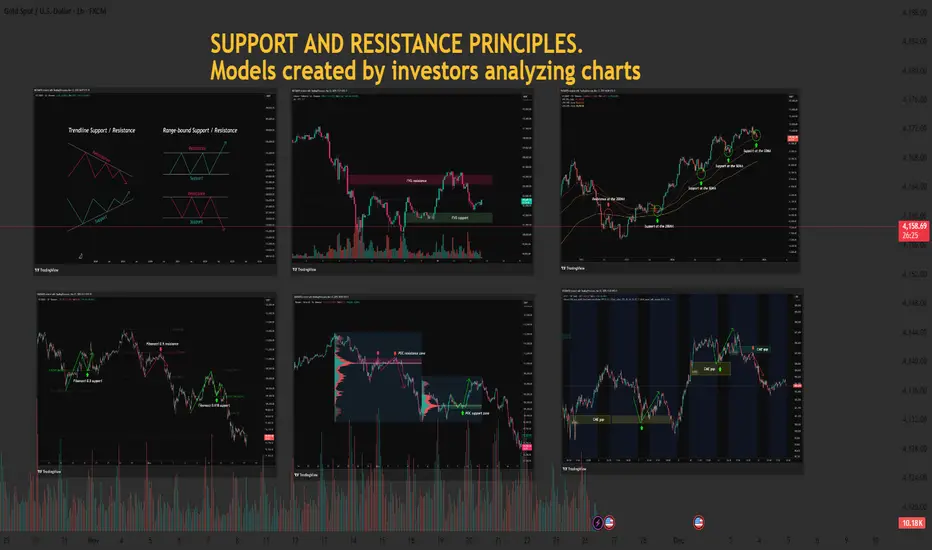
3️⃣ Key Support and Resistance Models Explained
📈 Trendlines & Accumulation Zones: Market Structure and Trader Expectations
- Trendlines visually represent collective expectations of future price direction.
- Touching an uptrend line triggers “buy the dip” psychology.
- Touching a downtrend line reinforces the belief that price “cannot move higher.”
- Accumulation Boxes mark areas where buying and selling pressures stabilize. Traders plan around these zones, driven by the mindset of “waiting for the breakout” to catch meaningful moves.
drive.google.com
📈 FVG (Fair Value Gap): Market Inefficiency & Smart Money Footprints
An FVG forms when price moves too quickly through a zone, leaving an unfilled “price gap.” These gaps often represent sudden activity from Smart Money (institutions, whales).
Gap Filling:
Markets naturally avoid leaving inefficiencies unresolved. When price returns to an FVG, the entities responsible for the original move may adjust or reopen positions, creating support or resistance.
Newer traders can observe FVGs as footprints of Smart Money and plan reactions accordingly.
drive.google.com
📈 Moving Averages (MA): Collective Sentiment & Trend Direction
MAs reflect the average price the market perceives over time. Because MAs are widely monitored, they naturally form psychological support and resistance.
Short-term MA (e.g., 50MA): Tracks short-term sentiment.
Price below → worry about trend weakening.
Price above → renewed optimism.
Long-term MA (e.g., 200MA): Represents long-term sentiment.
Price below 200MA → fear of prolonged downtrend.
Price above 200MA → hope for sustained bullishness.
When acting as support/resistance, MAs reflect strong collective agreement.
drive.google.com
📈 POC (Point of Control) – Volume Profile: Market Consensus & Volume Strength
POC is the price level with the highest trading volume within a given range — the market’s strongest consensus level.
Price below POC:
POC becomes strong resistance.
Buyers stuck in losing positions may sell at breakeven, strengthening resistance.
Price above POC:
POC turns into solid support.
Buyers believe price should not fall below this level.
POC often reflects the market’s “expected value” and the area where loss-aversion psychology is strongest.
drive.google.com
📈 Fibonacci: Natural Order & Human Expectations
- Fibonacci retracement applies golden ratio mathematics to charts, reflecting where traders expect reversals and forming support/resistance.
- These levels work not by magic but because many traders plan trades around them — collective behavior creates real reactions.
- Levels like 0.5 and 0.618 carry psychological significance, often seen as optimal buying or selling opportunities.
drive.google.com
📈 CME Gap: Institutional Movement & Mean Reversion Behavior
CME gaps occur in Bitcoin futures due to institutional trading hours. When spot price moves over the weekend while futures are closed, gaps form.
Gap Filling:
These gaps represent time periods without institutional activity, encouraging the market to “normalize” abnormal price areas.
Traders commonly expect gaps to be filled eventually, turning them into potential support/resistance zones.
drive.google.com
4️⃣ Managing Trading Psychology Through Support and Resistance
Even the best tools are useless without psychological discipline.
Confirmation Bias & Stop-Loss Discipline
- Ignoring losses due to selective perception leads to failure.
- When support breaks, accept the invalidation and exit decisively.
Overbought/Oversold Psychology & FOMO
- Avoid chasing price upward out of fear of missing out.
- In crashes, resist panic-selling at the bottom.
- Rely on your structured support/resistance rules.
Scaling Into Trades
- Avoid buying everything at one support level—or selling everything at one resistance level.
- Scaling entries across multiple levels increases psychological stability and reduces the impact of misjudgment.
5️⃣ Building a Complete Strategy & Practical Application Tips
Confluence Creates Strongest Levels
When multiple support/resistance signals overlap
(e.g., Fibonacci 0.618 + 200MA + POC + FVG),
these zones become significantly stronger because they reflect collective trader agreement.
Volume Confirms Support/Resistance Strength
High volume validates a level's importance.
A reliable breakout requires strong volume, showing clear market participation and intent.
Develop Your Own Trading Plan
Do not follow every model blindly.
Choose indicators and methods that fit your style, and create clear trading rules.
Discipline with your own system leads to psychological stability and long-term success.
Don’t forget to like and share your thoughts in the comments! ❤️
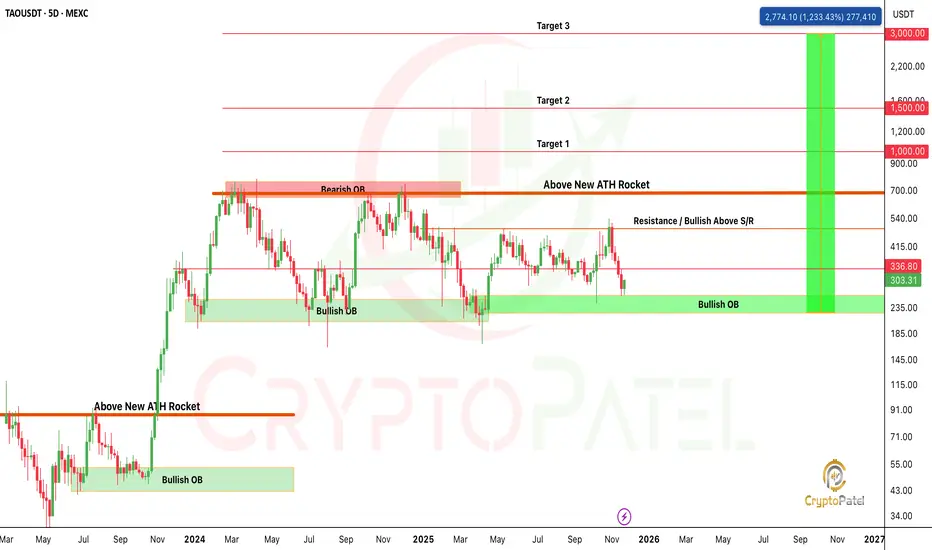
$TAO HTF SMC: Who’s Ready for the $1,000+ Expansion?GETTEX:TAO HTF SMC: Who’s Ready for the $1,000+ Expansion?
Price continues to respect the HTF Bullish Order Block (OB) at $235–$185, which remains the primary demand zone maintaining bullish order flow. Each mitigation of this OB has previously generated strong displacement to the upside, confirming active institutional interest.
The current range is defined by:
🔹 HTF Demand (Bullish OB): $235–$185
🔹 Mid-Range S/R: $540
🔹 HTF Supply (Bearish OB): $640–$700
A decisive close above $540 S/R will shift the internal structure bullish and validate a premium re-pricing phase targeting the HTF Supply at $640–$700.
A clean break of structure (BOS) above $700, combined with a displacement candle, will confirm HTF trend continuation and open up extended liquidity targets:
Target 1: $1,000
Target 2: $1,500
Target 3: $3,000
As long as price maintains the $235 Bullish OB, the HTF narrative remains bullish, with expectation of a sweep of upper-side liquidity and expansion toward unmitigated supply zones.
NFA & DYOR
UPDATE: $HYPE/USDT SHORT PLAYED TO PERFECTIONUPDATE: $HYPE/USDT SHORT PLAYED TO PERFECTION
Perfect short entry nailed at $50, after the clean retest, price flushed to $29, now stabilizing near $32.
That’s 38% down from our entry.
📉 5x Short = ~190% Profit
📉 Spot Position = 38% Gain
Both sides winning exactly as planned.
If you’re satisfied with the massive profit, feel free to secure and book here.
I’m still eyeing the $23–$19 zone for the full high-risk/high-reward target but safer traders already have their bag made.
We literally rode it from $50 → $29 in real time. 🔥
NFA & DYOR

Bitcoin Ready to hit New Low?BITCOIN QUICK UPDATE: LEVELS PLAYING OUT EXACTLY AS EXPECTED
As we mentioned earlier, the $88,600 FVG has now been fully filled, and CRYPTOCAP:BTC is currently trading below that zone.
Here’s what matters next:
🔹 If $85,000 holds as support → BTC likely pushes toward the next major Bearish Order Block at ~$93,000.
High probability this zone gets tapped.
🔹 If BTC fails to reclaim and break above $88,000 → expect a deeper leg down toward ~$75,000.
Stay sharp. NFA.

BTCUSD Liquidity Sweep Setup Before Bearish ContinuationBTCUSD Liquidity Sweep Setup Before Bearish Continuation
Overview
BTCUSD continues to display persistent downside pressure across the mid-term structure. Price action on the 3H timeframe shows a sequence of lower highs and lower lows, reflecting sustained bearish control. Despite short periods of stabilization, the overall market environment remains distribution-driven.
Market Structure
Recent price behavior confirms multiple break-of-structure (BOS) events, each reinforcing the broader downward momentum. Every attempt at upward expansion has been met with supply absorption, indicating that buyers are failing to regain initiative. The consolidation developing in the current region suggests an accumulation of short-term liquidity, but without structural evidence of reversal.
Supply & Liquidity Context
Price is positioned directly beneath a key supply zone highlighted on the chart. This zone remains unmitigated and acts as the primary area where counter-trend reactions are likely to be absorbed. The tightening range beneath this level indicates liquidity buildup, commonly preceding engineered sweeps by institutional players.
The current model suggests that the market may execute a short-term liquidity run above local highs before resuming its downward trajectory. Such a move would align with previous behavior in this trend cycle, where short-term rallies were primarily used to deliver liquidity into higher-timeframe supply.
Downside Expansion Risk
Should the market complete a liquidity sweep into the supply zone, the next phase of downside continuation becomes probable. The structural projection on the chart anticipates a revisiting of the lower demand region around 74,300 – 75,000, an area aligning with previous inefficiencies and untested demand.
This target supports the continuation of the broader bearish structure unless a significant shift in order flow emerges.
Summary
BTCUSD remains positioned within a well-defined bearish cycle, characterized by repeated structure breaks and unmitigated supply zones controlling price. Current compression suggests the market is preparing for another liquidity-driven move. Unless buyers regain structure above the key supply region, the market retains a high probability of extending toward lower demand zones.

BITCOIN JUST DID EXACTLY WHAT WE DISCUSSED: CURRENT UPDATEBITCOIN JUST DID EXACTLY WHAT WE DISCUSSED: CURRENT UPDATE
CRYPTOCAP:BTC bounced perfectly from the 0.786 Fib ($83,308), The FINAL bullish support.
Now trading above $86,500, already +5–6% up from the exact level I alerted.
As long as BTC holds $83,308, upside relief rally remains active:
$88,000 (FVG)
$93,000 (Bearish OB)
$98,000 (FVG inefficiency)
But… if BTC loses $83,000, say hello to the $66,000 demand zone, The next real bullish orderflow.
For now: Structure is bullish above 0.786, cautious below it.
(NFA / DYOR)

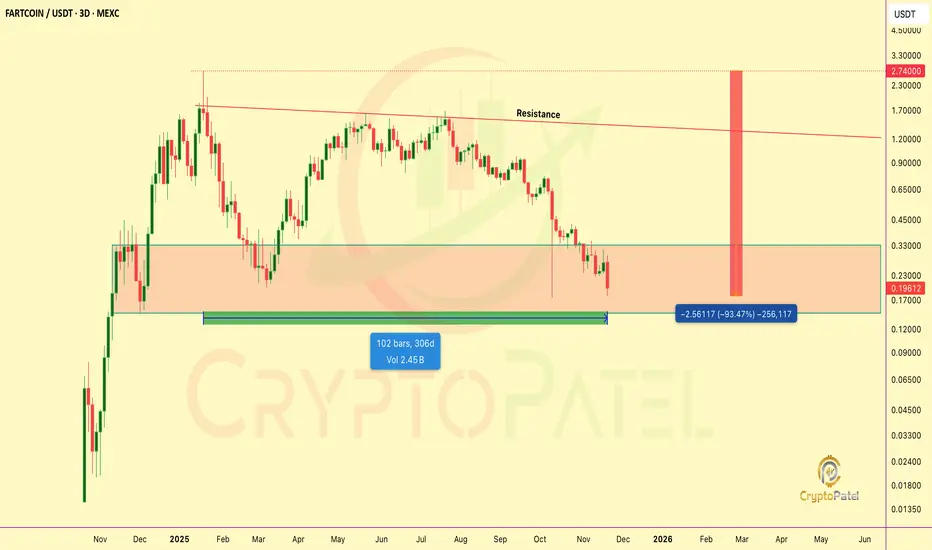
FARTCOIN COLLAPSES BELOW $200M: END OF AN ERA?FARTCOIN COLLAPSES BELOW $200M: END OF AN ERA?
Fartcoin has officially plunged 94% from its January ATH, now trading around $0.18.
On-chain data (Arkham) shows Wintermute slashing its holdings from nearly 3% of supply → just 0.24%, triggering fears of a major market-maker exit.
Rumors point to an expiring dev loan driving aggressive sell-offs and mixed sentiment:
🔻 Bears: calling for $0.10
🔼 Bulls: eyeing an unlikely but possible $1-$2 rebound
Despite the wreckage, perp volumes remain high and funding flipped deeply negative, often a setup for short-term relief bounces in memecoins.
Volatile conditions ahead. Stay sharp.
NFA & DYOR
BITCOIN WEEKLY RSI SIGNAL JUST REPEATED – BIG MOVE LOADING? BITCOIN WEEKLY RSI SIGNAL JUST REPEATED – BIG MOVE LOADING?
This chart shows something MAJOR:
Across the last 5 market cycles, Bitcoin only touched this RSI demand zone at the bottom right before massive reversals:
1️⃣ 2015 bottom
2️⃣ 2018 capitulation
3️⃣ 2020 COVID crash
4️⃣ 2022 bear-market low
5️⃣ NOW: 2025 RSI touch again
Each time BTC hit this level → it triggered one of the strongest trend reversals of the cycle.
And now we’ve hit it again while price is consolidating inside the green accumulation zone.
Historically, this has been the highest-probability long-term opportunity zone in every cycle.
If history rhymes, the next big move might be closer than people think.
Stay sharp. NFA.

STOP SCROLLING: BITCOIN TECHNICAL ALERT (3-Year Support Break)🚨 STOP SCROLLING: BITCOIN TECHNICAL ALERT (3-Year Support Break) 🚨
Bitcoin has broken a long-term support channel that’s been respected since 2022. That multi-year channel support was around $108,000 and I warned there to protect capital and trade safe.
Result: Breakdown.
✅ BTC dumped over -25%
✅ Now trading near $83,000
Structure Still Bearish
Trend remains bearish unless BTC reclaims the broken channel.
A Relief bounce is still possible toward: $93,000 / $98,000
But treat that as corrective unless structure flips.
Major Support: $69,000 is a critical level, Last bull-run ATH and strong demand zone. Watch it closely.
If This Channel Break Plays Out Fully…
As a Technical Analyst, I can’t sugar-coat the math.
When a multi-year channel breaks, the natural downside targets usually align with major Fibonacci retracement zones:
Deep Retracement Targets (Bear Case)
0.5 Fib: $44,193 (~60% probability)
0.618 Fib: $34,500 (~30% probability)
0.718 Fib: $24,250 (~10% probability)
These aren’t fantasies. They’re standard TA outcomes after this type of structural failure.
Important: This Is Not Panic
I’m not here to spread fear.
I’m here to state what the chart is objectively signaling.
Markets don’t move on hope, They move on structure, liquidity, and trend mechanics.
If price goes into that 0.5–0.718 Fib zone, it would be painful short-term…
but also a once-in-cycle accumulation window for long-term holders.
CryptoPatel Note:
Believe me, I want BTC at $1M+ in the future.
But wanting isn’t analysis.
My job is to map both paths: bullish and bearish, Before they happen.
Save this post. Mark the levels. Trade safe.
Because when a 3-year support breaks, the market doesn’t whisper, it screams.
NFA & DYOR
$BTC STANDING ON ITS LAST SUPPORT: READ THIS BEFORE YOUR TRADEBITCOIN TECH UPDATE — FRESH LEVELS, FRESH PAIN
CRYPTOCAP:BTC just dumped to $80,641, making a new low since 12 April 2025.
That’s almost -30% from my Short + Exit levels.
Those who Rode the Short, Enjoy the profits.
Those who avoided chasing above $120k, capital saved again.
Where We Stand Now
Bitcoin is sitting exactly on the 0.786 Fib ($83,300), the strongest bullish support left on the chart.
This level = Bulls’ last hope.
If daily candle doesn’t close below $83,300, then expect a relief rally into upside inefficiencies:
Upside Targets (If 0.786 Holds)
$88,600 → major unfilled FVG
$93,000 → bearish Order Block (high probability fill)
$98,000 → another upside FVG waiting to be delivered
Watch how price behaves at these levels — next macro move will be decided there.
If 0.786 Fib Breaks…
Be ready.
Next liquidity pools: $73,000 / $66,000
Both zones have massive bullish orderflow waiting.
If 0.786 support holds → BTC still has high probability to push for a new ATH.
Summary:
Trend still bearish, but BTC is now at a critical support.
Hold → relief rallies + possibly new ATH.
Break → $73k–$66k incoming.
Stay sharp. Watch the levels. Trade with intention.
NFA &" DYOR
