Simple reasons for and against a Bitcoin push in near futureThere are so many people coming out with so many idaes about why Bitcoin should reach for New ATH's in March and, to some degree, it is possible though I am not to sure it would be a good idea now. Something will happen in March though, I am sure ogf that, just not to sure what.
For me, I like to keep things fairly simple. It has worked for me for many years.
So, Lets be simple about this and Look at some basic things
First of All, The Dreaded Hack yesterday that took the market into shock - Many ALTS Bled and are Still in shock.
Bitcoin took it in its stride and fell by -4.7% - It was Less than many a normal days pull back ! And today, we are Green. This shows MASSIVE under laying strength. The Support Structure of Bitcoin is Huge.
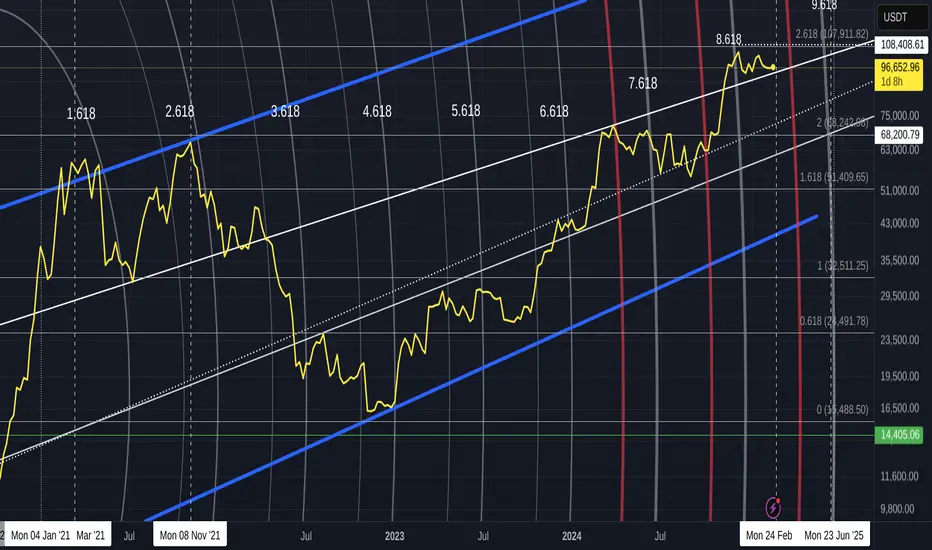
So, the the chart.
Reasons for a Push higher.
The Strength PA has, as just mentioned, is an obvious example of a simple reason to expect a push higher.The Daily MACD is Way down low, pretty well oversold and just ranging there, waiting....
But one thing I want to point out is the trend line that PA is running up. This is the trend line, with origins back 2017, that catapulted PA to the final 2021 ATH. It is strong support, that eventualy broke as the bear market cracked its whip, in 2022. But not before it support PA on two more occasions.
So, Can it do it again ?
PA does not need to react till we begin getting close to that Apex of the triangle we are now in, Which is in JUNE, But with the daily MACD Low and MACRO acceptance of Bitcoin and Trumps push to welcome Crypto, things may advance Quicker. PA certainly has the ability to move higher in the near future
The down side of that is simply, PA would run out of "steam"
Which brings me to why we may not see a push till JUNE and even then, that may just be the initial stage of the final push to cycle ATH. ( which I have said many times previously, is likely to be in Q4, maybe Early Q4 )
Look at this WEEKLY MACD chart
See where that projected line comes down to the Neutral zone...The date of intersection..JUNE
The last time weekly MACD was up here, as you can see, It fell in a very controlled manner and the angle of descent is the same as this projected line.
That happened while BTC PA Ranged across for 6 months
So, there it is, Nice and simple.
JUNE is the best time, or just before, for PA t make a move but it may try some Dances in the time till then
It can continue Ranging across in the Price range of 109K to 91K till then, Still making people money and keeping the world happy.
We can dive Deeper into all kinds of data, onchain etc, get all techie and confound people with new words...but end of the day, Bitcoin will still do the same thing as it always does.
MACD trading is a Latent method, as MACD shows you data after the event.....but it shows Trends.VERY WELL
My money is on the trend Range we are currently in, ending in around End of May to June.
This will lead to a series of New ATH's over 109K, all the way up to Cycle ATH in Q4
What happens than, That is going to be interesting to see.......but thats another story
Stay safe
Btccycletop
Bitcoin near Cycle Top ? Or is it really different this time ?I am a man that likes to look at Both sides of a Story, even more so when it involves trading with with large or small amounts of money
And I am even more carious with Bitcoin this Cycle.
The Adoption of Corporations that can Buy and amass large amounts of Bitcoin is Highly likely to change how Bitcoin works. So many "Experts" deny this.
And the proof that this is or not happening, is simply by looking at the Price Action, past and present.
That is what I do almost everyday since 2015 and charting it here on TV for the last 6 years.
And I have found THIS last night.
And I have to show you and explain this.
** The Figures in the Logarithmic chart below are approximate and yet near enough to accurately reflect the idea I am about to present.
This chart is Bitcoin PA since The LOW of November 2009
From that Low to cycle ATH is A and the same principle is applied to the following Cycle Low to ATH.
The Data shown is the % difference between a cycle Low to Cycle High as compared to the previous cycle.
For example. Cycle B was 95.8% smaller than Cycle A
As we can easily see, as BTC increases in price, it becomes harder to make PA move higher. More money is required and so that "ATH point" Arc becomes Flatter each cycle.
As a result, the Negative % difference is reduced each time.
And we are near that ball park now in 2025 at - 73.2%
The average of the previous 3 cycles is - 84.7 % - the first was an exceptional year and so if we remove that, we have an average of - 79,1 %
But I am looking at the simple fact that we went from - 80.1 % to - 78.2 % in 2 cycles, that are in a channel that PA has been in ever since 2014 ATH. ( I have explained this channel in other posts )
That is a - 2.1 % change and so if we apply that to the previous -78.2 %, we may expect a final figure of - 76.1 %
This still Gives PA some room to move before a final ATH - POSSIBLY
Some are Expecting a 200K figure for this cycle ATH.
If that happens, it would destroy this pattern and be a -40% difference to the previous cycle.
What is VERY important to understand here is that, if we do make it over 120K, it does begin to make things Different.
And the higher we go, the Bigger that difference to the Pattern we all now accept as the default 4 year cycle.
So, in conclusion, there is a very real possibility that we have reached cycle Top, or very near, in 3 years.
We did this in 2021 with a March ATH but we all now know, we went to November 2021 before the final ATH was reached, sticking to the 4 cycle and Keeping that % Different model explained above.
If that happens again, we will not see another ATH till later in 2025 and even then, it will not be a lot greater than the last, repeating what happened in 2021.
BUT - we do not know the impact of Corporate usage yet.
Should this drive us over and beyond the 120K Mark,Things Will be different and then, referring to the past could be prone to error.
THAT would be True Price discovery.
This is all numerical FACT as can be seen on the chart
My personnel opinion is that we do have more to come this cycle but maybe not till later in the year. It depends on market sentiment and that is likely to be Cool if the USA FED refuses to lower interest rates further this year,
The First FED meeting of the year is 28 29 Jan
We may be near a "Classic" cycle Top, and we may well be on the edge of creating a New Cycle pattern
We may not.
Only Time will tell and YOU need to make plans for Either reality
Trade Safe, be cautious and LOVE LIFE

BTCUSDT 165-185k topBTC Cycle top prediction . Expecting a top around marked regions somewhere around march - april 2022
