Chart Nobody Is Watching: BTC.D Could Trigger Biggest AltseasonThe Chart Nobody Is Watching: BTC.D Could Trigger The Biggest Altseason
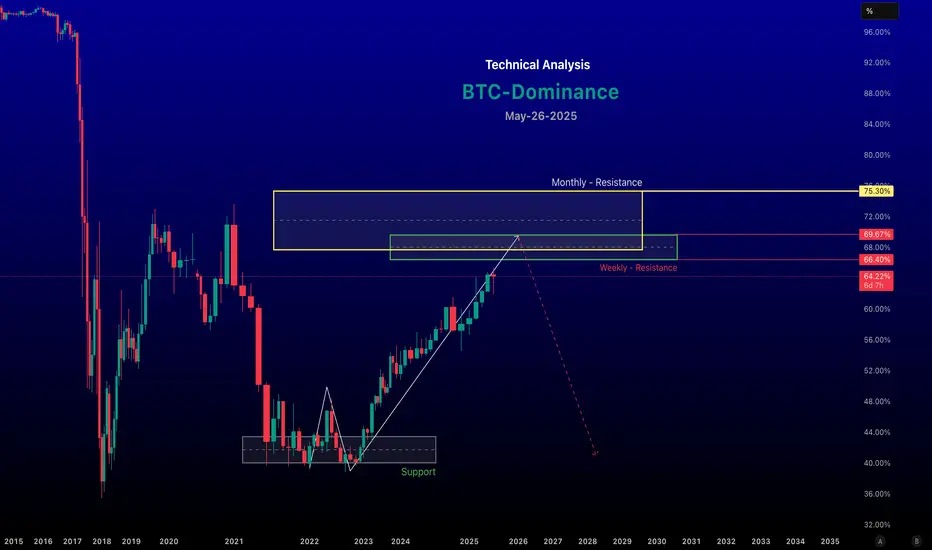
Bitcoin Dominance (BTC.D) is currently trading at a major HTF distribution zone after printing a cycle high near 66%. Price faced a strong rejection from a Bearish Order Block + Fair Value Gap, confirming supply presence and bearish structural shift.
Technical Structure (HTF):
Cycle high formed at 66% (HTF supply zone)
Clear rejection from Bearish OB + FVG
Support trendline broken
Bearish retest completed near 60%
Structure remains bearish below 60–62%
BTC.D Downside Projection:
50–48% (first expansion zone)
44% (major HTF support)
40% (historical altseason peak zone)
A sustained move toward the 44–40% region has historically aligned with aggressive capital rotation from Bitcoin into altcoins, often marking the beginning of major altcoin expansion phases.
Invalidation: HTF close above 66%
This analysis is based purely on market structure and HTF supply/demand dynamics.
Just my personal view. Not financial or investment advice. Always do your own research.
Btcdom

BTC Dominance (BTC.D) – Macro Structure BreakdownBTC Dominance Is Respecting A Multi-Year Symmetrical Triangle Structure That Has Been In Play Since 2017. Price Recently Tagged The Upper Resistance / Altcoins Accumulation Zone Around 64–66%, Where Strong Supply Entered The Market.
🔴 Technical Confluence:
Price Tapped A Bearish Order Block Near 65–66%
Resistance Retest Completed → Failure To Reclaim
Market Structure Turning Bearish Below 64%
Fair Value Gap (FVG) Formed At Resistance Acting As Supply
Momentum Weakness With Acceptance Below Prior Support
Downside Projection:
If This Breakdown Confirms, BTC.D Could Expand Lower Toward The Macro Support Trendline / Altcoins Take-Profit Zone Around 38–40%, Representing A Potential −25% To −36% Move Into Late 2026–2027.
Market Implication:
Bitcoin Dominance Decreasing = Big Altseason Rally Loading
Capital Rotation From BTC Into Altcoins Historically Aligns With This Phase.
Key Level To Watch:
Sustained Acceptance Below 58% Confirms Bearish Continuation.
❌ Invalidation:
Strong Reclaim And Acceptance Above 64–66% Resistance.
Bias: Bearish BTC Dominance → Bullish Altcoins

BTC Dominance Crashes Below EMA50: Altseason Countdown StartedBTC Dominance Crashes Below EMA50: Altseason Countdown Officially Started.
Bitcoin Dominance is set to close another weekly candle below the EMA50, confirming the trend shift we’ve been tracking since April–May 2025. The rejection happened exactly at the same technical point highlighted months ago and once again, BTC.D has broken its support trendline and failed the bearish retest.
This structure is:
Weekly close below EMA50 → structural weakness
Bearish retest rejection → continuation signal
Trendline breakdown → momentum shift away from BTC
If Bitcoin simply stops dumping, the setup for alts becomes explosive. The liquidity rotation is already visible under the surface and historically, this is where altcoins begin their strongest multi-month expansions.
I’ll repeat what I’ve been saying:
A massive Altseason is around the corner.
Based on the technical roadmap, Bitcoin Dominance sliding into the 48%–40% zone would mark the final leg of a full-scale altcoin cycle and likely our ideal exit region for major alt positions.
Stay ready. The next 12 months could be the biggest window for altcoin outperformance in years.
NFA & DYOR

Bitcoin Dominance 1D Chart - Major Altcoins Rally Depends On Thi- BTC.D is currently trading at 64.36% and is trying to flip a bearish bias by making a Lower High
- Instead of asking everyone the same question when will we see an Altcoin Run/Rally the answer to all your questions is here
- You will only see an Altcoin run when you see BTC.D crashing and BTC either staying stable or pumping hard
- BTC D depicts the flow and rotation of money in BTC when compared to other Cryptos
- Once money starts revolving out of BTC it usually flows into major alts and other Alts
- Easy explanation: Once Bitcoin D and USDT D flips majorly bearish you will see a major rally in alts as shown in the Bearish Path if not you will see a huge dump in Alts if BTC D jumps to 72%

Bitcoin Dominance (BTC.D) about to hit the given levelBitcoin Dominance (BTC.D) measures Bitcoin’s market capitalisation as a percentage of the total cryptocurrency market cap. It’s a key metric for understanding market sentiment, reflecting whether investors favor Bitcoin (BTC) over alt coins or vice versa. Technical analysis of BTC.D involves studying its chart patterns, indicators, and levels to gauge potential market trends, such as Bitcoin strength or alt coin season.
Chart for your reference
-- Disclaimer --
This analysis is based on recent technical data and market sentiment from web sources and X posts. It is for informational purposes only and not financial advice. Trading involves high risks, and past performance does not guarantee future results. Always conduct your own research or consult a SEBI-registered advisor before trading.
Bitcoin Dominance Chart Setup Bitcoin Dominance is very useful in helping us understand where the money is flowing
: BTC Dom is currently trading in an uptrend move.
: BTC dom might follow the path I have created which might later result in a massive alts rally
: Btc Dom as of now shows some relief in ALTS can be seen and money after a decent Btc correction can flow back to BTC
: Closely monitor this and USDT dominance or even DXY works
: Nas, DJI, SPX, and gold have been outperforming try to understand the global markets as well.
: If the FED starts to cut rates then it will be very bullish for Crypto

BTC.D is about to retest !! Alt-rally ??CRYPTOCAP:BTC.D
It seems that BTC.D is already in a downtrend towards 48%. The Dominance Dip along with sideways movement implies a significant pump for altcoins or a small 'alt-rally' before BTC makes significant movements from the $32K region.
Also, it is likely that the BTC.D may bounce back to 56% after that. This may be, because (1) BTC continues to move upwards (2) Another possibility is the breakdown towards the $20K region and alts bleed.

BTC.D Chart ideaBitcoin Is Moving Sideways. And BTC .D Decrease , So We Can See Pump In Alts
Thanks, Follow Me On Tradingview


Short BTCDOM in FuturesBTC dominance is gonna decrease and alts are gonna boom if you are willing to short btcdom then go for it
targets are given stoploss according to risk
