Btclong

As posted earlier 1:2 done As posted earlier i was sitting long in Btcusdt, 1:2 is done and i am out of the trade with 70% qunatity.
BINANCE:BTCUSDT
Like and follow for these types of trade ideas !!
And Join me with my journey so you can make yours 👍
Disclaimer: This is not financial advice. Please consult your financial advisor before making any investment decisions.

Btc buying side preparing for liquidity sweep SMC ICT appliedAs per recent structure BTC has taken support at previous order block and also 200 ema, with hammer. So seems like going for liquidity sweep of sellers.

BTC SWING PLAY LONGChart Overview and Data
• Asset: BITCOIN/TETHERUS PERPETUAL CONTRACT.
• Time Frame: The chart shows data up to "16 Oct" (likely the date the screenshot was taken). The primary candles visible span from approximately June to October of the current year, with the x-axis extending into 2026, suggesting a daily (1D) or weekly (WEEK) candlestick view, though the top-left corner indicates "1D - WEEK", which might mean the current view is Daily (1D) within a larger Weekly (WEEK) analysis context.
• Price: The current price is approximately $107,705.3, and the asset is down $3,007.6 (-2.72%) for the period shown.
• Trading Action: There are prominent SELL and BUY buttons at the top left, with current bid/ask prices of $107,691.3 (SELL) and $107,691.4 (BUY).
Technical Analysis Elements
Candlestick Pattern
• The chart uses candlesticks to represent price action over time.
• The recent price action (around August to October) shows a period of consolidation or a slight uptrend that has recently seen a significant drop, as indicated by the large red candlestick currently forming (the one far to the right).
Indicators and Lines
• Moving Averages: Several moving average lines (blue and purple, and possibly a thinner red line) are overlaid on the candlesticks, typically used to identify trend direction.
• Support and Resistance:
• Support Zones (Red Boxes/Lines): Several horizontal red lines and a large red-shaded area beneath the current price action indicate potential support levels where traders expect buying interest to emerge. Key price points marked by red lines are around $106,973, $103,204, $101,297, and the "Low" at $98,125.2. Further support is indicated by the lowest red line at $89,076.1.
• Resistance/Target Zone (Yellow/Green Box): A prominent yellow horizontal line at $126,220.2 (labeled "High") acts as a significant resistance level or a potential upside target. The large green-shaded area above the current price, extending up to $161,047.0, appears to represent a profit target or a long-term trading objective for a potential long position.
Trade Setup Indication
• The chart appears to be illustrating a potential short trade setup, or a breakdown scenario, given:
• The large red-shaded area below the current price, which could be a projected target zone for a short position.
• The significant price drop in the last candle, breaking below recent support.
• Small arrows and boxes near the consolidation area (around July/August) also suggest previous or ongoing trade indications.
Axis and Additional Information
• Y-Axis: Represents the price of BTCUSDT, ranging from approximately $84,800 up to $161,047.
• X-Axis: Represents time, spanning from approximately July to April 2026.
• Volume: A smaller chart pane at the bottom shows volume data, represented by red and green vertical bars, which helps gauge the strength behind price movements.

Btc 1H long ideaHere's a detailed description of the information presented:
• Financial Instrument: The chart is for Bitcoin (BTC) priced against USDT (Tether), a stablecoin. The "Perp Perpetual Mix Contract" suggests this is a futures or derivatives contract that doesn't expire.
• Timeframe: The chart is set to 1-hour (1H), meaning each candlestick represents one hour of price movement.
• Trading Position: A long position is currently open, indicated by the green and red boxes. A long position is a bet that the price will increase.
• Entry Point: The white horizontal line marks the entry price at 116,980.2.
• Take-Profit Target: The top of the green box, labeled "Target," is at 119,810.0. The potential profit for reaching this target is 3,517.2 USDT, which is a 3.02% gain.
• Stop-Loss: The bottom of the red box, labeled "Stop," is at 114,658.0. This is the price level where the trade will automatically close to limit losses. The potential loss is 1,646.4 USDT, or a 1.42% drop.
• Risk/Reward Ratio: The text "Risk/Reward Ratio: 2.14" indicates that the potential profit is 2.14 times greater than the potential loss. This is a key metric used by traders to evaluate if a trade is worth the risk.
• Price and Indicators:
• The current price is shown as 117,210.1.
• The chart includes various indicators and tools, such as moving averages (the blue and yellow lines moving with the price) and a volume histogram at the bottom (red and green bars).
• There are also horizontal white lines that likely represent significant support and resistance levels.
In summary, the image provides a clear visualization of a planned crypto trade, outlining the specific entry, stop-loss, and take-profit levels, as well as the associated risk/reward profile.

BTC LONG AND HAVING SUPPORT OVER THE CHANNEL Chart Overview
• Pair/Timeframe: BTC/USDT – 4H
• Exchange: Bitget
• Pattern: Breakout from a falling wedge / descending channel, shifting momentum bullish.
• Indicators:
• EMA 9 (yellow) and EMA 20 (blue) are crossing bullishly.
• Volume spike supports the breakout.
⸻
Price Action
• BTC broke out of the descending trendline (blue) and retested support before moving higher.
• Currently trading at 110,780 USDT (+1.46%).
• Strong bullish momentum is visible with higher lows forming since Aug 31.
⸻
Trade Setup
• Entry: Around breakout zone (near 110,000 – 110,500).
• Stop Loss (SL): Below 108,500 zone (highlighted red zone).
• Targets:
• TP1: 114,658 USDT
• TP2: 115,980 USDT
⸻
Key Levels
• Immediate Support: 109,383 – 108,534
• Major Support Zone: 107,200 – 107,386
• Immediate Resistance: 111,998 – 113,217
• Target Resistance: 114,658 (TP1) and 115,980 (TP2)
• High Reference: 117,340 – 117,345
⸻
✅ Summary: BTC has broken out of a falling wedge on the 4H chart with strong bullish confirmation. If price sustains above 110k, it could move toward 114.6k (TP1) and 116k (TP2). Losing 108.5k support would invalidate this bullish setup.

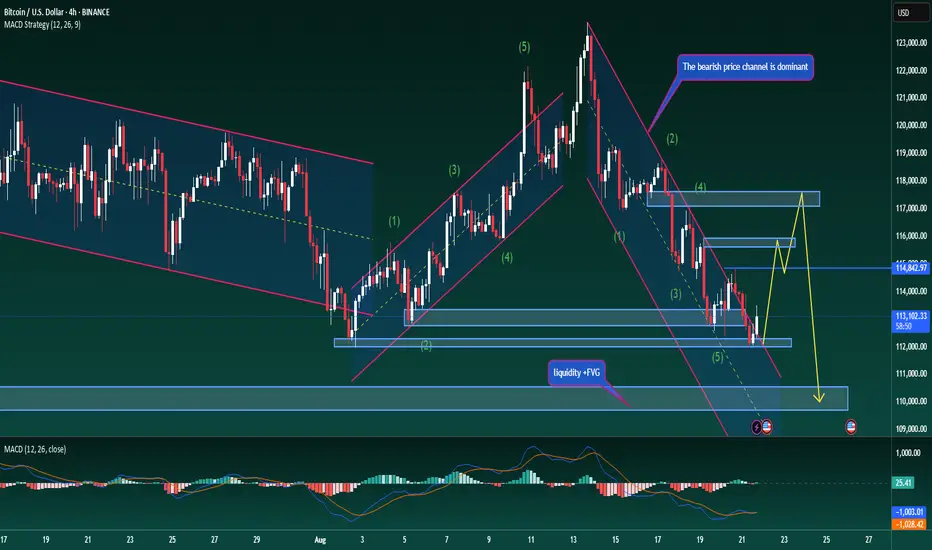
Bitcoin – Medium-Term Outlook for Long/Short TradersBitcoin – Medium-Term Outlook for Long/Short Traders
Hello traders,
BTC continues to move within the descending channel – something we can all clearly see. Recently, price bounced strongly after touching the solid support zone near 112k, and now it is only about 2k away from the target level for a potential swing long entry.
If BTC manages to break above the 114.8k resistance, it could signal a short-term reversal, pushing towards 117.5k before resuming the broader downtrend. This scenario could act as a potential trap for those holding long-term short positions.
We also see early signs of structure changing: the trendline has already shown signs of breaking, with price trading above the descending channel. At the same time, MACD is showing rising volume and its averages are starting to curve upward. Together, these factors support the case for a short-term corrective rally.
Strategy: Consider long entries near the current zone, with the option to DCA if price breaks above 114.8k.
Please note this is my personal view — always manage risk and follow your own plan.
What’s your take on this setup? Share your thoughts in the comments so we can discuss further.
Patience is the key of success This is a BTC/USDT (1H timeframe) chart with some key technical setups:
⸻
1. Downtrend Channel
• The price had been moving inside a falling channel (red parallel lines).
• Recently, BTC broke out of this channel to the upside, showing bullish strength.
⸻
2. Support & Resistance Levels
• Immediate Support Zone: Around 115,078 – 115,600 USDT (white horizontal lines).
• Immediate Resistance Zone: Around 118,165 – 119,810 USDT (orange & red lines).
• Major Resistance: 122,800 USDT.
• Major Support: 111,100 – 111,600 USDT.
⸻
3. Indicators
• EMAs (20/50/100/200) are plotted.
• Price recently bounced strongly from the lower support, pushing above short-term EMAs, which is often a bullish reversal signal.
⸻
4. Trade Setup (Highlighted Zone)
• The green zone = Long (buy) trade area.
• The red zone = Stop-loss zone.
• Entry is near 116,000 – 117,000.
• Target 1: Around 118,165.
• Target 2: Around 119,810.
• If momentum continues, extended target could be 122,800.
⸻
5. Volume
• Strong buying volume spike at the breakout, confirming bulls stepped in aggressively.
⸻
✅ Summary:
BTC just broke out of a falling channel with strong volume. As long as it stays above 115,000 support, bulls could push toward 118,000 – 120,000, and possibly 122,800. A breakdown below 115,000 would invalidate this setup and risk retesting 111,000 support.

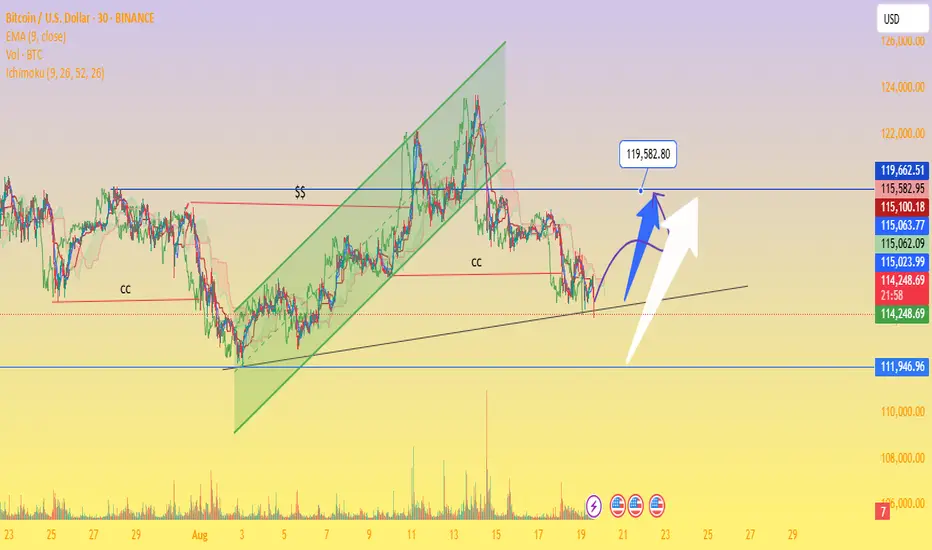
Bitcoin at a Critical Support – Breakout Toward $119K or ?Ascending Channel Breakdown – Price previously respected a rising green channel but broke below, showing weakness.
Critical Support Zone: Around $111,946 – $114,000 (black trendline + yellow support area).
Resistance Levels:
Near-term: $115,100 – $115,582
Strong: $119,582 (highlighted as major upside target)
Volume Profile: Declining volume with recent dip → signals possible accumulation before the next move.
Ichimoku Cloud: Price is slightly below cloud, indicating short-term bearish bias but with potential rebound if reclaimed.
Scenarios:
Bullish Case (Blue/White Arrows): If BTC holds above $114,000 support and breaks $115,500, a rally toward $119,500+ is possible.
Bearish Case: Failure to hold $114,000 may trigger a drop toward $111,946 (major demand zone).
BTC long planThis order I am playing in my Main account And this is safe order who wants safe side play

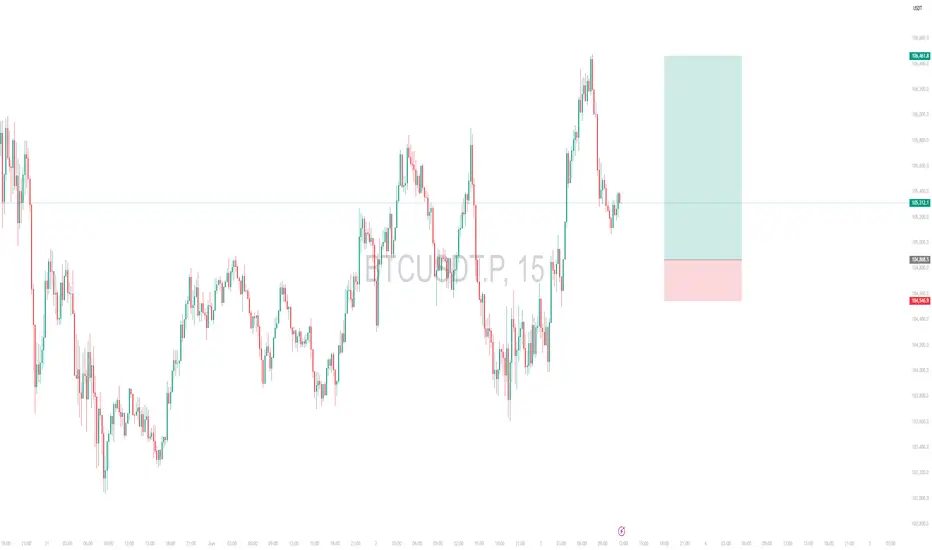
Weekly Long Setup | June 23rd 2025 | Valid Until Weekly ClosePrice is retracing to a strong pivot zone (marked by the red box).
Structure remains bullish with potential for continuation after pullback.
The green box represents a high-probability long opportunity with tight risk control.
Watch for price reaction within the red zone. Entry only if confirmation (e.g., bullish engulfing, strong wick rejections) appears.
The setup expires at end of the weekly candle close.

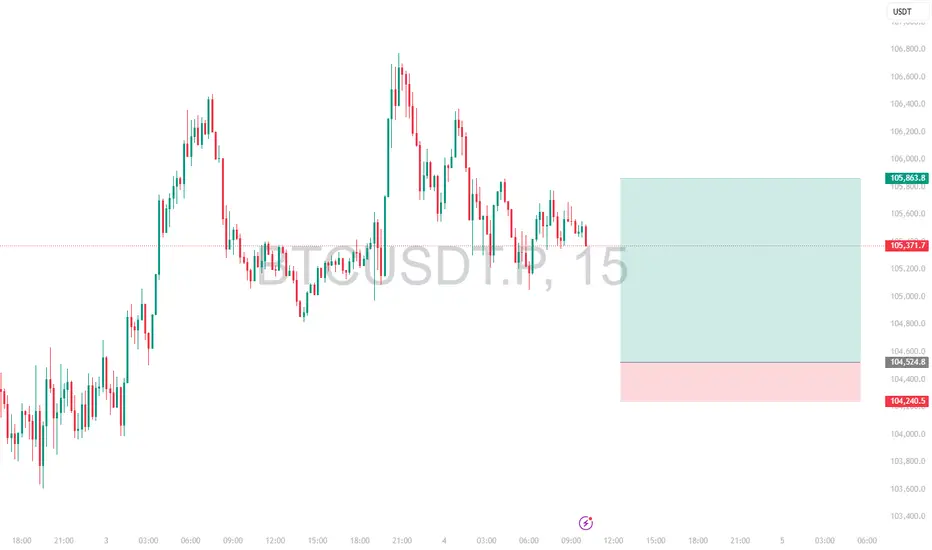
Intraday Long Setup | June 20th 2025 | Valid Until Daily ClosePrice retraced to a strong pivot zone.
Structure remains bullish with potential for continuation after pullback.
Tight risk control.
Watch for price reaction within the red zone. Entry only if confirmation appears
The setup expires at end of the daily candle close.
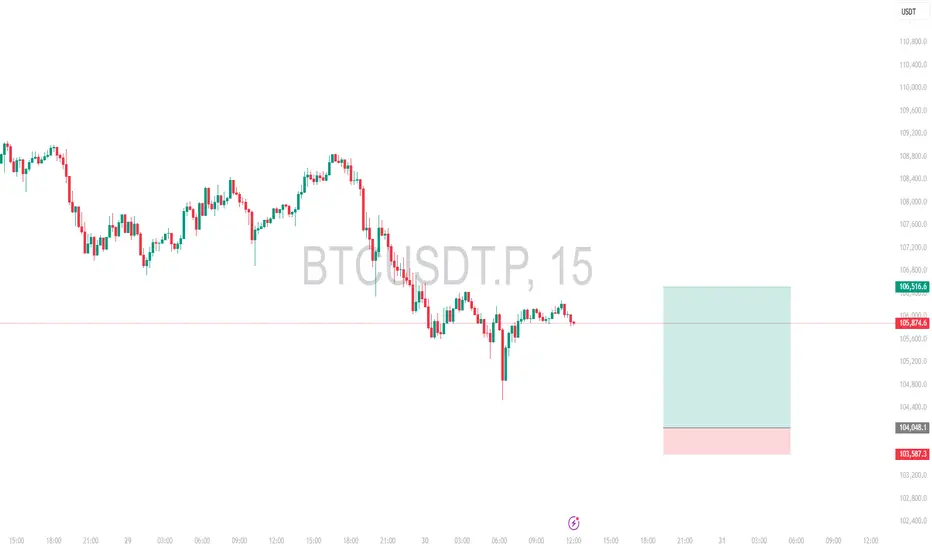
Intraday Long Setup | June 11th 2025 | Valid Until Daily ClosePrice retraced to a strong pivot zone.
Structure remains bullish with potential for continuation after pullback.
Tight risk control.
Watch for price reaction within the red zone. Entry only if confirmation appears
The setup expires at end of the daily candle close.

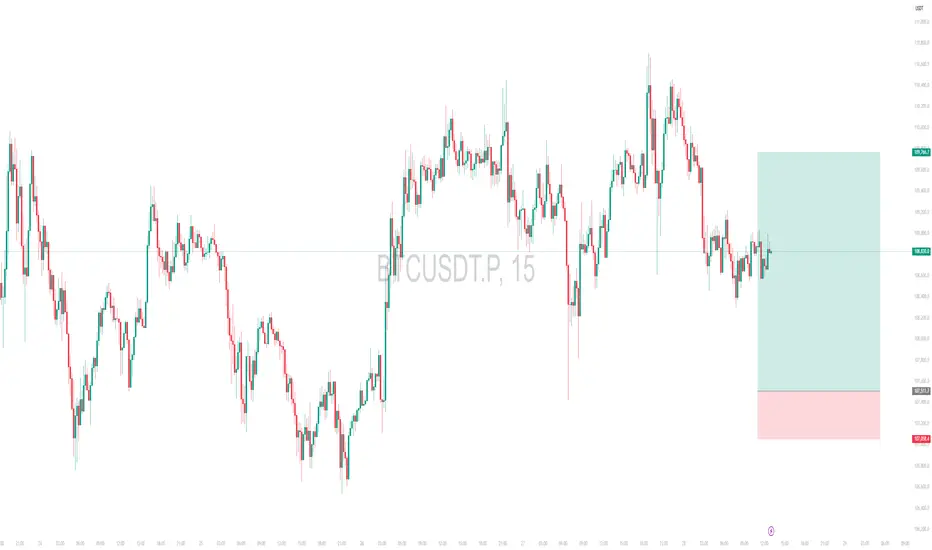
Intraday Long Setup | June 9th 2025 | Valid Until Daily ClosePrice is retracing to a strong pivot zone (marked by the red box).
Structure remains bullish with potential for continuation after pullback.
The green box represents a high-probability long opportunity with tight risk control.
Watch for price reaction within the red zone. Entry only if confirmation (e.g., bullish engulfing, strong wick rejections) appears.
The setup expires at end of the daily candle close.
Intraday Long Setup | June 8th 2025 | Valid Until Daily ClosePrice is retracing to a strong pivot zone (marked by the red box).
Structure remains bullish with potential for continuation after pullback.
The green box represents a high-probability long opportunity with tight risk control.
Watch for price reaction within the red zone. Entry only if confirmation (e.g., bullish engulfing, strong wick rejections) appears.
The setup expires at end of the daily candle close.

Intraday Long Setup | June 3rd 2025 | Valid Until Daily ClosePrice is retracing to a strong pivot zone (marked by the red box).
Structure remains bullish with potential for continuation after pullback.
The green box represents a high-probability long opportunity with tight risk control.
Watch for price reaction within the red zone. Entry only if confirmation (e.g., bullish engulfing, strong wick rejections) appears.
The setup expires at end of the daily candle close.
Intraday Long Setup | June 4th 2025 | Valid Until Daily ClosePrice is retracing to a strong pivot zone (marked by the red box).
Structure remains bullish with potential for continuation after pullback.
The green box represents a high-probability long opportunity with tight risk control.
Watch for price reaction within the red zone. Entry only if confirmation (e.g., bullish engulfing, strong wick rejections) appears.
The setup expires at end of the daily candle close.
Intraday Long Setup | May 30th 2025 | Valid Until Daily ClosePrice is retracing to a strong pivot zone (marked by the red box).
Structure remains bullish with potential for continuation after pullback.
The green box represents a high-probability long opportunity with tight risk control.
Watch for price reaction within the red zone. Entry only if confirmation (e.g., bullish engulfing, strong wick rejections) appears.
The setup expires at end of the daily candle close.
Intraday Long Setup | May 28th 2025 | Valid Until Daily ClosePrice is retracing to a strong pivot zone (marked by the red box).
Structure remains bullish with potential for continuation after pullback.
The green box represents a high-probability long opportunity with tight risk control.
Watch for price reaction within the red zone. Entry only if confirmation (e.g., bullish engulfing, strong wick rejections) appears.
The setup expires at end of the daily candle close.
BTC WILL be 129K I'm post this btc analysis coming up truth and on this chat wrote,
Main conversation is in chart,
Good luck olders and holders,
#sol
#bgb
#onus
#bnb#
#sui
#defi
#airdrop#
#testnet
#grass
#NP
#altcoin
#memecoins
#ptofitandloss
My PC software hard disk corrupted, I'm working , I'm fully on this particular incidents.
Hope 🙏 for mine
Good btc olders and holders

BTC Demand/Supply Zones In the chart above, I have marked Supply and Demand zones for swing long trades.
Strategy:
The Demand zone represents a buying opportunity, while the Supply zone indicates a potential shorting opportunity.
The stop loss can be placed at the opposite end of the order block.
Note: The order block may break on the fourth test.
Do your own research (DYOR).
This is not financial advice.

BTC will return back to 70k in upcoming 2 - 3 daysBTC is ready to flip as halving is nearing, BTC will again shock by liquidating shorts in upcoming days. Hold on spots or low Leveraged longs are expected by the traders.

VIRTUAL VERSION IS READY TO FLY As from past few months coin has been consolidated very strongly between 0.005 to 0.01 $ and gann fan has crossed 1/1 means coins is ready to fly in comming days my target of 50% spot will be sold @ 0.08 and rest upto end of the bull run
