BTC - Turned Bearish ?This unexpected longer US shutdown followed by another un expected temporary solution till Jan 2026 is causing panic in US market. These days Trump and his network moving the market as they want. And anything are possible these days by him. BTC has very strong Buyer network including ETFs, Strategy and other non stop accumulators. Its Golden time to buy Bitcoin at every dips since they have non stop flow of funds. But price drop un stoppable since margin issues cause weak hands to get liquidated. when 25X group gets liquidated then its huge sell off and it will take time to buy back the liquidity so SL kills all weak hands. But where is the Bottom. Cant predict because US shutdown has not got solution atleast for a year. Upcoming US data all expected to be slightly negative putting pressure on markets to be on sell side. Its all in the hands of Trump and his network or other banks who planned all these. I never seen a temporary solution for US shutdown in the past. At sending markets to the levels they want first big players will accumulate and then make policy move to move markets to up again.... Its sure bad news for Bitcoin Bulls planning for 130+ levels... It will come in 2026 but need to be loving and money management in SIP into Bitcoin will give rich returns in 2026
Btcshort

BTCUSDT SHORT I was sitting in Short after a good bearish candle formed at resistance with very good volume, i just took 1:2 and i was out of the trade.
Logic :- Price was too stretched and bears were gaining control, bulls were trapped
But still the trend is bullish for me, lets see 🚀
Happy profits 🥂 enjoy guys, sorry i didn’t posted this trade earlier
LIKE AND FOLLOW FOR MORE TRADE IDEAS

#APT Bearish Setup And IdeaAPT Is Also In Bearish Structure, Also Its Failing To Hold The Support, We Have A Small Reversal Area Downside, We Can See A Good Momentum In APT From Our Reversal Area, But Until Then There's No Pump (If Market Pumped, This Idea Will Be Invalidate).
Disclaimer -: This Is Not An Financial Advise, This Is An Idea, We Are Not Responsible For Any Profit And Loss You Will Made.

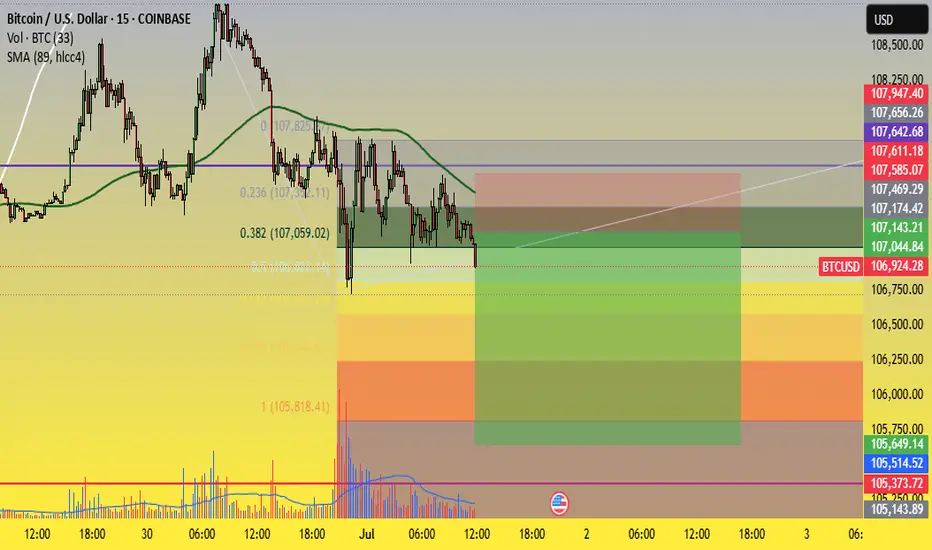
BTCUSD SELL Recommendation – 15-Minute Chart (M15)Sell on short-term downtrend continuation after a technical pullback near resistance and Fibonacci levels.
🎯 Trade Setup:
Sell Zone: 107,000 – 107,200
Stop Loss (SL): 107,650 – 107,850 (above resistance + Fib 23.6% zone)
Take Profit (TP): 105,500 – 105,700
Risk:Reward Ratio: Approx. 1:2 to 1:2.5 – suitable for short-term scalping/swing
📊 Technical Analysis:
1. Fibonacci & Resistance Confluence:
Price is reacting to the Fibonacci 0.382 level (107,059) – a common retracement level in downtrends.
The zone 107,000 – 107,200 overlaps with historical resistance and previously rejected candles → indicating distribution.
2. Moving Average (MA) Pressure:
Price is trading below the MA, and recent pullbacks failed to break above it.
The most recent bounce was rejected around 107,200, suggesting bearish pressure remains.
3. Volume Analysis:
Volume declined on the pullback, showing weak buying momentum.
Meanwhile, the recent drop came with a high-volume bearish candle → sellers are in control.
4. Target Zone – Support Area:
105,500 – 105,700 is a previous swing low and aligns with the Fibonacci 0.618 – 0.786 zone, making it a strong potential bounce area.
This is a reasonable target before the market decides its next direction.
⚠️ Risk Management Notes:
Look for bearish reversal candlestick patterns (e.g., pin bar, bearish engulfing) in the entry zone for confirmation.
If BTC closes strongly above 107,650, consider the short setup invalidated.
Fl me and trading with me! fl Ytb....
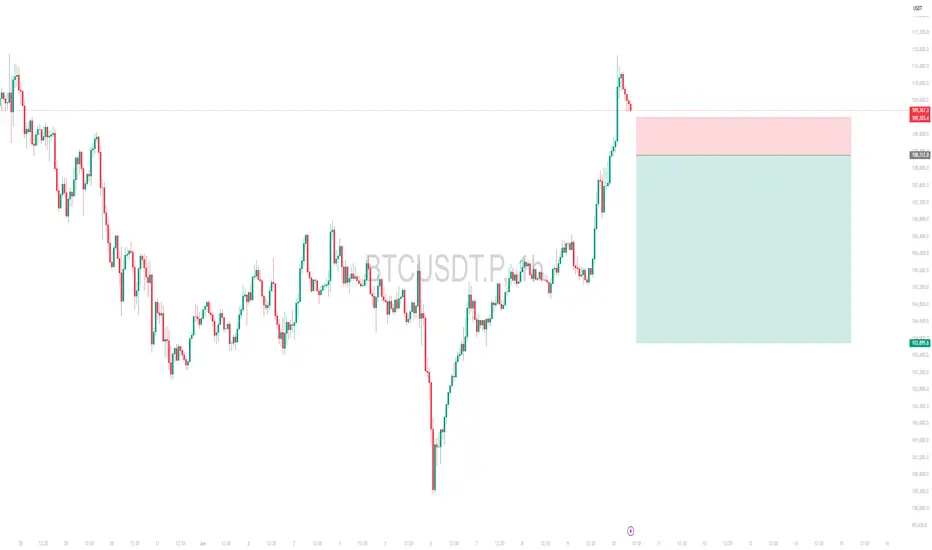
Intraday Short Setup | June 28th 2025 | Valid Until Daily ClosePrice has pushed into a potential intraday Pivot supply zone (red box) where sellers may step in. This trade is based on the expectation of a rejection from this area.
Entry: Red box — a short entry zone aligned with overhead supply
Stop Loss: Above the red zone (invalidates the setup)
Target: Green box — area to consider partial/full exit based on momentum
Risk-reward is favorable with a tight invalidation and clean downside target
Price may stall or reverse near the red box, creating short opportunity
Note:
This is an intraday trade idea that expires at 00:00 UTC (Daily Candle Close). Re-evaluate the setup if price remains indecisive near the entry zone close to that time.
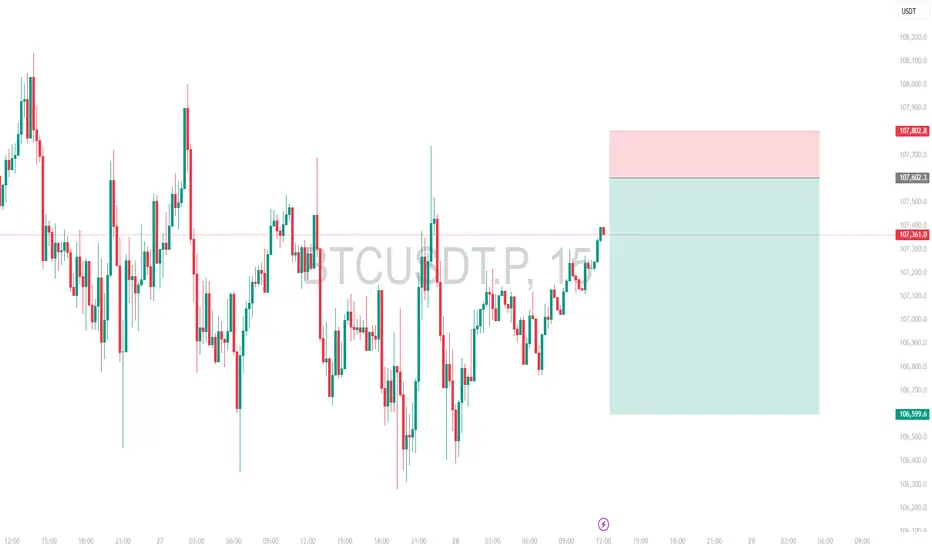
Intraday Short Setup | June 27th 2025 | Valid Until Daily ClosePrice has pushed into a potential intraday Pivot supply zone (red box) where sellers may step in. This trade is based on the expectation of a rejection from this area.
Entry: Red box — a short entry zone aligned with overhead supply
Stop Loss: Above the red zone (invalidates the setup)
Target: Green box — area to consider partial/full exit based on momentum
Risk-reward is favorable with a tight invalidation and clean downside target
Price may stall or reverse near the red box, creating short opportunity
Note:
This is an intraday trade idea that expires at 00:00 UTC (Daily Candle Close). Re-evaluate the setup if price remains indecisive near the entry zone close to that time.
Weekly Short Setup | Valid Until Weekly CloseI have been in this trade for sometime now with first TP taken. Due to uncertainty globally, I am not posting any intraday charts.
Stay safe, save capital is the motto right now.
Note:
This is an weekly setup and idea that expires at Weekly Candle Close. Re-evaluate the setup if price remains indecisive near the entry zone close to that time.
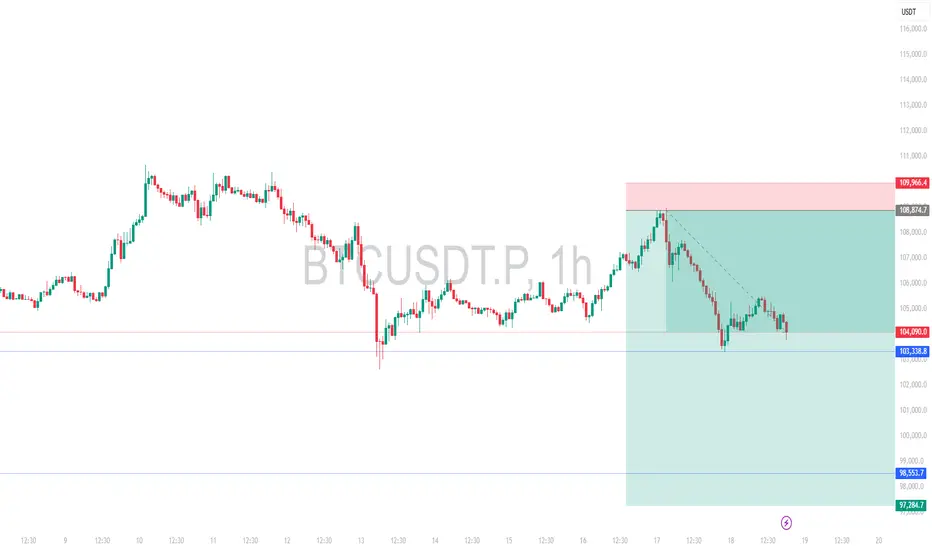
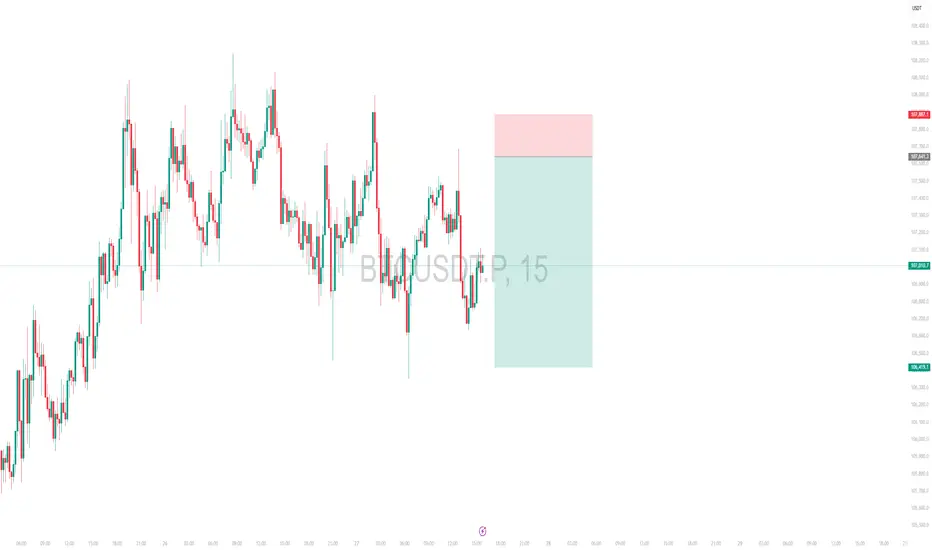
Weekly Short Setup | Valid Until Weekly ClosePrice has pushed through a potential weekly Pivot supply zone (red box) where sellers may step in. This trade is based on the expectation of a rejection from this area.
Entry: Red box — a short entry zone aligned with overhead supply
Stop Loss: Above the red zone (invalidates the setup)
Target: Green box — area to consider partial/full exit based on momentum
BTCUSDT has shown a strong bounce and has now approached a key pivotal resistance zone
Risk-reward is favorable with a tight invalidation and clean downside target
Price may stall or reverse near the red box, creating short opportunity
Note:
This is an weekly setup and idea that expires at Weekly Candle Close. Re-evaluate the setup if price remains indecisive near the entry zone close to that time.
BTCUSDT.P | Intraday Short Setup | 26th May 2025Price is pushing into a key pivot based resistance area (highlighted in red).
Looking for a clean rejection with a 1R move to secure partials, then possible continuation toward lower levels.
Managing risk tightly as structure unfolds.

BTCUSDT.P | Intraday Short Setup | 24th May 2024Price has pushed into a key resistance area (highlighted in red).
Looking for a clean rejection with a 1R move to secure partials, then possible continuation toward lower levels.
Managing risk tightly as structure unfolds.

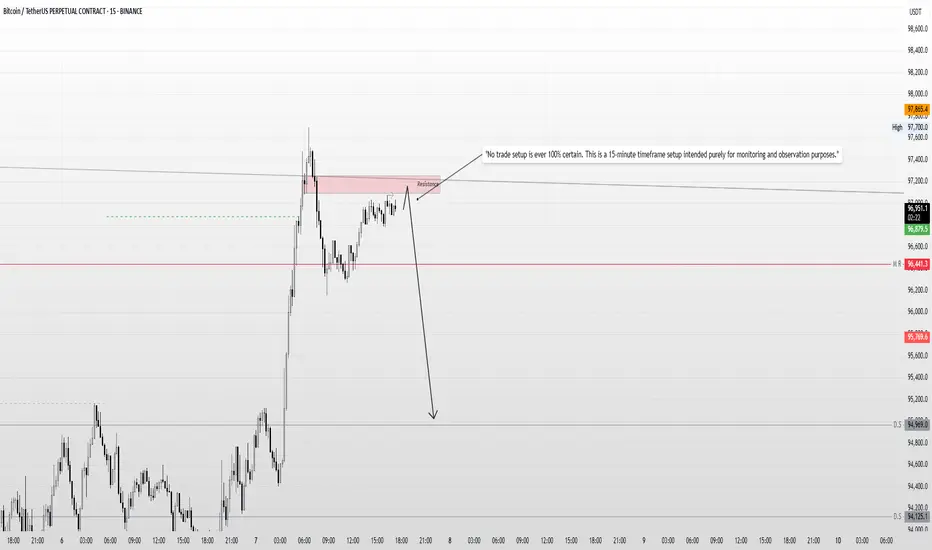
Bitcoin Intraday Bias – Liquidity Sweep & Rejection Setup"Intraday Setup: I anticipate that during the New York open, the market may sweep the liquidity around 97078, reject from the resistance zone, and potentially move lower."
"No trade setup is ever 100% certain. This is a 15-minute timeframe setup intended purely for monitoring and observation purposes."
Disclaimer: This is not financial advice. The analysis shared is for educational and informational purposes only. Please conduct your own research and consult with a licensed financial advisor before making any trading decisions. Trading involves significant risk and may not be suitable for all investors.
Trade Idea: SELL BTCUSD at 78,200 – 78,500🧠 Technical Analysis (1H Chart):
Key Resistance Zone: 78,200 – 78,500 USD
Price has consistently failed to break above this area.
Multiple rejections from this zone suggest a strong supply zone.
This area aligns with historical resistance + EMA confluence.
Trend Structure:
Price formed a lower high and shows signs of a short-term bearish reversal.
Breakdown from minor support at 77,800 confirms weak momentum.
Current price action shows hesitation with reduced buying volume.
Volume Analysis:
Large red volume bars signal strong seller presence near resistance.
Weak green candles near resistance imply exhausted buying interest.
🎯 Trade Setup:
Entry Zone: SELL from 78,200 – 78,500 USD
Stop Loss: Above 79,600 USD (just beyond strong resistance zone)
Take Profit:
TP1: 70,000 USD – major support & volume node
TP2: 68,000 USD – high probability support zone from recent base
📊 Risk-to-Reward (R:R): Approximately 1:3 to 1:4 – ideal for swing or short-term positional trades.
🚀 Follow me for more high-probability trading opportunities! 🚀

A plan SHORT for BTC
1. I saw a "Break Down cloud" - follow trend signal on the chart in Time Frame M15
2. I saw Main Trend on M15 timeframe showed that : main trend = DownTrend
3. I saw Main trend on H1 - M30 - M15 also : Downtrend
Conclusion:
Setup a SHORT plan with RR= 3 BINANCE:BTCUSDT.P
Entry Zone : From 97300 to 97900
Target : 92699
Stoploss = trailing SL with the Cloud trending system SL on M15 TF.

BTC Demand/Supply Zones In the chart above, I have marked Supply and Demand zones for swing long trades.
Strategy:
The Demand zone represents a buying opportunity, while the Supply zone indicates a potential shorting opportunity.
The stop loss can be placed at the opposite end of the order block.
Note: The order block may break on the fourth test.
Do your own research (DYOR).
This is not financial advice.

BTC $40000BTC Information
Bitcoin Could Drop 20% After Fed Rate Cuts in Bearish Case, but Weak September Presents Buying Opportunity: Analysts
Bitfinex suggested bitcoin could fall to as low as $40,000 in a bearish scenario.

BITCOIN SETUP TRADE WIH 1:5 RISK REWARDBITCOIN SETUP TRADE WIH 1:5 RISK REWARD
A good selling setup detected on BTCUSD
It's showing a BULL MOVE due to these reason
1. It's following THE 60 M trendline here
2. It's ready to break the neckline
3. In day chat it's showing the heavy bullish pressure
Just grab out will your own risk
With a small amount
Stay connected
Stay happy
Bande mataram
BITCOIN SETUP TRADE WIH 1:5 RISK REWARD
A good selling setup detected on BTCUSD
It's showing a BULL MOVE due to these reason
1. It's following THE 60 M trendline here
2. It's ready to break the neckline
3. In day chat it's showing the heavy bullish pressure
Just grab out will your own risk
With a small amount
Stay connected
Stay happy
Bande mataram

BITCOIN SETUP TRADE WIH 1:5 RISK REWARD A good selling setup BITCOIN SETUP TRADE WIH 1:5 RISK REWARD
A good selling setup detected on BTCUSD
It's showing a BULL MOVE due to these reason
1. It's following THE 60 M trendline here
2. It's ready to break the neckline
3. In day chat it's showing the heavy bullish pressure
Just grab out will your own risk
With a small amount
Stay connected
Stay happy
Bande mataram
BITCOIN SETUP TRADE WIH 1:5 RISK REWARD
A good selling setup detected on BTCUSD
It's showing a BULL MOVE due to these reason
1. It's following THE 60 M trendline here
2. It's ready to break the neckline
3. In day chat it's showing the heavy bullish pressure
Just grab out will your own risk
With a small amount
Stay connected
Stay happy
Bande mataram


BITCOIN BELOW 50K❗❗❗❗SELLWorst case scenario it will go below 50K.
As you guys already knew the geopolitical tension.
Middle East getting worsen.
Oil is about to explode up because oil supplies can't transfer properly
through ships and so asset will move to safe haven.
BITCOIN is consider risky as of now by the market.
And halving is on the way .but this time is different.
Learn to analysis by yourself.

BTC SHORT LONGI am still holding a short position, but if it closes above 70,150 , I will close the short and open a long position for 2 or 3 hours. Eventually, it will come down for sure. If you can take the risk, hold your short. The CME gap between 62,000 and 64,000 will sooner or later fill.

1 week Shooting star negative candle1 week negative long wick rejection candle form shooting star sellers activate heavily china is now trapping buyers book ur profits go short heavily dumping soon downside btc targets 28000 as soon as possible 48000 strong seller zone heavy call writing

Bitcoin Short Trade - 38-40k can be the magnet
- Stay cash let Btc retrace and then add alts
- Do not do FOMO buying, market is deleveraging late longs

BTC SHORT TO 22786So we are again looking at a QS on daily and we are completing the 4th Leg on Daily TF, the 5th leg should start from 27860/28280 zones
SL 28888
TP1 24444
TP2 22786
we will be trapped in 220-620 loop
break of 620 we go 420 the 220
bigger picture
28888->18888
slice 1 : 27860 ->24444 (Short)
Slice 2 : 24444 ->26200 (LONG)
Slice 3 : 26200->22786 (Short)
