BTCUSD 4H –Demand-to-Resistance Reversal Setup (Structured Long)Market Context
BITSTAMP:BTCUSD is currently reacting from a 4H demand zone after a sharp corrective move from the recent swing high. Price has printed a clear liquidity sweep below prior lows and is now attempting a reclaim of short-term structure.
Technical Breakdown
Strong 4H Demand (D) holding near the 88.9k–89.2k region
Clear reaction + displacement from demand, suggesting active buyers
Price is attempting to reclaim the 4H resistance flip zone (R)
EMA ribbon compression followed by early expansion → momentum shift
Structure aligns with a mean reversion → continuation move
Trade Plan (Illustrative)
Entry: On confirmation above 4H resistance / demand retest hold
Invalidation: Below demand zone low
TP1: ~93.4k (first opposing structure / imbalance fill)
TP2: ~97.7k (daily resistance / premium zone)
R:R remains favorable as long as demand holds and structure is respected
Bias
Neutral → Bullish while price holds above demand
Failure to hold demand invalidates the setup and opens downside continuation
Notes
This is a structure + supply/demand based idea, not a prediction
Best confirmation comes from lower timeframe acceptance and volume expansion
News events may increase volatility—manage risk accordingly
📌 This idea is for educational purposes only. Always manage risk and wait for confirmation.
Btctechnicalanalysis


BTC # Bitcoin Free fall still pending....Here as per critical box range trading btc bitcoin can free fall if it breaks below . And ot will try to sweep stoplosses of previous weekly low. As marked in chart you can notice this easily that how btc can free fall to hunt more stop losses.
So trade accordingly to see weather it only hunts stop losses and reverses or it will take a continuous fall.

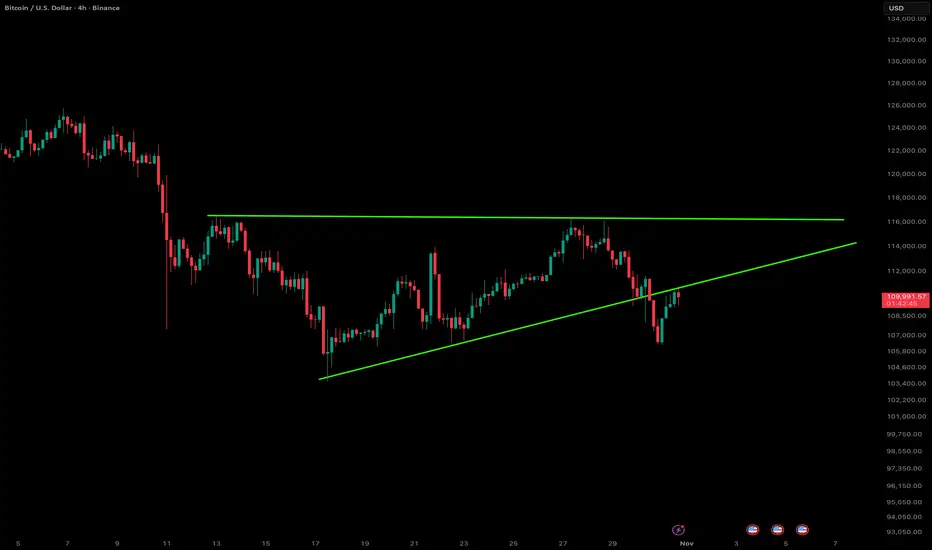
Bitcoin – Breakdown from the Ascending TriangleBitcoin just slipped below the ascending triangle support on the 4-hour chart, signaling a potential shift in short-term momentum. The structure had been forming higher lows toward the $115K resistance zone, but sellers stepped in hard near the top, breaking the trendline that’s been guiding the uptrend since mid-October.
The move comes amid broader weakness across the crypto market — BTC has shed about 3.7% this month, while altcoins like XRP and ETH are also struggling. Despite the pullback, Bitcoin still holds an impressive 18% gain for the year, so the bigger picture remains constructive.
Macro pressure seems to be weighing on sentiment — investor caution around interest rates, inflation, and the Fed’s next move is keeping volatility elevated. If upcoming data tilts toward another rate cut, we could see renewed upside momentum. But for now, price action suggests a possible retest of lower zones before bulls can re-establish control.
Overall, a clean technical breakdown in the near term, but the broader trend isn’t broken yet. Let’s see if bulls can reclaim that triangle support in the next few sessions.
DONT FORGET TO CHECK MY PROFILE BELOW 👇👇👇
BTC - Buy - Price @ Support areaBTC is testing the W support area as per SMC retest. Interest Rate cut is super bullish for BTC and markets in general

BTC/USD: Structure Shift Confirmed - Bearish CHoCH Break"The previous analysis highlighted the Minor and Major CHoCH levels as key lines in the sand for the recent uptrend. The market has now decisively broken BELOW both levels.
This action confirms a Bearish Change of Character in the market structure (on the chart), signaling a failure of the current bullish order flow.
Minor CHoCH Break : Confirmed the initial weakness and short-term pullback.
Major CHoCH Break : Confirms the structural shift, indicating that the corrective move is likely to be deeper than a simple consolidation.
We should now anticipate a shift in price action: making Lower Highs and Lower Lows . The previous support levels may now act as resistance. Looking for the next key demand zones for a potential bounce, but the immediate bias is now BEARISH ."

Bitcoin Testing Resistance with Potential Pullback AheadKey observations:
Range Breakout: Earlier, Bitcoin broke out of a consolidation zone (marked box), which triggered the recent upward move.
Resistance Zone: Price is hovering near the 5.15%–5.42% gain zone, where selling pressure has historically emerged.
Pullback Signal: The drawn arrow suggests a possible rejection at this resistance, pointing to a corrective move down toward the 3% zone.
Momentum Check: If BTC fails to hold above this resistance, a retracement is likely. However, a strong breakout could open the door toward 6% gains.
📌 Conclusion:
Bitcoin is at a decision point. Rejection at resistance could bring a pullback toward 2.8%–3.0%, while a breakout above 5.4% would continue the bullish momentum.
BTC - LONGBitcoin has broken above the 200 EMA, confirming bullish bias.Price is supported by the 10 & 20 EMA crossover (short-term bullish trend). As long as BTC holds above $115,000, upside targets are $117,600 and then $120,000. If it loses $115,000, caution — the bullish setup may fail.

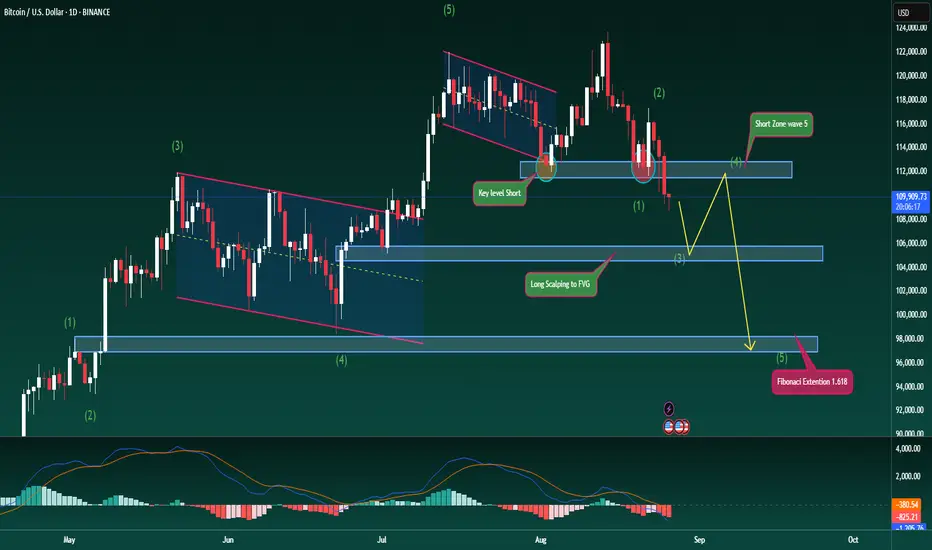
Bitcoin Trend Reversal – Elliott Wave in PlayBitcoin Trend Reversal – Elliott Wave in Play
Hello traders,
Today we look at a fresh scenario for BTC as price has broken decisively below a major support zone, showing clear short-side strength. This could mark the beginning of a medium-term downtrend, signalling a shift in market structure.
The 112k level has been fully taken out after two strong rejections earlier, and now the market looks ready to seek lower levels, potentially targeting 97k–98k based on Fibonacci Extension.
From an Elliott Wave perspective, BTC is currently in wave 3 of the down cycle, and has not yet reached the reaction point for wave 4. I expect the 105k zone to act as support for this leg down. From there, price could bounce into wave 4 before completing wave 5 lower towards 97k, or even 95k. This would provide a solid area to plan medium-term long entries afterwards.
The MACD also supports the bearish view, with both volume and moving averages trending below, signalling strong downside momentum.
I’ve marked the key price levels on the chart for clarity. Please use this scenario as reference and manage risk carefully with your trades.
What’s your outlook for BTC here? Share your thoughts in the comments so we can discuss together.
BTC - will bounce and move up only from today low - 26th AugBTC price has reached a crucial technical area from where price will most likely bounce and move up only and wont fall further much. explained in chart with fib levels and what happened in history
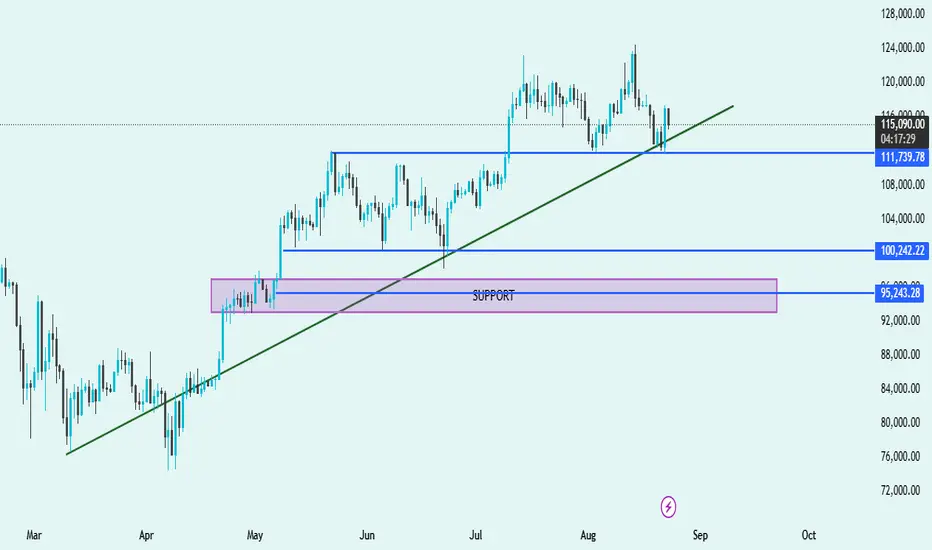
BTC/USDT Technical Analysis – Key Levels & Trend Outlook📊 BTC/USDT Technical Analysis – Key Levels & Trend Outlook 🚀📉
🔹 Trend Structure
Price is currently trading above the trendline, suggesting bulls are still in control, but momentum has weakened.
🔹 Support Zones
Immediate Support: 🔵 $111,739
Price recently tested this level and bounced, showing demand from buyers.
Key Mid-Support: 🔵 $100,242
Strong historical level where buyers stepped in multiple times.
Major Demand Zone: 🟪 $95,243 – $96,500
Highlighted purple support box; this is a critical accumulation zone where bulls are likely to defend strongly.
🔹 Resistance Levels
Near-term resistance: Around $120,000 – $124,000 (recent swing highs).
A breakout above this zone could fuel a new bullish rally.
🔹 Market Outlook
✅ Bullish Bias as long as price respects the green trendline and stays above $111,739.
⚠️ If the price breaks below $111,739 and the trendline, expect a deeper pullback toward $100,242 or even the major demand zone $95,243.
🚀 A breakout above $120K will signal strong continuation to new highs.
📌 Summary:
Trend: Uptrend ✅
Key Supports: $111,739 → $100,242 → $95,243
Resistance: $120,000 – $124,000
Bias: Bullish above $111K, cautious below 🔻
BTC - 14th Aug - Buy re enter level - Buy below 121 for TP -131In my previous charts i clearly commented to Book Profit.
No Price has done correction 2nd wave all most done and
is expected to take key support at support & resistance
inter change zone marked in green in chart. This area is strong support zone forming a
strong W formation and rectangle of support given breakout on
up side. I strongly expect price to take support from here and move up side mostly.
Keep buying the dips with money management.
This view is given before US Jobs data expected in less than 1 hr from now
As pointed out earlier given CPI data failed to create any impact.
In my view this Jobs data too is not important for Bitcoin but few people
listen to others and do buy or sell ... Market makers need to pull BTC from others.
Buy BTC below 121 in small qty and green area at 121300 is strong level to accumulate.
Up move could be in sub waves which we will know based on price action.
We got Buy levels for now. Price went to new ATH due to so many big whales massive
buying and they are holding ... only the weak hands keep seeing US data and other news sell.
All corrective trend have lesser volume compared to main trend.
US Dollar Index and Dollar - Fiat money will keep crashing and Bitcoin going to Moon - 150 or 180 after 131 K

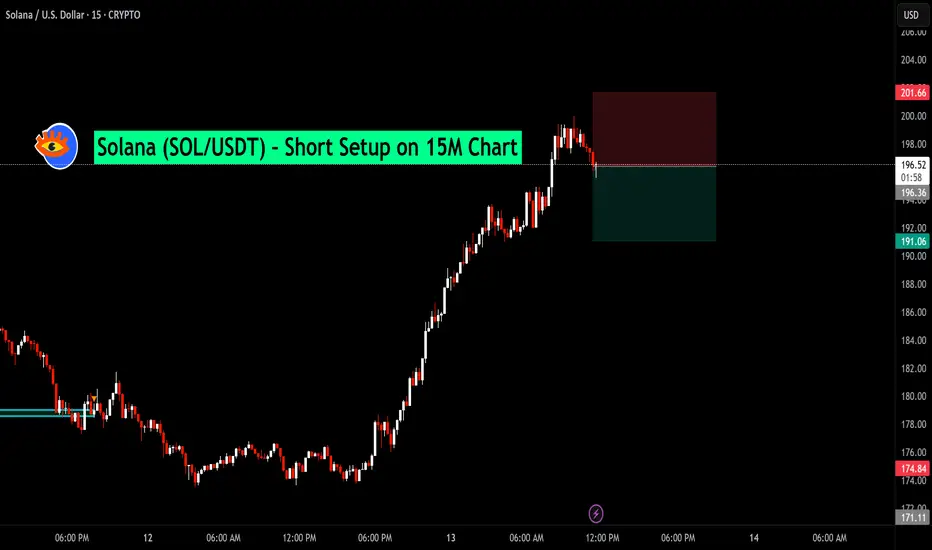
Solana (SOL/USDT) – Short Setup on 15M ChartAfter an extended bullish run, Solana is showing early signs of exhaustion near the $196–$197 zone. Price has failed to sustain above recent highs, forming a potential short-term reversal pattern.
📉 Trade Idea:
Entry: $196.40
Stop Loss: $201.66 (Above recent swing high)
Target: $191.06 (Support zone from prior consolidation)
This setup aims to capture a pullback move following a strong rally, with a favorable risk-to-reward ratio.
Bitcoin Bounce & Breakout PlayChart Analysis:
🔹 Support Holding Strong:
BTC is respecting a key support area (~$105,600), which previously acted as resistance (marked by recent ATH).
🔹 EMA 70 (Blue Line):
Price is hovering above the EMA, adding bullish confirmation.
🔹 Bullish Projection Path:
The chart shows a projected bullish move toward the sell zone near $113,200 – $113,300, representing a potential 4.4% gain from the breakout.
🔹 Key Zones:
Support Zone: $105,600
Supply Zone: $100,500
Sell Zone (TP Zone): $113,200+
📌 Outlook:
If BTC breaks and holds above the resistance (~$107,000), a strong upward rally could follow.
Entry near support or on breakout, with tight risk management, offers a favorable risk/reward.
✅ Entry Options:
Breakout Entry:
Trigger: Break and close above $107,200
Confirmation: Retest and hold above the breakout zone
Entry: $107,300 – $107,500
Support Bounce Entry:
Trigger: Pullback to support zone (~$105,600) with bullish reversal candle
Entry: $105,600 – $105,800
🎯 Target Zones (TP):
TP1: $110,400 (minor resistance)
TP2: $113,200 – $113,300 (major sell zone)
TP3 (aggressive): $114,000+
🔻 Stop Loss (SL):
For breakout entry: SL below $106,200
For bounce entry: SL below $105,200 or $104,800 (structure break)
📈 Risk–Reward Ratio:
Approx. 1:2.5 to 1:3+ depending on entry and target
🧠 Trade Management:
Move SL to breakeven after hitting TP1
Partial profit booking at TP1
Trail remaining with manual or dynamic SL (e.g., below EMA or recent low)
⚠️ Risk Notes:
Avoid chasing price without breakout confirmation
Watch for fakeouts and heavy selling near TP zones
Adjust position size based on your risk tolerance

Bitcoin (BTC/USDT) 2-hour chart, focused on the buy side only!📊 Chart Overview
The chart shows BTC/USDT on the 2-hour timeframe, featuring clear levels of resistance, mini-resistance, and target zones. Let’s break down the buy idea:
🚀 Key Zones & Levels
💜 Resistance Zone (Purple Box):
Historical price ceiling.
Price dropped from this area several times.
🟦 Target Zone (Blue Line):
106,691 - 106,683 USDT.
Target for the next bullish move!
🟧 Mini Resistance (Yellow Box):
Around 102,000 USDT.
Acting as support (buy zone!) now.
💰 Buy Setup & Entry Area
✅ Buy Zone:
Just below 103,000 USDT, aligning with the mini resistance / support box (yellow).
✅ Entry Level:
Between 102,000 - 103,000 USDT.
Best if price consolidates or forms a reversal candle here.
🟢 Target:
First target: 106,000 USDT
Next major target: 106,683 - 106,691 USDT.
📉 Stop Loss:
Below 101,000 USDT for protection.
🎯 Trading Plan
1️⃣ Wait for a bullish reversal candlestick at the mini resistance box (~102,000 - 103,000 USDT).
2️⃣ Enter long (buy) position.
3️⃣ Target profit at 106,000 and 106,691 USDT.
4️⃣ Stop below 101,000 to manage risk.
⚡️ Summary
🟢 Buy: At mini resistance (~102,000 - 103,000).
🎯 Targets: 106,000 - 106,691.
❌ Stop: 101,000.
🚀 Let's ride the bullish wave! 💹📈🟢

BTC/USD Technical OutlookTechnical Analysis Summary:
1. Support & Resistance Zones:
Support Zone: ~$102,600–$103,500
✅ Price recently tested and bounced from this zone, supported by the 200 EMA (blue line).
Resistance Zone: ~$110,500–$112,000
🔼 This is the next major target area for bulls.
Mid-level Supply: ~$106,500–$107,500
⚠️ Price may face short-term resistance here (near the 50 EMA in red).
🔄 Moving Averages:
200 EMA (blue) at $102,648: Acts as strong dynamic support. Price bounce reinforces bullish sentiment.
50 EMA (red) at $106,798: Currently acting as dynamic resistance. A breakout above it would strengthen bullish continuation.
🕯️ Candlestick Behavior:
Multiple rejection wicks from the support zone indicate buyer strength.
Recent candle shows a bullish reaction, potentially forming a reversal pattern.
📈 Price Projection (as per the chart path):
Short-term pullback may lead into the $106,500–$107,500 zone.
If bulls maintain momentum and break above, we can expect a push toward $111K–$112K resistance.
✅ Conclusion:
Bias: Bullish
Trigger: Confirmed bounce from support + price reclaiming 50 EMA
Invalidation: Break below $102,600 with high volume would invalidate the bullish scenario.

Bitcoin Price Analysis – 1H Chart (BINANCE)📊 Bitcoin Price Analysis – 1H Chart (BINANCE)
Date: May 28, 2025
Pair: BTC/USDT
Timeframe: 1 Hour (1H)
🏔 All-Time High (ATH) Rejection
🔴 Zone: ~111,800 – 112,000 USDT
BTC previously reached an ATH (marked in red) but failed to maintain momentum.
This level formed a double top pattern, a classic reversal signal.
📉 Key Resistance Zone
🟪 Range: ~109,500 – 110,500 USDT
Multiple rejections from this purple box indicate strong seller presence.
This area is now acting as a resistance barrier, preventing upward movement.
🔵 Support & Target Level
📍 Support Level: 106,622.06 USDT
🗨️ “when touch this level next target 100k”
The blue line represents a crucial short-term support.
The chart suggests a bearish move toward this level before a possible bullish reversal.
If price breaks below this, we could see further downside before any major rally.
🔄 Market Structure
🔹 BTC has formed a lower high structure, indicating weakening bullish momentum.
🔻 A head-and-shoulders pattern appears to be forming, which typically signals a reversal from bullish to bearish.
🧠 Trader Insight
📌 A drop to 106,622 USDT may act as a liquidity grab, potentially setting the stage for a major move upward.
⚠️ However, confirmation of a reversal (bullish signals, volume spike) will be critical before assuming a breakout to 100k as implied.
🔍 Conclusion
🚨 BTC is in a critical zone between resistance (~110,000) and support (~106,600).
📉 Near-term bias: Bearish → Targeting 106,622 USDT
📈 Medium-term possibility: Bullish rally only if support holds and sentiment shifts.

BTCUSDT Price Analysis – Potential Drop Incoming! 🔲 Chart Zones
🟥 Resistance Zone (~111,000–112,000):
Price has touched this zone multiple times and failed to break higher – this is a strong resistance area. 🚫📈
🟪 Support Zone (~101,000–102,000):
A historically strong demand area where price previously bounced up. 💪📉
🔍 Current Price Behavior
📊 Price Level: Around 108,666.66
🔄 The chart shows lower highs forming, indicating weakening bullish momentum.
📉 Bearish projection drawn (blue zigzag line) suggests a potential double top forming below resistance.
📉 What’s Expected?
🔵 Big Drop Alert! ⬇️
If the price fails to break above and gets rejected again, the chart predicts a sharp move down toward the support zone.
🎯 Target Area: ~101,000–102,000 (Support zone)
📌 Summary
🧱 Resistance holding strong
💤 Momentum slowing down
⚠️ Bearish move likely
🏹 Targeting support zone for potential bounce
⚠️ Trading Tip 🧠
Watch for confirmation before entering trades! A break below the recent lows could trigger a short opportunity, while a bounce near support could offer a buy setup. 🛑📈

BTC/USD Rebound in Play! | Key Support Holding, Eyes on $112K 📊 BTC/USD Technical Analysis
🗓️ Chart Date: May 25, 2025
🔍 Key Levels:
🔵 Support Zone: $106,800 – $107,300
Notably, price bounced twice in this region, indicating strong buying interest.
This area aligns closely with the 200 EMA (currently at $107,213.51), adding further confluence as dynamic support.
🔴 Resistance Zone: $111,800 – $112,300
Previous highs and consolidation make this a significant area where sellers may re-enter the market.
📈 Indicators:
🔵 EMA 200 (Blue): $107,213.51
Acts as a strong dynamic support; price bounced off it recently.
🔴 EMA 50 (Red): $108,182.91
Price is currently below the 50 EMA, suggesting short-term bearish pressure remains until this level is reclaimed.
🧠 Market Structure & Price Action:
After a sharp drop from the resistance zone, price found solid footing at the support zone.
Recent candles show rejection wicks from the downside, hinting at potential bullish reversal.
A breakout above minor consolidation and 50 EMA could trigger a bullish continuation toward the resistance.
📌 Forecast:
✅ If the price holds above the support zone and breaks above $108,200, we can expect a bullish move toward $112,000.
⚠️ However, a failure to break above the 50 EMA could lead to a retest of the support zone.
🧭 Trade Idea (Not Financial Advice):
📥 Long Bias:
Entry: On confirmed breakout above $108,200
SL: Below $107,000
TP: $111,800 – $112,300
📌 Conclusion:
The chart setup suggests a potential bullish reversal 📈 from a key support zone, supported by EMA 200. Watch for a break above the 50 EMA for momentum confirmation.
🧠 Always confirm with volume and wait for confirmation before entering a position.

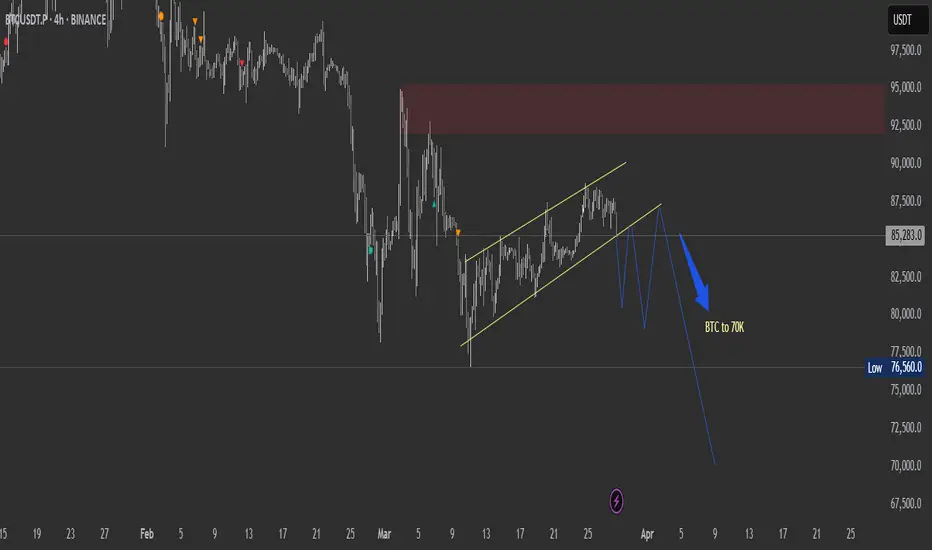
BTC to touch 70K if it breaksdown from this zoneTechnical analysis on the 4-hour chart suggests forming a bearish flag pattern—a continuation pattern that typically indicates a pause before the prevailing downtrend resumes.
If the current bearish flag pattern breaks down, Bitcoin's price could potentially decline to around $70,000. Such projections are based on technical analyses that consider factors like weak support levels and historical price movements.
BTC AT CRITICAL LEVEL – BREAKOUT OR PULLBACK?🚀 BTC/USD – KEY BREAKOUT LEVELS AHEAD!
📌 Market Overview
Bitcoin (BTC/USD) is currently trading around $84,593, rebounding strongly from support. The price is approaching a major resistance zone at $87,049 - $89,748, where a crucial reaction is expected.
Overall sentiment remains influenced by market psychology, institutional activity, and macroeconomic factors. BTC is still trading within a descending wedge pattern, signaling that the corrective phase is not over unless a breakout occurs.
📈 Technical Analysis – Key Levels to Watch
🔹 Major Resistance Levels:
🔺 $87,049 - $89,748: A strong supply zone; a breakout here could trigger a bullish move toward $92,000+.
🔺 $90,005 - $92,000: The next target if BTC successfully clears resistance.
🔻 Major Support Levels:
🔹 $82,000 - $80,000: A short-term support zone where buyers might step in.
🔹 $78,935 - $78,000: A critical support area—losing this level could lead to a sharp sell-off.
📌 Key Observations:
If BTC fails to break $87,000, a retracement toward $80,000 - $78,000 is likely.
A confirmed breakout above $87,000 - $89,000 could signal further upside momentum toward $92,000 or higher.
🌍 Fundamental Analysis – What’s Driving BTC?
🔥 1. Institutional Demand & Market Sentiment
Market sentiment remains positive, but BTC needs stronger institutional buying to sustain further gains.
On-chain data indicates whales are accumulating BTC at lower price ranges, but resistance remains strong at $87,000.
Bitcoin ETFs are seeing steady inflows, providing fundamental support for long-term bullish momentum.
📊 2. Macroeconomic Factors & USD Impact
The DXY (US Dollar Index) is weakening, which is generally bullish for BTC.
The Federal Reserve’s monetary policy remains a key factor—interest rates are expected to stay high until mid-2025, which could slow BTC’s momentum.
Recent CPI and PPI data indicate persistent inflation concerns in the US, boosting demand for BTC as a hedge.
💰 3. Whale Activity & Institutional Moves
On-chain data reveals significant BTC withdrawals from exchanges, signaling long-term accumulation.
If large buyers continue accumulating, BTC could push above $90,000.
However, if whales take profits near resistance, BTC may retrace toward $80,000 - $78,000 before another move higher.
⚡ Trading Scenarios
✅ Scenario 1: Bullish Breakout Above $87,000
If BTC closes above $87,000 with strong volume, expect a rally toward $90,000 - $92,000.
A further push could target $95,000 if bullish momentum sustains.
❌ Scenario 2: Rejection at $87,000 - $89,000
If BTC faces resistance, expect a pullback toward $82,000 - $80,000.
A deeper correction could test $78,000, where strong support lies.
📢 Conclusion – Watch for a Critical Breakout!
📌 BTC is testing a major resistance zone ($87,000 - $89,000)—a breakout could fuel further upside.
📌 Market sentiment remains positive, but a rejection could trigger a pullback toward $80,000 - $78,000.
📌 Monitor Fed policies, institutional activity, and on-chain trends for better trade positioning.
📌 Traders should wait for confirmation before committing to a breakout or short position.
💬 Do you think BTC will break above $87,000, or is a deeper pullback coming? Share your views below! 🚀🔥

Bitcoin 1D Commentary and Bull Run Technical Analysis - Bitcoin is currently trading at 99,779$
- Bitcoin kept behaving choppy and the Price Behaviour was very sluggish in January
- We saw BTC printing a candle 4000$, which helped BTC cross 100,000$ after a long time.
- Coming back to the current Price Action of BTC we are currently trading at a crucial zone and if we flip a weekly candle close above 102,686$ then the Market structure will change to Bullish
- However, if we do not close above 102,000$ then we can see BTC revisiting 85,000-90,000$
- Trump's inaugural is due next week and will bring in a lot of volatility.
- I am leaning more on the Bullish side, however, if we don't see supporting Macros then we might have a rough time chopping out and getting distributed the whole month.
