Bitcoin (BTC/USD) Price Analysis: Bearish Breakdown Ahead?🔥 Bitcoin (BTC/USD) 1-Hour Chart Analysis 🔥
🔹 Trend Analysis:
🟡 Price was moving in an ascending channel 📈 but has broken below the trendline.
🟠 A retest of the broken trendline is happening, suggesting a potential drop 📉.
🔹 Trade Setup:
🔽 Short Entry: Expected rejection from the trendline.
❌ Stop Loss: $85,671 - $85,710 (Above resistance).
✅ Take Profit Target: $81,386 - $81,347 (Bearish target 🎯).
🔹 Indicators & Confirmation:
📊 EMA (9) at $84,254 → Acting as resistance 🚧.
🔄 Break & Retest Pattern → Typical for a bearish continuation 🛑📉.
🔹 Conclusion:
⚠️ Bearish Bias: If the price rejects the trendline, it could drop towards $81,386 🎯.
🚨 Invalidation: If the price breaks above $85,710, the short setup is canceled ❌.
Btctrade

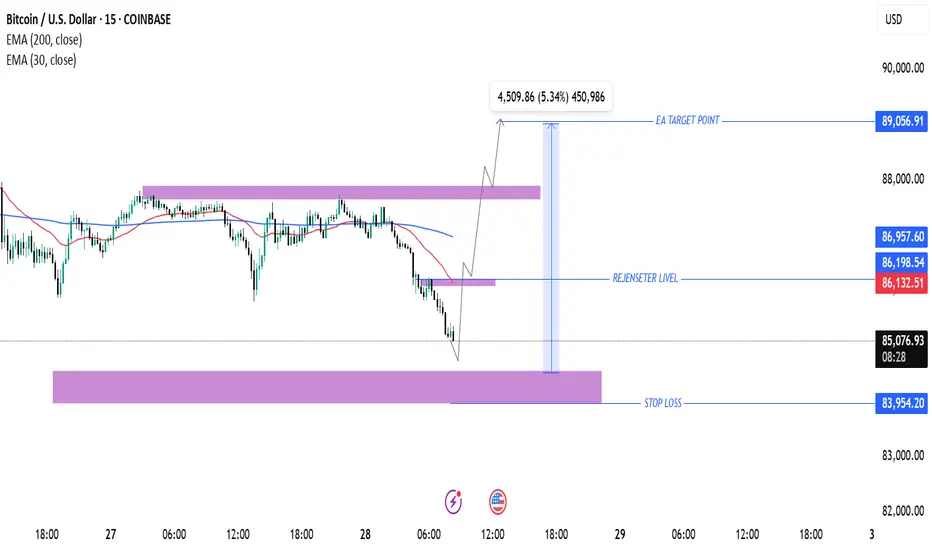
Bitcoin (BTC/USD) Trade Setup: Potential Reversal & Target Proje200 EMA (Blue): 86,960.21
30 EMA (Red): 86,149.39
The price is currently below both EMAs, indicating a short-term bearish trend.
Key Levels:
Stop Loss: 83,954.20 (marked in blue at the bottom)
Re-entry Level: 86,198.54 (near the 30 EMA)
Target Price: 89,056.91
Support & Resistance Zones:
Strong Support Zone: Around 83,954.20
Intermediate Resistance: Near 86,198.54
Major Resistance Zone: Close to 89,056.91
Trade Setup & Projection:
The chart suggests a potential reversal from the support zone.
The expected price movement shows a bounce from support, a breakthrough of the intermediate resistance, and a push toward the target price (89,056.91).
The expected gain is 4,509.86 points (5.34%).
Conclusion:
If BTC holds the support zone, an upside move is likely.
Breaking above 86,198.54 would confirm a bullish reversal.
Failing to hold support at 83,954.20 could lead to further downside.
Bitcoin (BTC/USD) 4H Analysis: Bullish Breakout or Pullback? 🔍 Key Observations:
🔹 📈 Trendline Breakout: The descending trendline (white) has been broken, signaling a potential uptrend.
🔹 📍 Support & Resistance Zones:
🟢 Strong Support (~$80,349 - $82,000): 📉 If price drops, this zone could act as a bounce area. 🛑 Stop-loss is placed below.
🟡 Resistance (~$86,000 - $88,000): 🔄 Currently testing this level—either a breakout or a rejection could follow.
🔵 Next Target (~$94,000): 🚀 If Bitcoin pushes above resistance, this could be the next stop.
📊 Possible Price Action Scenarios:
✅ Bullish Path:
🟢 Breaks Above $86,000 → Targets $94,000 🚀
🔄 Small retest of support before continuing up 📈
❌ Bearish Path:
❌ Rejected at $86,000 → Pullback to $82,000 🔽
📉 If support fails, price may drop further
🎯 Conclusion:
🔥 Bullish Bias: 🟢 A breakout above $86,000 increases the chance of hitting $94,000+.
⚠️ Watch for retests! 🔄 A pullback before an upward move is possible.
🚀 Final Thought: If BTC **

BTCUSDTBINANCE:BTCUSDT
As you can see in BTCUSDT was consolidation upto 1day so either side breakout we can take a trade and expect up to 5% movement. Takr retest entries to avoid falls breakouts and plan your trade accordingly.

M2 Money Supply 45 Day adjusted - BTCM2 Money Supply 45 Day adjusted BULLISH!!!!! If you adjust the M2 money supply by 45 days, it can possibly predict the future price action of Bitcoin and crypto.

Bitcoin Monthly Candle Close Colours from 2011 - maybe RED March
The Odds were higher to get a GREEN February Close but we ended up closing RED
Of the previous 3 RED February closes, Everyone was followed by a RED MARCH
Those same previous RED February Candles were all preceded by a GREEN JAN
We have just had a GREEN January and a RED February and so, Odds are that March will also be RED.
But as we saw in the JANUARY post of this chart, the odds were for a GREEN Feb this year....so do not take this as a certainty. For March to close RED, we do not need to see a massive drop. Just 0.01 USDT below this Feb Close is enough
Also on a BEARISH side, the candles colours since October 2024 follow the sequence from pre 2013 ATH to just after, entering a bear
From Oct 2013 till Feb, Green Green Red Green Red- followed by March and April RED also.
From Oct 2024 till Feb, Green Green Red Green Red
On the BULLISH side, and this has a higher % chance of repeating, Of those 3 previous occasions were we had Green Jan then a Red Feb and a Red March, Two of those Three were entering a Bull run. 2012 and 2020
It should be Noted that those years were the years BEFORE Cycle TOP - We are currently IN the year of expected cycle TOP
Currently March is 6 Green - 7 Red monthly closes.
March is Currently GREEN at time of writing ( 1st March )
Of the previous 7 RED March, 5 were followed by a Green April
Of the 6 Green closes, 3 were followed by a Green April
Of those 6 Green March closes, only 2 really led on to further multi month gains.
In conclusion,
We are statistically more likely to get a RED March and that would put us in a better position to continue to reach a cycle ATH later in the year as the weekly MACD is still falling Bearish from High.
This will have cooled off PA and allowed it to range, possibly in a Wyckoff distribution model
A Red March also Gives us a better buying opportunity and MAYBE, MAYBE some time for ALTS to recover some o their losses......Maybe......
But it really should be remembered that we could also be entering a bear. More info is needed before this is seen clearly but caution is certainly something I will continue to talk about.
Stay safe and remain Cautious

So, the Range box WAS hiding a Secret - what now for Bitcoin
2 days ago, I posted and showed why the Current Range Box of Bitcoin may have had a bearish secret and, well , It happened.
Currently, PA has fallen out of Range and is sitting on levels of Low support
And, as I have been saying since November, there is a CME Gap from 80700 down to 77535
This Gap may get filled as this could be an excellent opportunity to do so.
It is also a great chance for us mere mortals to buy a few More Sats of a Bitcoin at a cheaper price than previously.
And I will, I do not believe this cycle is over yet...
Notice the 2.272 Fib line at 78920 which will offer support and then, just below that we have a rising Long Term line of support at around 76100, depending where PA hits it, should the support above fail.
Of course, we should remember that PA may turn around now, and reclaim a higher high
We have to Watch and react to what happens...
Stay safe

Simple reasons for and against a Bitcoin push in near futureThere are so many people coming out with so many idaes about why Bitcoin should reach for New ATH's in March and, to some degree, it is possible though I am not to sure it would be a good idea now. Something will happen in March though, I am sure ogf that, just not to sure what.
For me, I like to keep things fairly simple. It has worked for me for many years.
So, Lets be simple about this and Look at some basic things
First of All, The Dreaded Hack yesterday that took the market into shock - Many ALTS Bled and are Still in shock.
Bitcoin took it in its stride and fell by -4.7% - It was Less than many a normal days pull back ! And today, we are Green. This shows MASSIVE under laying strength. The Support Structure of Bitcoin is Huge.
So, the the chart.
Reasons for a Push higher.
The Strength PA has, as just mentioned, is an obvious example of a simple reason to expect a push higher.The Daily MACD is Way down low, pretty well oversold and just ranging there, waiting....
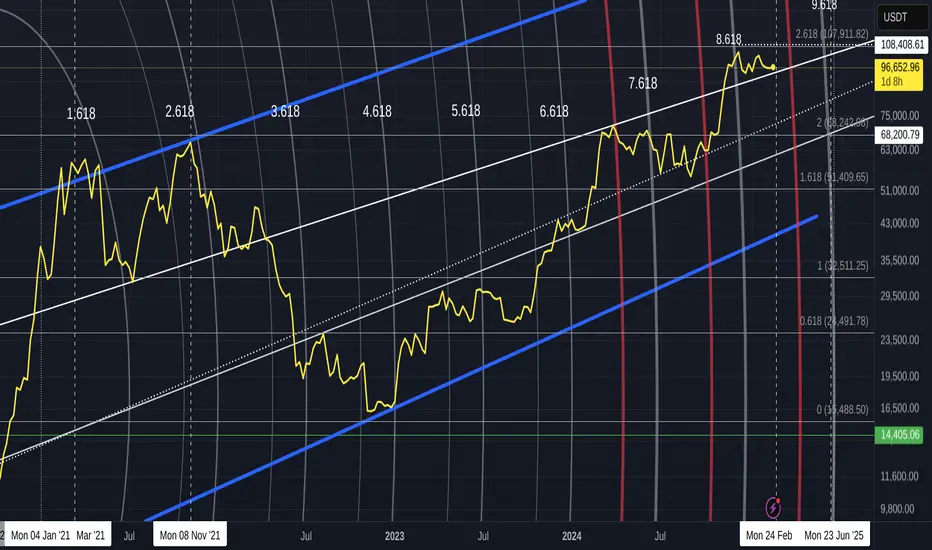
But one thing I want to point out is the trend line that PA is running up. This is the trend line, with origins back 2017, that catapulted PA to the final 2021 ATH. It is strong support, that eventualy broke as the bear market cracked its whip, in 2022. But not before it support PA on two more occasions.
So, Can it do it again ?
PA does not need to react till we begin getting close to that Apex of the triangle we are now in, Which is in JUNE, But with the daily MACD Low and MACRO acceptance of Bitcoin and Trumps push to welcome Crypto, things may advance Quicker. PA certainly has the ability to move higher in the near future
The down side of that is simply, PA would run out of "steam"
Which brings me to why we may not see a push till JUNE and even then, that may just be the initial stage of the final push to cycle ATH. ( which I have said many times previously, is likely to be in Q4, maybe Early Q4 )
Look at this WEEKLY MACD chart
See where that projected line comes down to the Neutral zone...The date of intersection..JUNE
The last time weekly MACD was up here, as you can see, It fell in a very controlled manner and the angle of descent is the same as this projected line.
That happened while BTC PA Ranged across for 6 months
So, there it is, Nice and simple.
JUNE is the best time, or just before, for PA t make a move but it may try some Dances in the time till then
It can continue Ranging across in the Price range of 109K to 91K till then, Still making people money and keeping the world happy.
We can dive Deeper into all kinds of data, onchain etc, get all techie and confound people with new words...but end of the day, Bitcoin will still do the same thing as it always does.
MACD trading is a Latent method, as MACD shows you data after the event.....but it shows Trends.VERY WELL
My money is on the trend Range we are currently in, ending in around End of May to June.
This will lead to a series of New ATH's over 109K, all the way up to Cycle ATH in Q4
What happens than, That is going to be interesting to see.......but thats another story
Stay safe
This is the most possible scenario of BTC in Long TermFirst,
It will go in the First Spot zone
Second,
It will fill the CME gap
Third,
Retest and Breakout
Fourth,
Bull Run
Let's see

Bitcoin Price Analysis: Key Zones to Watch on the 4-Hour ChartWhat is Happening in the Chart?
1. Resistance and Supply Zone (Order Block): Bitcoin is approaching a significant bearish order block (red zone) near the $100,000 mark. This area represents resistance where sellers may take control, pushing the price downward.
2. Potential Retracement: Before continuing its upward trend, Bitcoin may retrace to fill the fair value gap (FVG) and test the 0.5-0.618 Fibonacci retracement levels. These zones are historically strong areas for buyers to re-enter the market.
3. Support and Demand Zone: The bullish order block (green zone) near $92,000 aligns with the retracement zone. This is where Bitcoin might find strong support before resuming its upward trajectory.
Outlook for BTC/USDT
The chart predicts a potential pullback to $92,000-$95,000, followed by a bullish rally aiming to break through resistance at $100,000. If Bitcoin clears the bearish OB, the price could target new highs, potentially surpassing $105,000.
Key Levels to Watch:
Resistance: $100,000 (Bearish OB)
Support: $92,000-$95,000 (Bullish OB and Fibonacci zone)
---
Disclaimer:
This analysis is for informational purposes only and does not constitute financial advice. Cryptocurrency markets are highly volatile, and trading involves significant risks. Always conduct your own research or consult with a financial advisor before making any trading decisions.

BTC - At Strong SupportBTC in news world wide and being moved up and down with each one's opinion and risk taking or profit booking needs. Yearend or month end along with holiday season impacted BTC. while I agree BTC is yet to give the parabolic or banana spike which was seen every 4 years and now is the time for that. Charts are discussed worldwide on one side and its constantly accumulated by people who know why BTC is better than Gold now and in coming days. In my chart two red lines are talked as bullish flag and break of that was called bearish by few and weak hands sold it causing slowness in absorption by people in need of BTC. At the same time BTC is seeing volume at support lines marked in green. Even in 5 or 15 minutes we can clearly see increased volume at which BTC is testing its support for 5th time. Earlier mentioned megaphone or loudspeaker patter didnt give 5 wave up move due to few selling at the bottom of bull flag area. The black line is the point of control of the complete price move seen last 2+ months. In my view levels below the POC - the black line is some kind of buying levels and above the black line is only selling area or profit booking. In my view below POC is accumulation going on by big players. with new Govt in US in Jan and as per 4 year cycle seeing parabolic spike is expected any time in Jan 2025. This is the time to hold tight and buy as much at every green levels support levels mentioned. we cant stop buying or selling of ETFs impacting money flow and supply & demand of BTC. actually smaller volume in the support could be either less supply or demand as well. Any big hand with new ETFs as talked with vivek or any other company going to give bigger parabolic up move. HongKong Fed or Govt and many such countries accumulating BTC making is better than GOLD to be bought, accumulated for 200K or higher in 2025. Happy New Year to all my dear friends. BTC will make everyone richer in fiat currency.

BITCOIN LONG IDEAI'm just analysing BITCOIN in case of an alternative to equity market worstcase scenario.
BITCOIN chart shows flag formation. It looks like ready to breakout of channel.
Target may be Long-term Channel midline.

BTC who can guess this patternHello friends,
Just saw a very good setup forming in 15 min time frame. While doing my btc live trading just found this gem setup.
After consolidation in yesterday's all time high at psychological 90000 level.
It tries to move out of consolidation.
Good high probability trade can be formed.
Trade with proper risk reward.
Money management is key to success in trading.
Learn more with me.
Subscribe
Follow
Like
Share.
Happy trading!

BTC new all time high probability targetHello Friends just saw that again BTC is now at near to ath level.
So while doing btc live trading analysis just found that we've squeeze channel if it gives proper breakout then new target would be calculated according to channel opening.
So it is marked accordingly.
Trade with proper risk management and risk reward to become a profitable trader.
This is my peraonal view
No buy sell recommendations.
Please if you like then subscribe follow and like 👍
Thanks for reading.
Happy trading!

Bitcoin Reached Target, Achieved Profit of +50% ROI, Woo Hoo#BTC For those looking to Book Profit in Bitcoin, now is the right time, as Bitcoin Reached the Target of Top of the Channel Pattern. GOAT moment (Greatest of All Time) in my Bitcoin Analysis, Achieved +50% ROI.
Bitcoin Analysis Chart 2 :
Bitcoin Analysis Chart 3 :
1. In the first image, Bitcoin is approaching a Breakout of the Trendline. If a Breakout occurs, Bitcoin is expected to reach the 0.5 Fibonacci level, then continue its uptrend and eventually break above the Channel Pattern.
2. In the second image, Bitcoin has reached the 0.5 Fibonacci level, and the market has continued its uptrend as anticipated above.
3. Bitcoin Breakout the Channel Pattern.
I want to Help People Make Profit all over the World.
Follow and Support me to help continue my Efforts.

BTC either side breakout big move expectedHello friends, while doing my daily btc live trading I just found that BTC is now trading in upper wedge channel.
As all time high psychology level 90k break expected good move up.
And if good profit booking comes then also trend will follow for some time.
So either side breakout we expect good move.
Trade with your risk to reward good probablity
With money management.
This is just my personal view not a buy sell advice.
Stay tune with me for more btc live updates subscribe follow comment and discuss.
Happy trading!

BTC All time high next resistanceDear Friends I'm following
and writing good articles on BTC While I am doing my btc live trading. I just found btc short term resistance using Fibonacci levels.
As this is just my only personal view.
You can trade accordingly.
To learn more stay tune follow me
subscribe and comment your opinion
Lets discuss traders

BTC All time high new target revealedHello Friends as you know I'm following and writing good articles on BTC While I am also doing my btc live trading.
So I just found btc short term target with good probability if click as planned using cup and handle pattern.
As this is just my only personal view.
You can trade according to your money management and also with proper risk reward.
To learn more stay tune follow me subscribe and comment your opinion.
Lets discuss traders.

BTC ALL TIME HIGH NEW TARGETHello friends as I've told earlier now BTC gets bullish as it has already taken support from daily time frame trend line.
Now new short term target I've found from pole & flag in 30min time frame. As all time high there is no resistance. Also now election is over so markdt will be stable.
This new target is valid if given proper breakout. Then with good probability and risk reward is achieved.
This is my personal view no buy sell recommendations.
Give your views in comment section.

BTC inverted H&S good targetsHey Friends I've just saw inverted head and shoulders in BTC live trading,
So now it's a good risk reward target as marked and also this coincides with previous high.
Try to grab this long side opportunity.
Trade with proper risk management and good risk reward.
Then only your probability of profitable trader begins.
This is not buy sell advice just my personal view.
Let's discuss in comments.

BTC Bitcoin sideways whats nextHere since from yesterday this range BTC Bitcoin is trading.
While I was doing btc live trading, I found that this rahe was worst for trader as it will hunt stop losses on both side.
So just to keep you guys updated I thought to share with you the same.
Let me know your opinions in comments below.
I think any trending move will come only after BTC will move out of this zone.

BTC inverted cup and handle in 5min timeframeAs I've just seen this I thought to share with you guys.
Inverted cup and handle also form at lower time frame.
While doing btc live trading I've already seen big time frame inverted cup and handle if this coincides with smaller time frame and give breakdown as planned then there is a good opportunity for sellers to move its price further down.
Also buyers try to book their profits.
So this gives more probablity trade setup.
And with good risk to reward and money management one can become a profitable trader.
Its not buy sell advice just my personal view.
Can you share your views.

BTC more fall down possibilityAs we've seen big fall and now btc trading in back in daily time frame channel.
This shows that more fall may be coming soon. This is good possibility with high probablity of trade.
Its a really good trade if hits gives good risk to reward.
This is my personal view no buy sell advice.
