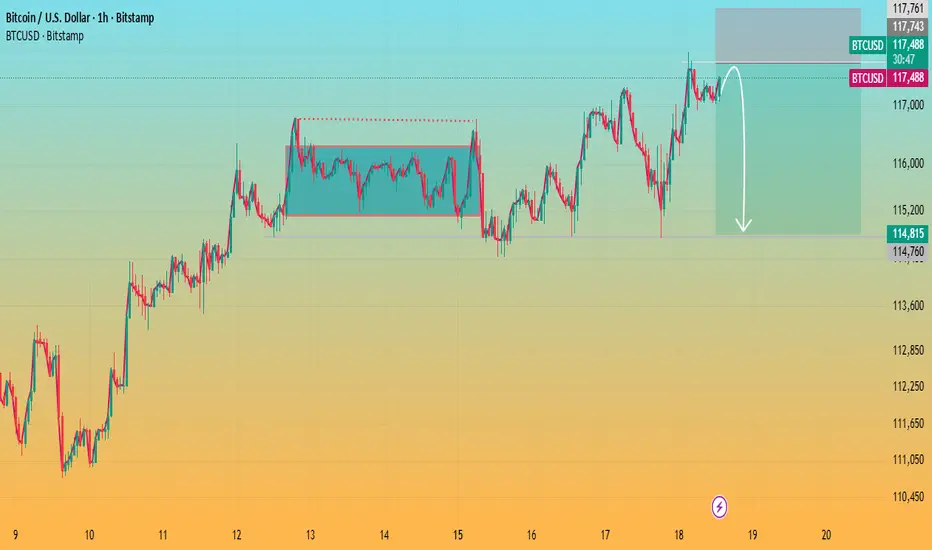
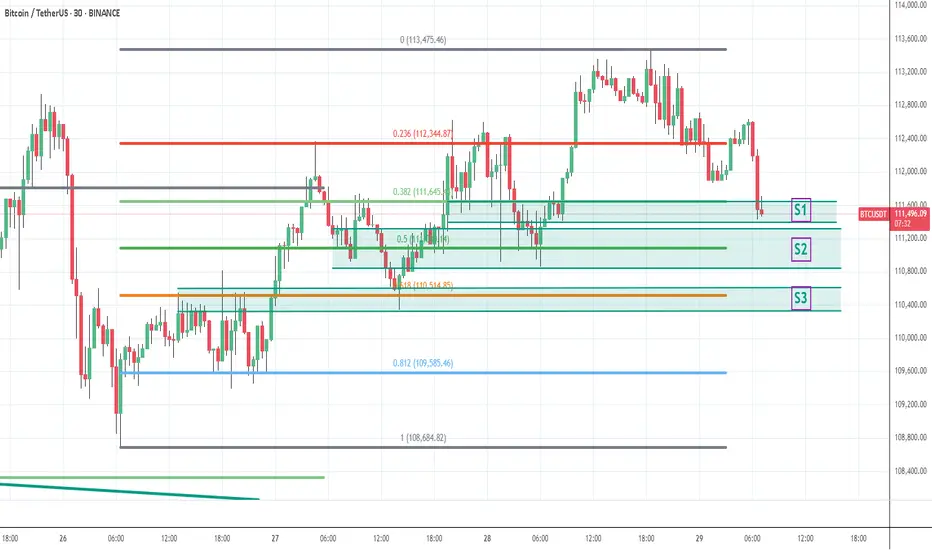
BTCUSD/BITCOIN SELL PROJECTION 03.02.26BTCUSD SELL PROJECTION | Market Breakdown Explained
“Let’s break down the current BTCUSD market structure and why the sell bias is still valid.
Bitcoin is clearly trading inside a parallel downtrend channel, showing strong bearish continuation. After a strong impulsive drop, price attempted a pullback but failed to break the upper trendline, confirming sellers are still in control.
We can clearly see a bearish continuation pattern, where price broke the neckline support, which is a major confirmation for further downside. This breakdown was followed by a Three Black Crows candlestick pattern, showing strong institutional selling pressure.
Currently, price is trading below the R1 resistance zone, and this area is acting as a supply zone. Any pullback toward this zone is considered a sell-on-retest opportunity.
There is a visible Fair Value Gap (FVG) above the current price. The market may retrace slightly to fill this imbalance, but as long as price stays below the downtrend trendline, the bias remains bearish.
The trendline acts as our stop loss area, protecting the sell setup.
On the downside, the first target is Support S1, marked as Target Price 1.
If selling momentum continues, the final target aligns with Support S2, near the lower trendline, marked as Target Price 2.
Btctrend

#BTC/USD Buy Trade Scenario.Here’s an up-to-date BTC/USD Buy trade outlook (technical + fundamental) to help you assess whether positioning for a Upside makes sense right now.
Thank You......


BTCUSD – Buy/Sell Zones + No-Trade Zone Here is a clean, price-action based analysis of your chart with:
✅ Buy zones
❌ Sell zones
🚫 No-trade zone
🎯 TP levels
🛑 SL levels
📌 Overall Market Condition
BTCUSDT is moving inside a big consolidation range.
The zone you highlighted is correct — NO TRADE AREA — because price is stuck in a sideways block with no directional confirmation.
🚫 NO TRADE ZONE
Price: 91,800 – 92,500 USDT
Reason:
Choppy structure
No direction
Liquidity building
Dangerous to open positions inside the block
🔔 Wait for breakout and retest confirmation only.
⬆️ BUY SETUPS (LONG ENTRIES)
1️⃣ Breakout Buy
Buy above → 94,250
📌 Conditions:
Candle must close above the level
Retest + bullish confirmation
🎯 TP targets (Upside green arrows)
TP1 → 96,850
TP2 → 99,640
TP3 → 100,970 (major resistance)
🛑 SL:
Below 93,700 (safe stop)
2️⃣ Pullback Buy (from lower demand)
Buy near → 89,700 – 90,000
This is first strong demand after breakdown.
🎯 TP:
TP1 → 92,300 (back to no-trade zone)
TP2 → 94,250
🛑 SL:
Below 89,150
⬇️ SELL SETUPS (SHORT ENTRIES)
1️⃣ Sell breakdown below support
Sell below → 89,700
🎯 TP levels (red arrows)
TP1 → 88,820
TP2 → 86,140
TP3 → 81,950
TP4 → 79,330 (final target)
🛑 SL:
Above 90,200
2️⃣ Pullback Sell
If price breaks below 89,700, then returns to retest:
Sell zone: 89,700 → 90,000
Confirm rejection wick.
🎯 TP:
Same as above
86,140 → 81,950 → 79,330
🛑 SL:
Above 90,300
📌 FINAL SUMMARY TABLE
Setup Entry TP SL
Breakout Buy Above 94,250 96,850 → 99,640 → 100,970 93,700
Pullback Buy 89,700 – 90,000 92,300 → 94,250 89,150
Breakdown Sell Below 89,700 88,820 → 86,140 → 81,950 → 79,330 90,200
Pullback Sell Retest 89,700 – 90,000 Same as above 90,300
No-Trade Zone 91,800 – 92,500

BTC - Buy - Price @ Support areaBTC is testing the W support area as per SMC retest. Interest Rate cut is super bullish for BTC and markets in general

Bitcoin Testing Resistance with Potential Pullback AheadKey observations:
Range Breakout: Earlier, Bitcoin broke out of a consolidation zone (marked box), which triggered the recent upward move.
Resistance Zone: Price is hovering near the 5.15%–5.42% gain zone, where selling pressure has historically emerged.
Pullback Signal: The drawn arrow suggests a possible rejection at this resistance, pointing to a corrective move down toward the 3% zone.
Momentum Check: If BTC fails to hold above this resistance, a retracement is likely. However, a strong breakout could open the door toward 6% gains.
📌 Conclusion:
Bitcoin is at a decision point. Rejection at resistance could bring a pullback toward 2.8%–3.0%, while a breakout above 5.4% would continue the bullish momentum.
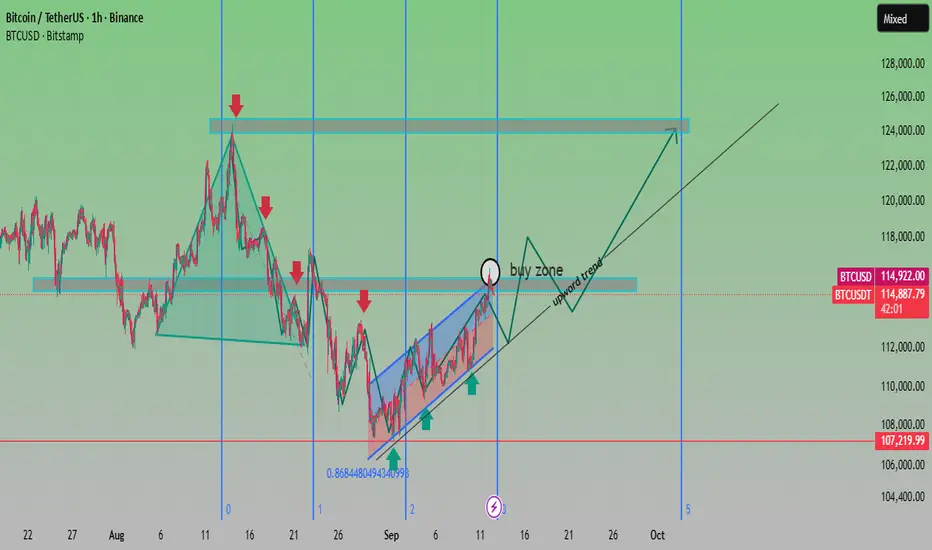
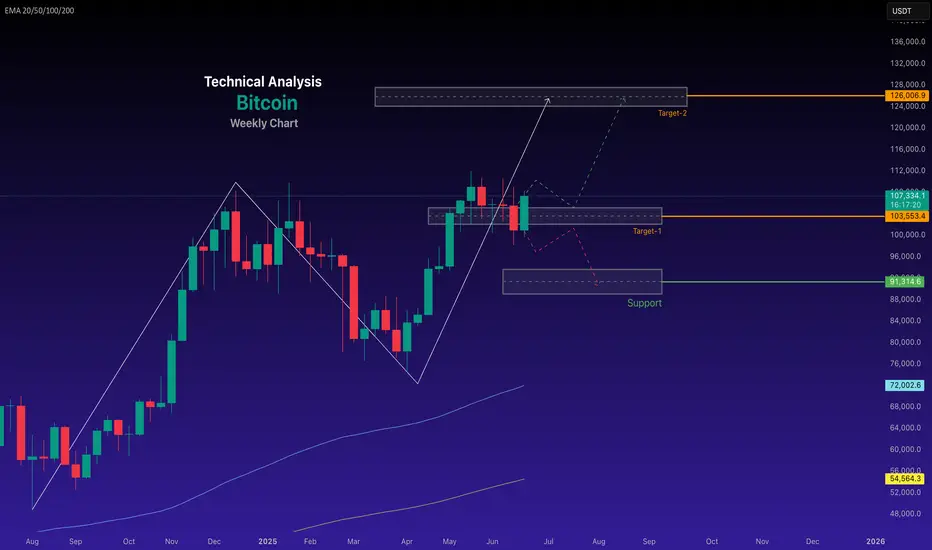
BTC Buy Zone Forming – Potential Bullish Breakout AheadAnalysis:
Trend Structure: After a corrective decline from the $124K resistance area, BTC has rebounded strongly, forming a rising channel (highlighted in blue).
Support Levels: Strong demand observed near $107,200, aligning with the 0.868 Fibonacci retracement, making it a crucial support zone.
Buy Zone: Chart highlights the $114K–$116K range as a buy zone before continuation of the upward trend.
Resistance Levels: Key resistance remains around $124K–$126K, which is the next major target if the bullish momentum sustains.
Outlook: As long as BTC stays above $114K support, the bias remains bullish, with a potential rally towards $120K–$124K. A breakdown below $112K would invalidate the bullish scenario.
✅ Bias: Bullish continuation
🎯 Targets: $120,000 → $124,000
🛑 Invalidation: Break below $112,000
BTC - 29th Aug - collect more qty on every dipswe have monthly expiry and max pain at the top around 117K not sure exactly as it keeps changing some times. I expect any of the mentioned support levels to hold since it went up with demand followed by good data from US and positive equity... long BTC with required enough enough margins so no one can liquidate even during sleeping... weak hands loose btc to whales during dips... collect btc qty on dips... take care, cant predict the exact support levels big players thinking .... But every big players buy every dip when good volume seen for sure
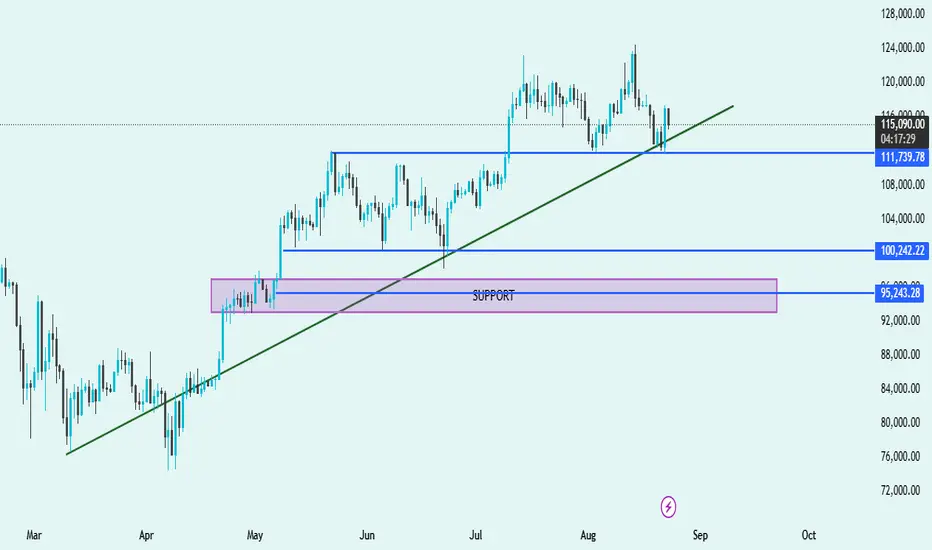
BTC/USDT Technical Analysis – Key Levels & Trend Outlook📊 BTC/USDT Technical Analysis – Key Levels & Trend Outlook 🚀📉
🔹 Trend Structure
Price is currently trading above the trendline, suggesting bulls are still in control, but momentum has weakened.
🔹 Support Zones
Immediate Support: 🔵 $111,739
Price recently tested this level and bounced, showing demand from buyers.
Key Mid-Support: 🔵 $100,242
Strong historical level where buyers stepped in multiple times.
Major Demand Zone: 🟪 $95,243 – $96,500
Highlighted purple support box; this is a critical accumulation zone where bulls are likely to defend strongly.
🔹 Resistance Levels
Near-term resistance: Around $120,000 – $124,000 (recent swing highs).
A breakout above this zone could fuel a new bullish rally.
🔹 Market Outlook
✅ Bullish Bias as long as price respects the green trendline and stays above $111,739.
⚠️ If the price breaks below $111,739 and the trendline, expect a deeper pullback toward $100,242 or even the major demand zone $95,243.
🚀 A breakout above $120K will signal strong continuation to new highs.
📌 Summary:
Trend: Uptrend ✅
Key Supports: $111,739 → $100,242 → $95,243
Resistance: $120,000 – $124,000
Bias: Bullish above $111K, cautious below 🔻
BTC - 18th Aug Before US Open - Dump & Pump or Dump ?History was repeating exactly till half of 5th wave but market considered new ATH as possible profit booking and sold off instead of going in to parabolic up move. The exact place where it has to start the parabolic up move it got dumped. Either its due to CME close and few market players doing false move or its sure dump or lack of buying at these high price or ETH got importance instead of BTC. In this cycle ETH, SOL and XRP and few mother crypto pulling the liquidity and BTC missing those money. Need to wait and watch today and this week. Right now price is still at swing low from where it can move to new ATH to 127 and 130K.

BTC - TP 130K - History repeating with more bullish trendIn my previous chart I clearly said we are going to see 3rd wave as per history pattern seems to be repeating as per ABC pattern worked exactly. In chart clearly shown 3rd wave, 4th wave and one top followed by accumulation (right now happening) after 3rd wave and before parabolic 5th wave exactly happenings. From ABC to 4th wave its exact price move repeating and I wish and expecting the 5th wave in parabolic move and reach the FIB extension shown in chart for 130K logic. since its more bullish may be TP may be higher than 130K as well. Right now price is in accumulation phase after one top followed by wave3 top.
Do not lose your 50 to 60% BTC qty in any false moves. And do not take 100% long qty as well
Maintain Money Managment strictly.
Factors Supporting Crypto - mainly BTC and ETH
1) Fiat money printing causing $ index and US dollar weak
2) Strong US data, Euro zone data and no recession in any country now
3) All trade tax with Europe and China and most of the countries are good
4) Pension money flow in crypto in US + new adoption by corporates one after another
5) New IPO focusing on BTC and nonstop ETFs fund flow as usual

BTC @ Strong Support - 117K Resistance turned Support areaIf Bitcoin is Bullish then price cant go further below than this area at 117K where price broke the resistance line forming the support. Which is the last and strongest support area for Bitcoin in chart.
I am 100% long in Bitcoin at this level now with all required margin in case of any more false down move. will need to hold this long for new ATH. I do not have any other strategy for now.
All data and impacting factors for Bitcoin suggesting +ve for Bitcoin.

BTC - will the history repeat now ? 6th Aug 2025 viewIn Bitcoin previous patterns repeat and many people refer to previous year or earlier pattern.
The price at which price took support and moving up now is similar to the move in below levels in chart as shown and explained. only difference now is in the below pattern wave 3 was much earlier and very aggressive but right now its much lower level tested and yet to move up and show signs of wave 3 to confirm whether history will repeat or not. price action this week is crucial for Bitcoin

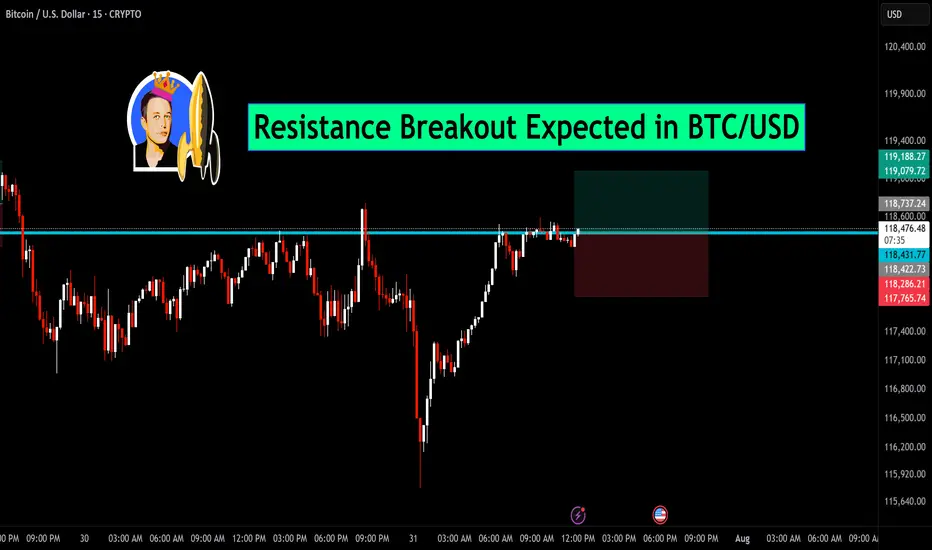
Resistance Breakout Expected in BTC/USDBitcoin is currently testing a key horizontal resistance near the $118,600 zone. After a sharp recovery from recent lows, the price is consolidating just below this level, indicating a potential breakout.
🔍 Chart Insights:
Price action forming higher lows, showing strength.
Breakout above the marked resistance may trigger a strong bullish move.
Tight consolidation near resistance suggests bulls are preparing for a push higher.
📈 Trade Setup:
Entry: Above $118,600 breakout
Target: $119,188 and beyond
Stop-loss: Below $118,200
If price sustains above resistance with volume confirmation, BTC/USD could witness fresh momentum on the upside. Stay alert for the breakout candle.
BTC/USD Bullish Reversal Breakout Pattern BTC/USD Bullish Reversal Breakout Pattern 🚀
Technical Analysis:
🔹 Trend Reversal: The chart shows a clear inverse head and shoulders pattern highlighted with orange circles — a strong bullish reversal signal after a downtrend.
🔹 Breakout Zone: The neckline resistance around 108,000 USD has turned into support (marked as “SU00QT” due to a typo, assumed to be “SUPPORT”). Price action is consolidating just above this zone.
🔹 Trendline Support: The upward blue trendline confirms bullish structure, with price forming higher lows. Recent price action is bouncing off this trendline, showing strength.
🔹 Bullish Confirmation: Green arrows indicate strong bullish rejections from key levels, aligning with breakout retests.
🔹 Target Projection: The measured move from the inverse head and shoulders pattern projects a target towards the 114,000 USD resistance zone 📦 highlighted above, suggesting a potential 5-6% upside move 📊.
Conclusion: As long as price holds above the 108,000 support zone and the ascending trendline, BTC/USD remains bullish with potential continuation towards 114,000 USD. A breakout above minor consolidation could trigger a strong bullish rally 💥.
🛑 Invalidation: A sustained break below 106,000 USD would invalidate the bullish structure and may lead to further downside.

BTCUSD SELL Recommendation – 15-Minute Chart (M15)Sell on short-term downtrend continuation after a technical pullback near resistance and Fibonacci levels.
🎯 Trade Setup:
Sell Zone: 107,000 – 107,200
Stop Loss (SL): 107,650 – 107,850 (above resistance + Fib 23.6% zone)
Take Profit (TP): 105,500 – 105,700
Risk:Reward Ratio: Approx. 1:2 to 1:2.5 – suitable for short-term scalping/swing
📊 Technical Analysis:
1. Fibonacci & Resistance Confluence:
Price is reacting to the Fibonacci 0.382 level (107,059) – a common retracement level in downtrends.
The zone 107,000 – 107,200 overlaps with historical resistance and previously rejected candles → indicating distribution.
2. Moving Average (MA) Pressure:
Price is trading below the MA, and recent pullbacks failed to break above it.
The most recent bounce was rejected around 107,200, suggesting bearish pressure remains.
3. Volume Analysis:
Volume declined on the pullback, showing weak buying momentum.
Meanwhile, the recent drop came with a high-volume bearish candle → sellers are in control.
4. Target Zone – Support Area:
105,500 – 105,700 is a previous swing low and aligns with the Fibonacci 0.618 – 0.786 zone, making it a strong potential bounce area.
This is a reasonable target before the market decides its next direction.
⚠️ Risk Management Notes:
Look for bearish reversal candlestick patterns (e.g., pin bar, bearish engulfing) in the entry zone for confirmation.
If BTC closes strongly above 107,650, consider the short setup invalidated.
Fl me and trading with me! fl Ytb....
Bitcoin Technical Analysis for the Week of 29, June - 07, July
Here's a Bitcoin price analysis for June 29, 2025, based on available data and technical indicators from recent sources:
#Current Market Overview
Price: Bitcoin is trading around $107,331.08 as of June 28, 2025, with a slight 24-hour decrease of approximately 1.99%.
#Market Sentiment: The market shows a neutral to bullish sentiment. The Fear & Greed Index is at 65 (Greed), indicating optimism but not extreme euphoria. Technical indicators suggest a 67% bullish sentiment, with 25 bullish signals versus 5 bearish signals.
Trading Volume: 24-hour trading volume is around $43.1 billion, slightly below recent averages, suggesting cautious trading amid volatility.
~~ Technical Analysis ~~
Price Trends:
Bitcoin is currently testing support at the 20-day EMA ($106,211), with additional support at the 50-day EMA ($103,110) and 100-day EMA ($98,807). The 200-day EMA ($93,092) serves as a key macro support level.
The 50-day moving average is rising and remains above the 200-day moving average, forming a golden cross, a bullish indicator.
Bitcoin is within a descending triangle pattern, which could resolve by July 1, 2025. A breakout above $110,000 could signal a new bull run, while failure to hold $102,000–$104,000 may lead to a drop toward $95,000–$98,000. even to $90,000.
Key Levels:
Support: $100,000 (recently held), $98,000 (psychological), $95,000 (flag pattern lower border).
Resistance: $108,700 (recent high), $110,000 (key psychological level), $112,000 (all-time high from May 2025)
Trend Bullish - Chart for your reference
-- Disclaimer --
This analysis is based on recent technical data and market sentiment from web sources. It is for informational purposes only and not financial advice. Trading involves high risks, and past performance does not guarantee future results. Always conduct your own research or consult a SEBI-registered advisor before trading.
#Boost and comment will be highly appreciated
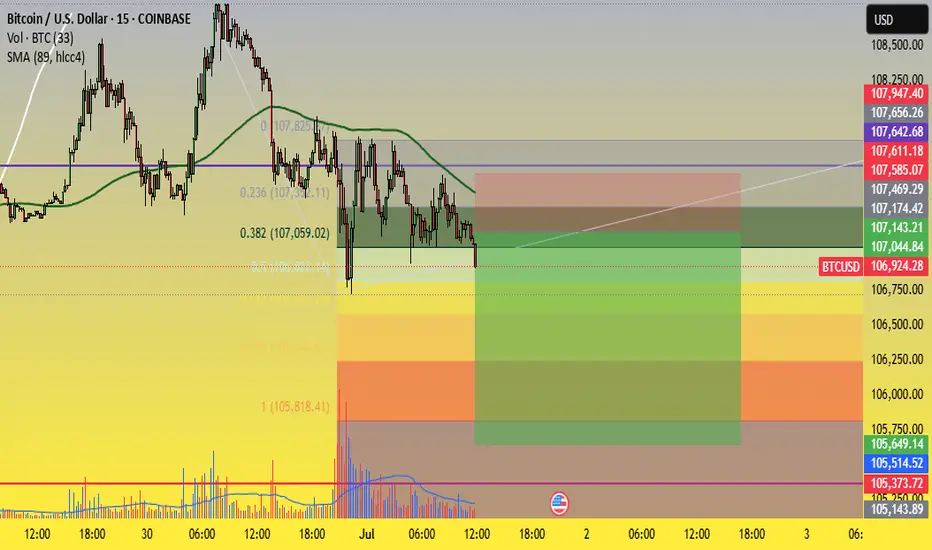
BTC/USD Consolidation Breakout SetupChart Overview:
The BTC/USD chart shows a strong bullish impulse followed by a consolidation phase just below a key resistance level, suggesting a potential bullish continuation.
🔹 Key Technical Zones:
📍 Support Zone:
105,368 – 106,481 USD
This area acted as a strong demand zone where price reversed aggressively.
📍 Resistance Level:
107,439 – 107,840 USD
Price is currently consolidating just below this resistance, indicating a buildup for a breakout.
🎯 Target Zone:
110,683 – 111,394 USD
A clean breakout above resistance could push price into this target area.
🔹 Technical Signals:
✅ Bullish Flag Formation:
After a strong impulse move, BTC is forming a sideways range, indicating bullish accumulation.
⬆️ Breakout Potential:
A confirmed breakout and retest above 107,840 could validate a move toward the 111K region.
⚠️ Invalidation Point:
A drop below 106,481 would invalidate the bullish bias and may trigger a deeper pullback.
📌 Conclusion:
As long as BTC holds above the 106,481 support and breaks above the 107,840 resistance, bullish momentum is expected to continue toward the 111K zone. Traders should watch for a breakout confirmation and manage risk accordingly. 💹
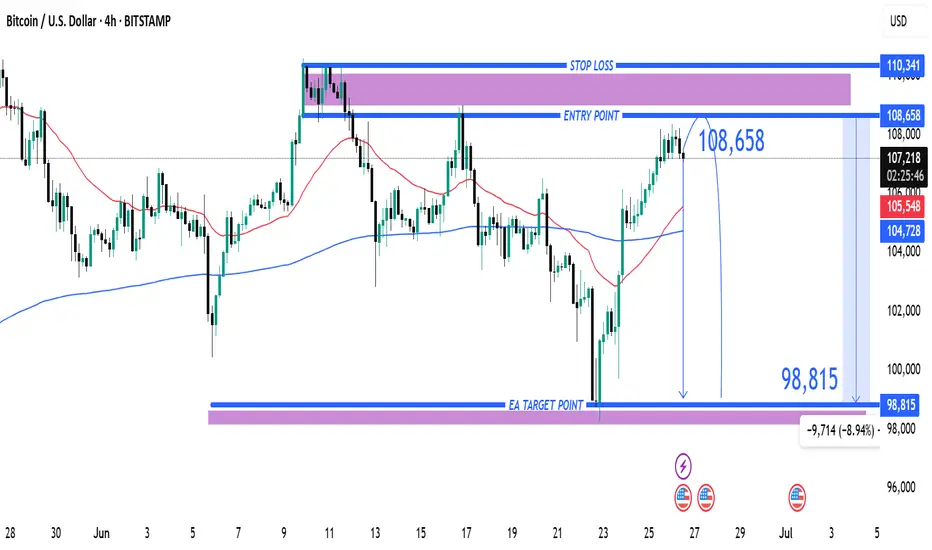
Entry at $108,658 with Target at $98,815 and Stop Loss at $110,31. Entry Point: 108,658
This is where the trader expects to enter a short position.
Price is projected to reverse near this level.
2. Stop Loss: 110,341
Located above the entry point.
If price hits this level, the short trade is invalidated, limiting losses.
3. Target (Take Profit): 98,815
This is the EA Target Point, about 9,714 points (~8.94%) below the entry.
Represents a favorable risk-reward ratio.
---
🔄 Trade Idea Summary
Trade Type: Short (Sell)
Risk: ~1,683 points (110,341 - 108,658)
Reward: ~9,843 points (108,658 - 98,815)
Risk-Reward Ratio: ~1:5.85 (which is strong)
---
📊 Technical Indicators in Use
Moving Averages:
Likely 50-period (red) and 200-period (blue) MAs.
The 50 MA is below the price, indicating short-term bullishness.
However, the trade idea goes against this short-term trend, suggesting a reversal strategy.
---
🔍 Interpretation & Strategy
This chart implies the trader expects resistance near 108,658, possibly due to historical highs or supply zones.
The bearish outlook expects a significant drop to 98,815, possibly supported by macro patterns (like head & shoulders, or bearish divergence—not shown here but could be inferred).
The purple zones highlight high-probability reversal or reaction areas (support/resistance zones).
---
⚠️ Things to Watch
Invalidation: If price closes above 110,341 on a 4H/1D chart, the trade setup fails.
Confirmation: A strong bearish candlestick at or near the entry zone would strengthen the case.
Market Context: News, economic data, or BTC ETF inflows/outflows can quickly invalidate technical setups.
BTC/USDT 4H Analysis – Bullish Cup Formation 📈 BTC/USDT 4H Analysis – Bullish Cup Formation ☕🚀
🔍 Chart Overview:
The 4-hour chart of Bitcoin against USDT on Binance displays a clear "Cup" pattern, suggesting a strong bullish continuation setup. The price action reflects a rounded bottom forming after hitting a solid support zone.
🟣 Key Zones:
🔻 Support Zone: ~$101,000–$103,000
Strong buying interest was observed here with a sharp wick rejection, forming the bottom of the cup.
🔺 Resistance Zone: ~$110,000–$112,000
This area has acted as a historical rejection zone and now stands as the next major target for bulls.
📊 Technical Insights:
The price is gradually curving upward, respecting the rounded cup pattern, often a precursor to a breakout.
A clean break above the resistance zone may trigger continuation toward new highs, possibly above $112,000.
The price is currently at ~$107,700 and gaining momentum with higher lows forming consistently.
🎯 Price Projection:
📌 Target: $111,500–$112,000
📉 Invalidation: Break below the $103,000 support
💡 Conclusion:
If the bullish momentum continues and breaks past resistance, we can expect a powerful upside breakout. Traders should watch for volume confirmation near the resistance zone for potential entry or breakout trades.
📍Pattern in Play: Cup Formation
⚠️Watch for pullbacks before breakout attempts.

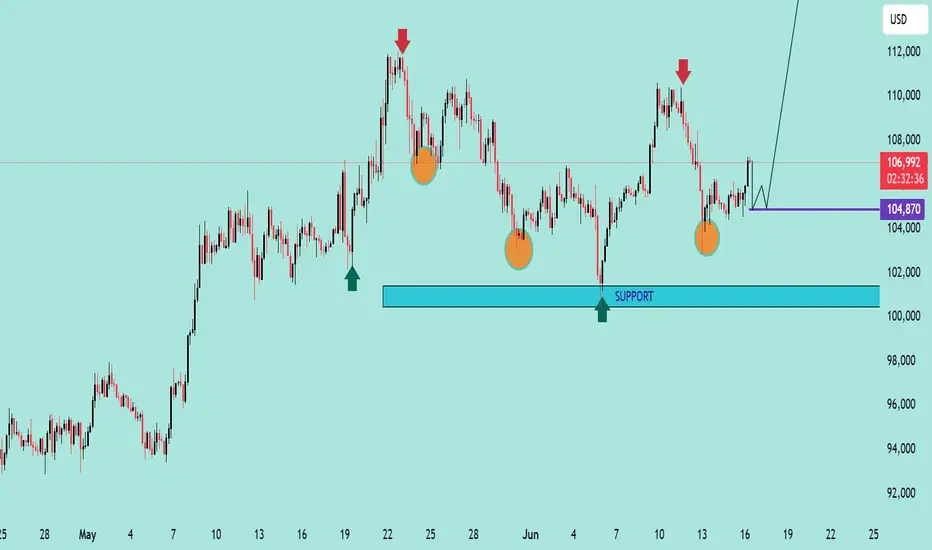
BTC/USD Potential Reversal & Bullish Breakout SetupBTC/USD Potential Reversal & Bullish Breakout Setup 🔄🚀
Technical Analysis Overview:
🔹 Pattern Formation:
The chart displays a potential Triple Bottom pattern (🟠), a classic reversal signal forming at the $104,870–$100,000 support zone 🛡️. This structure suggests a strong base is being established for a potential upside move.
🔹 Support Zone:
📉 The price has consistently bounced off the major support area around $100,000–$104,870, indicating strong buying interest.
🔹 Resistance Zone:
📊 The key resistance level lies around the $114,000–$115,000 range 🔵, which has been tested multiple times in the past (🔴 arrows) and could act as a future profit target.
🔹 Price Action & Projection:
Currently, price is trading near $107,025 and is showing signs of bullish continuation after forming a higher low. If the price consolidates above the $104,870 zone and holds support, we could see a potential breakout targeting the $114,000 resistance 📈.
📌 Key Takeaways:
✅ Triple Bottom formation signals trend reversal.
🔄 Bullish structure confirmed above $104,870.
🎯 Next target: $114,000 if breakout holds.
⚠️ Watch for potential consolidation before continuation.
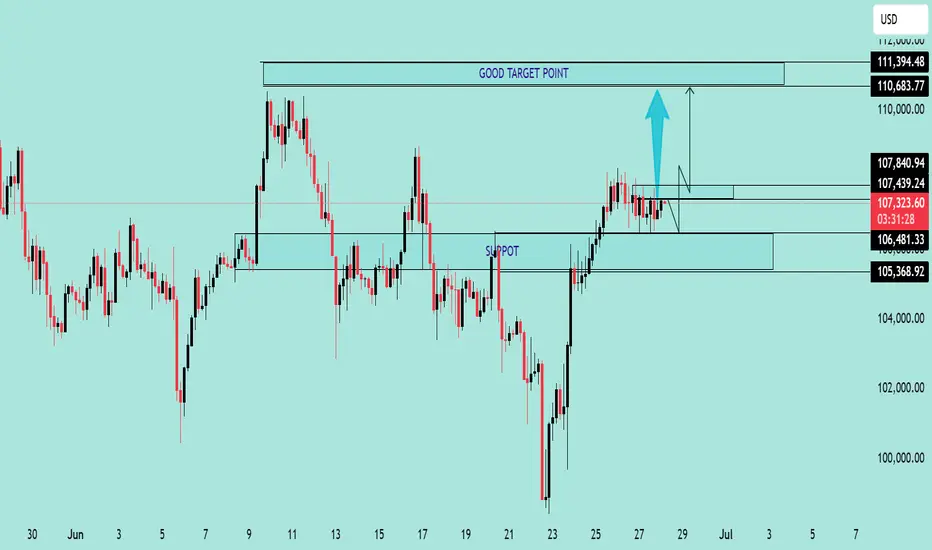
Bitcoin Bounce & Breakout PlayChart Analysis:
🔹 Support Holding Strong:
BTC is respecting a key support area (~$105,600), which previously acted as resistance (marked by recent ATH).
🔹 EMA 70 (Blue Line):
Price is hovering above the EMA, adding bullish confirmation.
🔹 Bullish Projection Path:
The chart shows a projected bullish move toward the sell zone near $113,200 – $113,300, representing a potential 4.4% gain from the breakout.
🔹 Key Zones:
Support Zone: $105,600
Supply Zone: $100,500
Sell Zone (TP Zone): $113,200+
📌 Outlook:
If BTC breaks and holds above the resistance (~$107,000), a strong upward rally could follow.
Entry near support or on breakout, with tight risk management, offers a favorable risk/reward.
✅ Entry Options:
Breakout Entry:
Trigger: Break and close above $107,200
Confirmation: Retest and hold above the breakout zone
Entry: $107,300 – $107,500
Support Bounce Entry:
Trigger: Pullback to support zone (~$105,600) with bullish reversal candle
Entry: $105,600 – $105,800
🎯 Target Zones (TP):
TP1: $110,400 (minor resistance)
TP2: $113,200 – $113,300 (major sell zone)
TP3 (aggressive): $114,000+
🔻 Stop Loss (SL):
For breakout entry: SL below $106,200
For bounce entry: SL below $105,200 or $104,800 (structure break)
📈 Risk–Reward Ratio:
Approx. 1:2.5 to 1:3+ depending on entry and target
🧠 Trade Management:
Move SL to breakeven after hitting TP1
Partial profit booking at TP1
Trail remaining with manual or dynamic SL (e.g., below EMA or recent low)
⚠️ Risk Notes:
Avoid chasing price without breakout confirmation
Watch for fakeouts and heavy selling near TP zones
Adjust position size based on your risk tolerance
