Bitcoin Price Analysis – 1H Chart (BINANCE)📊 Bitcoin Price Analysis – 1H Chart (BINANCE)
Date: May 28, 2025
Pair: BTC/USDT
Timeframe: 1 Hour (1H)
🏔 All-Time High (ATH) Rejection
🔴 Zone: ~111,800 – 112,000 USDT
BTC previously reached an ATH (marked in red) but failed to maintain momentum.
This level formed a double top pattern, a classic reversal signal.
📉 Key Resistance Zone
🟪 Range: ~109,500 – 110,500 USDT
Multiple rejections from this purple box indicate strong seller presence.
This area is now acting as a resistance barrier, preventing upward movement.
🔵 Support & Target Level
📍 Support Level: 106,622.06 USDT
🗨️ “when touch this level next target 100k”
The blue line represents a crucial short-term support.
The chart suggests a bearish move toward this level before a possible bullish reversal.
If price breaks below this, we could see further downside before any major rally.
🔄 Market Structure
🔹 BTC has formed a lower high structure, indicating weakening bullish momentum.
🔻 A head-and-shoulders pattern appears to be forming, which typically signals a reversal from bullish to bearish.
🧠 Trader Insight
📌 A drop to 106,622 USDT may act as a liquidity grab, potentially setting the stage for a major move upward.
⚠️ However, confirmation of a reversal (bullish signals, volume spike) will be critical before assuming a breakout to 100k as implied.
🔍 Conclusion
🚨 BTC is in a critical zone between resistance (~110,000) and support (~106,600).
📉 Near-term bias: Bearish → Targeting 106,622 USDT
📈 Medium-term possibility: Bullish rally only if support holds and sentiment shifts.
Btctrend

BTCUSDT Price Analysis – Potential Drop Incoming! 🔲 Chart Zones
🟥 Resistance Zone (~111,000–112,000):
Price has touched this zone multiple times and failed to break higher – this is a strong resistance area. 🚫📈
🟪 Support Zone (~101,000–102,000):
A historically strong demand area where price previously bounced up. 💪📉
🔍 Current Price Behavior
📊 Price Level: Around 108,666.66
🔄 The chart shows lower highs forming, indicating weakening bullish momentum.
📉 Bearish projection drawn (blue zigzag line) suggests a potential double top forming below resistance.
📉 What’s Expected?
🔵 Big Drop Alert! ⬇️
If the price fails to break above and gets rejected again, the chart predicts a sharp move down toward the support zone.
🎯 Target Area: ~101,000–102,000 (Support zone)
📌 Summary
🧱 Resistance holding strong
💤 Momentum slowing down
⚠️ Bearish move likely
🏹 Targeting support zone for potential bounce
⚠️ Trading Tip 🧠
Watch for confirmation before entering trades! A break below the recent lows could trigger a short opportunity, while a bounce near support could offer a buy setup. 🛑📈

BTC/USD Bullish Setup: Double Bottom Breakout Targeting $110,000 Trade Setup Analysis
1. Support & Resistance Zones
Support Zone (Buy Zone):
Highlighted in purple, between $103,764 and $104,633, with a noted stop loss area near $104,061.
Resistance/Target Zone (Take Profit Area):
Around $109,878 – $110,002 labeled as “EA TARGET POINT”.
2. Double Bottom Pattern (Bullish Signal)
There are two orange circles at the bottom, indicating a double bottom pattern—often a bullish reversal signal.
This is supported by a neckline break near the entry point at $104,534.
3. Moving Averages
Two moving averages are displayed:
Likely a short-term MA (red) and a medium/long-term MA (blue).
The price crossing above both suggests bullish momentum.
4. Trade Plan
Entry Point: Around $104,534
Stop Loss: Below $104,061
Take Profit (Target): $109,878 – $110,002
Risk/Reward Ratio: High, given the tight stop and wide target.
📈 Price Projection
The blue arrowed path suggests:
A minor dip or consolidation near $104,534, followed by a strong upward move toward the target zone.
The movement outlines a classic cup-and-handle or double-bottom breakout pattern.
🧠 Conclusion
This is a bullish trading setup for BTC/USD with a favorable risk-reward ratio. The chart suggests:
Buying near $104,534
Stop loss just below support
Targeting a move to ~$110,000

(BTC/USD) 1H Trade Setup – Key Entry, Stop Loss & Dual TargetEntry Point: 95,431
Stop Loss: 95,264
Target Points:
Upside (Target 1): 100,674 (Potential gain: +5.36%)
Downside (Target 2): 86,614 (Potential loss: -7.57%)
Trade Setup:
Risk-Reward Ratio:
Approx. 1:0.7 (Not ideal; the reward is smaller than the potential loss)
Support Zones:
Highlighted in purple beneath the entry zone — this indicates a historically strong support area.
Resistance Zones:
The upper purple zone marks the next significant resistance around 100,000–100,795.
Technical Indicators:
50 EMA (Blue Line): Indicates mid-term trend support, currently holding price action.
Price Action: BTC appears to be retracing toward support after a bullish rally.
Interpretation:
The setup implies a long (buy) position with a very tight stop loss.
The price is nearing a support zone, and if it holds, there's potential for an upward move to the target at 100,674.
However, if price breaks below 95,264, a sharp drop to 86,614 is anticipated.

BTC/USD) Short Setup: Triple Top Formation Targeting 86,023 USD You’re seeing a potential Head and Shoulders structure (or at least a triple top) — with the orange circles marking failure to break higher around $95K.
The neckline (support) is slightly diagonal down toward the $94K region.
A breakdown is anticipated once the neckline fails.
2. EMAs Interaction:
30 EMA (red) is currently flattening, showing weakening momentum.
200 EMA (blue) is far below, around 88,181 USD, acting as a major support zone — and it aligns with the projected EA TARGET POINT.
EMA compression usually precedes a strong move.
3. Zones and Key Price Levels:
Entry Point: ~95,145.60 USD → high-probability short sell.
Stop Loss: ~96,000–96,957 USD → protects against unexpected breakout.
Target: ~86,023 USD → aligns with past accumulation zone and EMA200.
4. Risk/Reward Ratio:
Potential reward is about 9–10%.
Risk (from entry to stop) is about 1–2%.
Excellent Risk/Reward (>4:1).
5. Momentum and Volume (implied, not shown):
Given the topping pattern and lack of higher highs, buying momentum is weakening.
If volume increases on a breakdown, confirmation will be strong.
📊 Strategic Points:
Aspect Analysis
Trend Still bullish, but topping signs visible
EMA Behavior Short-term EMA flattening, long-term EMA rising slowly
Pattern Formed Triple Top / Head and Shoulders
Risk/Reward Very good (>4:1)
Recommendation Short bias around entry level, with strict stop-loss
⚡ Quick Trading Plan:
Entry: Short at ~$95,145
Stop Loss: ~$96,000–96,957
Target: ~$86,023

(BTC/USD)1H Chart Analysis–Bullish Breakout Setup Toward$98,000Technical Breakdown:
🔹 EMA 9
📉 Orange line (EMA 9 close): $93,233.68
➡️ Price is above EMA, showing bullish strength.
📦 RBR Zone (Rally-Base-Rally)
🔵 Zone: ~$92,000 - $93,000
🛡️ Acts as a support area — price could bounce here if it dips.
🚧 Resistance Zone
📍 Just above current price
📈 A breakout above this zone may trigger a bullish run.
🎯 Target Point: $98,000
🚀 Potential gain: +7.09%
📊 Strong upside target if breakout holds.
🛑 Stop Loss: $90,314.13
⚠️ Placed just below the RBR zone to minimize risk.
Trade Idea Summary:
🔽 Entry: On breakout above resistance
🎯 Target: $98,000
🛑 Stop Loss: $90,314.13
📈 R:R Ratio looks favorable

BTC/USD) Trend channel analysis setup Read The ChaptianSMC Trading point update
technical analysis of Bitcoin (BTC/USD) on the 1-hour timeframe. It showcases a potential breakout continuation vs. pullback scenario, depending on how price reacts around a key short-term resistance area.
---
Key Observations:
1. Current Price:
$93,754 — Price is consolidating just below a local high.
2. Support and Resistance Zones:
Support BOS (Break of Structure): Around the $87,351 level, highlighted in yellow.
Upper Target Zone: $98,954–$98,983
200 EMA: Near $86,926, offering dynamic support.
3. Two Possible Scenarios:
A. Bullish Continuation:
If the price holds above the immediate structure and breaks out of the short-term consolidation near the top:
It may surge toward the upper target zone ($98,983).
This aligns with the ascending channel and continuation pattern.
B. Bearish Pullback:
If the price fails to sustain above the resistance area:
A correction down to the support BOS zone (~$87,351) is likely.
This pullback may be temporary, potentially offering a re-entry zone for bulls.
4. RSI Analysis (Bottom of Chart):
RSI is showing signs of bearish divergence (price making higher highs while RSI makes lower highs).
This suggests momentum is weakening, and a short-term pullback could occur.
---
Trade Ideas:
Long Setup (Breakout):
Entry: Above recent high (~$94,500).
Target: ~$98,950
Stop Loss: Below ~$92,000
Short Setup (Rejection):
Entry: Rejection near ~$94,000–$94,500
Target: ~$87,350
Stop Loss: Above ~$94,800
Mr SMC Trading point
---
Summary:
This analysis reflects a critical decision point for BTC/USD. Price is nearing a local high with RSI divergence suggesting a pullback may come first — but if buyers remain strong and break resistance, a continuation toward GETTEX:98K is likely. Wait for confirmation of direction before entering.
Pales support boost 🚀 analysis follow)

"Bitcoin Bearish Reversal Setup: Supply Zone Short Strategy"🔵 SUPPLY ZONE (Resistance Area)
💥 Strong selling area around 85,800 - 87,800 USD
Historically, price got rejected here
Expect sellers to step in again
✍️ ENTRY POINT
📍 Just below the supply zone (~85,889.89)
Ideal for short position setup
Watch for bearish candlestick patterns for confirmation
🛑 STOP LOSS
❌ Placed above the supply zone at 87,796.97
Keeps risk under control if breakout happens
🎯 TARGET POINT (Support Area)
📉 Around 78,000 USD
Marked by previous support and structure
Great Risk-to-Reward ratio
📐 PATTERN WATCH
Looks like a harmonic pattern (maybe Gartley or Bat) 🦇
Suggests reversal from point D
Also resembles a rising wedge, which is bearish
📊 EMA (9-period)
🧭 Price hovering above the 9 EMA (84,704)
A break below it = bearish confirmation
Summary
🔻 Bearish bias
🛒 Short near supply zone
❌ SL above 87,800
🎯 TP around 78,000

BTC/USD 1H Chart Analysis – Bearish Setup with SBR Rejection🔵 Key Zones & Levels:
🔷 SBR Zone (Support ➡ Resistance):
Price Range: ~$81,000–$83,000
🛑 Stop Loss: $83,002.31 (Just above resistance)
Expecting sellers to step in here if price retests this level
🟠 Mid-Range Zone:
Current price is consolidating just below SBR zone
Could form a lower high before dropping
🟦 Target Zone (Support Area):
🎯 Target Price: ~$75,000
Previous demand area – price bounced hard from here before
🔁 Trade Plan:
📉 Bias: Bearish
📍 Entry: Near current price or after retest of SBR zone
🛑 Stop Loss: $83,002.31
🎯 Target: $75,000 (approx -8.33%)
✅ Summary:
Risk-Reward: Appears solid (R:R > 2:1)
🕵️♂️ Watch for: Fakeouts or rejections in the SBR zone
🔻 Potential Move: -6,804 points if plan plays out

Bitcoin (BTC/USD) Price Analysis: Bearish Breakdown Ahead?🔥 Bitcoin (BTC/USD) 1-Hour Chart Analysis 🔥
🔹 Trend Analysis:
🟡 Price was moving in an ascending channel 📈 but has broken below the trendline.
🟠 A retest of the broken trendline is happening, suggesting a potential drop 📉.
🔹 Trade Setup:
🔽 Short Entry: Expected rejection from the trendline.
❌ Stop Loss: $85,671 - $85,710 (Above resistance).
✅ Take Profit Target: $81,386 - $81,347 (Bearish target 🎯).
🔹 Indicators & Confirmation:
📊 EMA (9) at $84,254 → Acting as resistance 🚧.
🔄 Break & Retest Pattern → Typical for a bearish continuation 🛑📉.
🔹 Conclusion:
⚠️ Bearish Bias: If the price rejects the trendline, it could drop towards $81,386 🎯.
🚨 Invalidation: If the price breaks above $85,710, the short setup is canceled ❌.

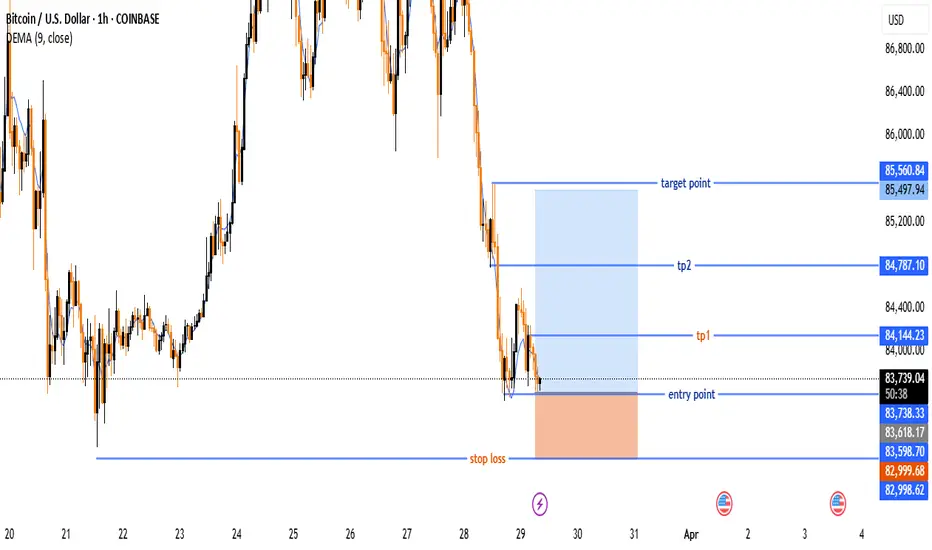
Bitcoin (BTC/USD) Trade Setup – Potential Reversal &Target Leves🔵 Entry Point:
🔹 Around $83,678.04 – The suggested buying zone.
🛑 Stop Loss:
🔻 $82,998.62 – The price level where the trade will be exited if it moves against the plan.
🎯 Target Points:
✅ TP1: $84,144.23 – First profit target.
✅ TP2: $84,787.10 – Second profit target.
🏆 Final Target: $85,560.84 – The ultimate goal for the trade.
📈 Technical Overview:
🔹 The price is at a support level, with a potential reversal to the upside.
🔹 Risk-Reward Ratio is favorable, with a clear uptrend target.
🔹 DEMA (9) at $83,776.52 indicates a possible trend shift.
Bitcoin (BTC/USD) 4H Chart Analysis: Bullish Breakout Ahead?📈 Ascending Channel:
🔹 The price is moving upward within a parallel trend channel.
🔹 Blue arrows (🔵) indicate resistance points where the price struggled.
🔹 Red circles (🔴) highlight support areas where the price bounced.
🟦 Fair Value Gap (FVG) Zone:
🔸 The blue-shaded area (FVG zone) suggests a possible retracement before a bullish move.
🔸 If the price dips into this zone, it may find liquidity and bounce back up.
📊 Projected Price Movement:
⚡ Expected pullback → into FVG zone (🔽), then a bullish push (🚀) towards $90,686.72 🎯.
🟡 Yellow arrow shows the anticipated price path.
📉 Support & Resistance Levels:
✅ Support: Around $86,000 - $86,500 (FVG zone).
🚀 Target: $90,686.72 (next major resistance).
📌 Exponential Moving Average (DEMA - 9):
🔹 The blue line (DEMA 9) at $87,414.57 is acting as dynamic resistance.
🔹 A break above this could confirm further upside movement.
💡 Conclusion:
🔸 Bullish bias remains strong 📈.
🔸 Watch for a dip into the FVG zone before a potential rally 🚀.
🔸 If Bitcoin holds support, it may reach $90K+ soon 🎯🔥.

Bitcoin (BTC/USD) Short Trade Setup – March 15, 2025This is a Bitcoin (BTC/USD) trading setup on a 30-minute timeframe from TradingView. Here's a breakdown of the analysis:
📌 Entry Price: 84,375
📌 Stop Loss: 85,500 (Red Zone - Risk Area 🚨)
📌 Take Profit Levels:
TP1: 83,429
TP2: 82,640
Final Target: 81,259
🔍 Analysis:
The trader is setting up a short position (expecting BTC to decline).
Risk-to-Reward Ratio (RRR) seems favorable, as the target is much lower than the stop loss.
If BTC drops below 83,429, further declines toward 81,259 are expected.
If BTC breaks above 85,500, the trade is invalidated.
🛑 Conclusion:
A bearish trade setup looking for BTC to decline. 📉
Watch for confirmation of downward movement before entering.

BTC - At Strong SupportBTC in news world wide and being moved up and down with each one's opinion and risk taking or profit booking needs. Yearend or month end along with holiday season impacted BTC. while I agree BTC is yet to give the parabolic or banana spike which was seen every 4 years and now is the time for that. Charts are discussed worldwide on one side and its constantly accumulated by people who know why BTC is better than Gold now and in coming days. In my chart two red lines are talked as bullish flag and break of that was called bearish by few and weak hands sold it causing slowness in absorption by people in need of BTC. At the same time BTC is seeing volume at support lines marked in green. Even in 5 or 15 minutes we can clearly see increased volume at which BTC is testing its support for 5th time. Earlier mentioned megaphone or loudspeaker patter didnt give 5 wave up move due to few selling at the bottom of bull flag area. The black line is the point of control of the complete price move seen last 2+ months. In my view levels below the POC - the black line is some kind of buying levels and above the black line is only selling area or profit booking. In my view below POC is accumulation going on by big players. with new Govt in US in Jan and as per 4 year cycle seeing parabolic spike is expected any time in Jan 2025. This is the time to hold tight and buy as much at every green levels support levels mentioned. we cant stop buying or selling of ETFs impacting money flow and supply & demand of BTC. actually smaller volume in the support could be either less supply or demand as well. Any big hand with new ETFs as talked with vivek or any other company going to give bigger parabolic up move. HongKong Fed or Govt and many such countries accumulating BTC making is better than GOLD to be bought, accumulated for 200K or higher in 2025. Happy New Year to all my dear friends. BTC will make everyone richer in fiat currency.

BTC - Buy BTC is in Bullish trend and is in loudspeaker chart pattern. Price is at over sold zone and lower side of the loudspeaker pattern. Even if price drops its good to go long in Bitcoin. If traded in derivatives have enough margin to hold longs in case of any spikes.

BITCOIN LONG IDEAI'm just analysing BITCOIN in case of an alternative to equity market worstcase scenario.
BITCOIN chart shows flag formation. It looks like ready to breakout of channel.
Target may be Long-term Channel midline.

BTC who can guess this patternHello friends,
Just saw a very good setup forming in 15 min time frame. While doing my btc live trading just found this gem setup.
After consolidation in yesterday's all time high at psychological 90000 level.
It tries to move out of consolidation.
Good high probability trade can be formed.
Trade with proper risk reward.
Money management is key to success in trading.
Learn more with me.
Subscribe
Follow
Like
Share.
Happy trading!

BTC new all time high probability targetHello Friends just saw that again BTC is now at near to ath level.
So while doing btc live trading analysis just found that we've squeeze channel if it gives proper breakout then new target would be calculated according to channel opening.
So it is marked accordingly.
Trade with proper risk management and risk reward to become a profitable trader.
This is my peraonal view
No buy sell recommendations.
Please if you like then subscribe follow and like 👍
Thanks for reading.
Happy trading!

BTC 15 mins Cup and handleHello,
While doing my daily btc live trading I've just found our favorite cup and handle pattern.
Here there is trendline breakout also.
So good high probability trade setup.
Trade with proper risk management and risk reward.
This is my personal view.
No buy sell recommendations.
Happy trading!
Subscribe
Follow
Comments
Like

Can BITCOIN REACH 100K !? MARKETSCOM:BITCOIN
CRYPTO:BTCUSD
BITCOIN breaks all time high what next??
Check out chart levels
Stay invested, stay with the word "hold" 👍🏻
@thetradeforecast 🇮🇳

BTC All time high next resistanceDear Friends I'm following
and writing good articles on BTC While I am doing my btc live trading. I just found btc short term resistance using Fibonacci levels.
As this is just my only personal view.
You can trade accordingly.
To learn more stay tune follow me
subscribe and comment your opinion
Lets discuss traders

BTC All time high new target revealedHello Friends as you know I'm following and writing good articles on BTC While I am also doing my btc live trading.
So I just found btc short term target with good probability if click as planned using cup and handle pattern.
As this is just my only personal view.
You can trade according to your money management and also with proper risk reward.
To learn more stay tune follow me subscribe and comment your opinion.
Lets discuss traders.

BTC ALL TIME HIGH NEW TARGETHello friends as I've told earlier now BTC gets bullish as it has already taken support from daily time frame trend line.
Now new short term target I've found from pole & flag in 30min time frame. As all time high there is no resistance. Also now election is over so markdt will be stable.
This new target is valid if given proper breakout. Then with good probability and risk reward is achieved.
This is my personal view no buy sell recommendations.
Give your views in comment section.
