Bearish Continuation Setup After Dead-Cat Bounce (1H)
What the chart is saying:
Clear bearish trend: Price has been making lower highs and lower lows. The broader structure is decisively bearish.
Range breakdown: The blue box shows a consolidation range that broke to the downside, confirming continuation rather than accumulation.
Strong sell-off into demand: Price aggressively dropped into the red support zone (~62k–64k), where buyers stepped in hard, creating a sharp bounce.
Relief rally, not reversal: The current move up is a retracement, not a trend change. Momentum looks corrective, not impulsive.
Key resistance zone (~71k–72k):
This green area is previous support turned resistance
It aligns with the breakdown level → classic short opportunity
Planned trade idea (as drawn):
Entry: Into resistance (green zone)
Invalidation: Clean acceptance above resistance
Target: Prior support / liquidity pool around 63k
R:R: Favorable if rejection confirms
Bias:
📉 Bearish below resistance
Only a strong breakout + hold above 72k would weaken the short thesis
What to watch next:
Rejection wicks, bearish engulfing, or momentum divergence at resistance
Volume drying up on the push into the green zone
Failure to reclaim broken structure
⚠️ This setup assumes trend continuation, not a bottom. Until structure flips, rallies are sell-the-rip candidates.
Btcupdate

BTCUSD (1H) – Range Support Bounce | Bullish Reversal SetupBTCUSD (1H) – Range Support Bounce | Bullish Reversal Setup
Bitcoin is trading on the 1-hour timeframe after completing a corrective decline and forming a clear range structure. Price has recently reacted strongly from the lower demand/support zone, indicating buyer interest at this level.
Technical Breakdown:
Support Zone: Price bounced from a well-defined green demand area, aligning with a cyclical low and previous accumulation.
Structure Shift: After making a higher low, BTC is attempting to reclaim the mid-range, suggesting a short-term bullish reversal.
ALMA Indicator: Price is stabilizing around the ALMA, which often acts as a dynamic trend filter. Holding above it favors upside continuation.
Cycle Projection: The curved projection highlights a potential move toward the upper range resistance, following previous cyclical behavior.
Momentum: The oscillator shows recovery from oversold conditions, supporting the bullish bounce scenario.
Trade Idea:
Entry: Near current levels or on a minor pullback above the support zone
Target: Upper resistance / range high area
Invalidation: A clean break and close below the demand zone would invalidate the bullish setup
Bias:
📈 Bullish toward range high, as long as price holds above support.
⚠️ Always wait for confirmation and manage risk accordingly.

BTCUSD (1H) – Bearish Continuation | Trendline Breakdown IdeaMarket Structure
Bitcoin remains in a clear descending channel on the 1H timeframe. Price has consistently respected the downward sloping trendline, confirming a strong bearish structure with lower highs and lower lows.
Technical Confluence
Trendline Resistance (Red): Multiple rejections validate seller dominance.
Auto Pitchfork: Price is trading below the median line, indicating continuation toward the lower parallel.
Dynamic Support (Green): The recent breakdown below channel support signals bearish continuation rather than a reversal.
Balance of Power (BoP): Reading around -0.38 reflects sustained selling pressure with no bullish divergence.
Price Action
A brief consolidation failed to hold, followed by a strong bearish impulse that broke key intraday support. The current move suggests momentum-driven continuation, not exhaustion.
Trade Idea
Bias: Bearish
Sell Zone: Pullback toward broken support / descending trendline
Targets:
First target: Previous minor low
Extended target: Lower pitchfork boundary / demand zone
Invalidation: Sustained close above the descending trendline
Conclusion
As long as BTC remains below the descending trendline and pitchfork median, the path of least resistance is downward. Any retracement into resistance is likely to be a selling opportunity unless market structure shifts.
Always manage risk and wait for confirmation.

XAUUSD – Bullish Reversal from Demand Zone (H1)Gold (XAUUSD) was previously trading inside a well-defined ascending channel, indicating a strong bullish trend. After reaching the upper boundary, price faced a sharp bearish correction and broke down from the channel.
Following this drop, price found strong support near the 5,000 demand zone, where buyers entered aggressively. From this area, price formed a V-shaped / rounded bottom recovery, signaling a shift in momentum from bearish to bullish.
Currently, price has reclaimed and is holding above the demand zone, showing strong bullish continuation. As long as price remains above this zone, the upside bias remains intact.
Trade Bias: Bullish above the demand zone
Entry Zone: Demand zone retest or bullish continuation
Targets:
Target 1: 5,120
Target 2: 5,198
Invalidation:
A strong break and close below the demand zone would invalidate the bullish setup.
This setup aligns with demand–supply dynamics, trend continuation, and a momentum shift, favoring buyers in the near term.

XAUUSD (Gold) – H1 Chart Idea & AnalysisGold previously printed a strong impulsive rally, followed by an aggressive sell-off that broke short-term structure. After the sharp drop, price formed a volatility spike and is now in a corrective phase, retracing into a key supply / resistance zone.
Key Zones
Entry Zone (Sell Area): ~4,880 – 4,930
This zone aligns with prior consolidation and acts as a bearish order block where sellers previously stepped in.
Target Zone: ~5,000 – 5,060
This is the next major liquidity pool / imbalance zone above, marked as the profit target on the chart.
Trade Bias
Primary Bias: Short-term bullish retracement into resistance, followed by potential bearish reaction.
Price is currently testing the entry zone, suggesting a sell-from-resistance setup if bearish confirmation appears.
Technical Confluence
Retracement after an impulsive bearish move
Previous support flipped into resistance
Presence of imbalance / supply zone
Corrective structure rather than impulsive bullish continuation
Trade Plan
Entry: Sell within the marked resistance zone
Invalidation: Strong H1 close above the zone
Target: Upper marked target zone (partial or full, depending on risk management)
Summary
This setup is based on a corrective pullback into a strong resistance area after a sharp bearish displacement. As long as price remains below the resistance zone, the probability favors a rejection and continuation move. Wait for confirmation and manage risk strictly.

BTCUSD/BITCOIN SELL PROJECTION 03.02.26BTCUSD SELL PROJECTION | Market Breakdown Explained
“Let’s break down the current BTCUSD market structure and why the sell bias is still valid.
Bitcoin is clearly trading inside a parallel downtrend channel, showing strong bearish continuation. After a strong impulsive drop, price attempted a pullback but failed to break the upper trendline, confirming sellers are still in control.
We can clearly see a bearish continuation pattern, where price broke the neckline support, which is a major confirmation for further downside. This breakdown was followed by a Three Black Crows candlestick pattern, showing strong institutional selling pressure.
Currently, price is trading below the R1 resistance zone, and this area is acting as a supply zone. Any pullback toward this zone is considered a sell-on-retest opportunity.
There is a visible Fair Value Gap (FVG) above the current price. The market may retrace slightly to fill this imbalance, but as long as price stays below the downtrend trendline, the bias remains bearish.
The trendline acts as our stop loss area, protecting the sell setup.
On the downside, the first target is Support S1, marked as Target Price 1.
If selling momentum continues, the final target aligns with Support S2, near the lower trendline, marked as Target Price 2.

BTCUSD 45-Min Chart — Support Reclaim Setup After Sharp Breakdow
Chart Analysis:
Market Structure:
Clear bearish break from the prior range near 87k resistance, followed by a strong impulsive sell-off → confirms a bearish market shift.
Support Zone (Key Area):
Price is reacting around 80,600–81,000, a marked demand/support zone. This is the first meaningful base after the dump.
Current Price Action:
BTC is testing support after a lower high, suggesting sellers are losing momentum. Wicks into support show buying interest, but confirmation is still needed.
Entry Logic:
The marked entry near 80.6k assumes:
Support holds
A bounce + reclaim of minor structure (above ~82k)
Targets:
TP1: ~83.2k (range midpoint / liquidity)
TP2: ~83.7k (previous consolidation)
Final Target: ~87.1k resistance (major supply zone + breakdown origin)
Bias Summary:
Short-term: Tactical long from support
Invalidation: Clean break and close below 80.6k
Overall trend: Still bearish until 87k is reclaimed
Takeaway:
This is a counter-trend long setup — high reward, but only valid if support holds and momentum flips. Conservative traders should wait for a confirmed reclaim above 82–83k before committing.

BTCUSDT LONG Trade Of The YEARLonging BTC here for a swing isn’t a bad idea.
TP: ~100k
SL: 78k
BTC is underperforming GOLD and Retail is FOMO’ing into gold & traditional assets.
Narrative shifting to crypto is dead this cycle
Fear & Greed shows crypto traders are scared.
that’s exactly the signal.
that’s when smart money steps in.
I’m taking the long.
— Ommeva

BTCUSD 4H –Demand-to-Resistance Reversal Setup (Structured Long)Market Context
BITSTAMP:BTCUSD is currently reacting from a 4H demand zone after a sharp corrective move from the recent swing high. Price has printed a clear liquidity sweep below prior lows and is now attempting a reclaim of short-term structure.
Technical Breakdown
Strong 4H Demand (D) holding near the 88.9k–89.2k region
Clear reaction + displacement from demand, suggesting active buyers
Price is attempting to reclaim the 4H resistance flip zone (R)
EMA ribbon compression followed by early expansion → momentum shift
Structure aligns with a mean reversion → continuation move
Trade Plan (Illustrative)
Entry: On confirmation above 4H resistance / demand retest hold
Invalidation: Below demand zone low
TP1: ~93.4k (first opposing structure / imbalance fill)
TP2: ~97.7k (daily resistance / premium zone)
R:R remains favorable as long as demand holds and structure is respected
Bias
Neutral → Bullish while price holds above demand
Failure to hold demand invalidates the setup and opens downside continuation
Notes
This is a structure + supply/demand based idea, not a prediction
Best confirmation comes from lower timeframe acceptance and volume expansion
News events may increase volatility—manage risk accordingly
📌 This idea is for educational purposes only. Always manage risk and wait for confirmation.

#BTC/USD Buy Trade Scenario.Here’s an up-to-date BTC/USD Buy trade outlook (technical + fundamental) to help you assess whether positioning for a Upside makes sense right now.
Thank You......


BTCUSD · 15M · SMC BiasPrice is currently compressing inside a higher-timeframe premium discount equilibrium, respecting a clear range structure.
HTF Context
Equal highs / liquidity resting above the range highs.
Premium zone overhead aligned with prior supply + inducement.
Discount zone below marked by clean HTF demand.
LTF Narrative
Market already delivered a strong impulsive leg up.
Current consolidation suggests liquidity engineering, not continuation.
Upside push toward the equal highs is likely a liquidity grab, not acceptance.
Expectation
Sweep of buy-side liquidity into the premium zone.
Immediate reaction from supply.
Sharp displacement to the downside targeting:
Range low
Discount imbalance
HTF demand below
Execution Plan
No chasing longs in premium.
Wait for:
Liquidity sweep above highs
Bearish displacement
LTF MSS confirmation
Shorts favored post confirmation.
Targets trail into discount until opposing demand shows intent.

BTCUSD – 1H | Liquidity Run → Distribution →Mean Reversion ScenePrice delivered an impulsive expansion into premium after sweeping internal liquidity from the range lows. That move was displacement, not acceptance.
We are now stalling at a prior H1 supply / EQH zone near the range high. Structure here is weak: wicks, overlap, and loss of momentum hint at distribution rather than continuation.
Narrative
Liquidity taken above recent highs
Price taps premium supply
Expect a lower high / range failure
Smart money likely reallocating shorts
Execution Bias
Shorts favored below the blue level
Invalidation only on clean H1 acceptance above supply
Downside Targets
Range mid → internal liquidity
Range lows
External sell-side resting near deep discount zone
Until price shows acceptance above supply, this remains a sell-the-rally environment.
Expansion up was the trap. Mean reversion is the play.

BTC 1H: Rejection at Supply, Bearish Continuation RiskChart Analysis (1H BTC/USD):
Major Supply Zone (~90,000–90,200):
Price was strongly rejected from this area, confirming it as a key overhead resistance. Sellers remain active here.
Fair Value Gap (FVG) / Mid Resistance (~89,000–89,500):
The red FVG zone above current price acts as a likely pullback target, but also a strong sell zone if revisited.
Current Structure:
After the rejection, BTC broke down and is consolidating below short-term EMAs, indicating bearish momentum on the 1H timeframe.
Key Support Zones:
Near-term demand: ~86,700
Major downside target: ~84,600
Loss of the 86.7k support increases probability of a deeper move toward 84.6k.
Projected Path:
The dotted projection suggests a possible pullback into resistance (87.8k–89k) followed by continuation lower, unless price reclaims and holds above the FVG.
Bias:
Below 89k: Bearish / sell rallies
Above 90.2k: Bearish bias invalidated, trend may shift bullish

BTCUSD – Buy/Sell Zones + No-Trade Zone Here is a clean, price-action based analysis of your chart with:
✅ Buy zones
❌ Sell zones
🚫 No-trade zone
🎯 TP levels
🛑 SL levels
📌 Overall Market Condition
BTCUSDT is moving inside a big consolidation range.
The zone you highlighted is correct — NO TRADE AREA — because price is stuck in a sideways block with no directional confirmation.
🚫 NO TRADE ZONE
Price: 91,800 – 92,500 USDT
Reason:
Choppy structure
No direction
Liquidity building
Dangerous to open positions inside the block
🔔 Wait for breakout and retest confirmation only.
⬆️ BUY SETUPS (LONG ENTRIES)
1️⃣ Breakout Buy
Buy above → 94,250
📌 Conditions:
Candle must close above the level
Retest + bullish confirmation
🎯 TP targets (Upside green arrows)
TP1 → 96,850
TP2 → 99,640
TP3 → 100,970 (major resistance)
🛑 SL:
Below 93,700 (safe stop)
2️⃣ Pullback Buy (from lower demand)
Buy near → 89,700 – 90,000
This is first strong demand after breakdown.
🎯 TP:
TP1 → 92,300 (back to no-trade zone)
TP2 → 94,250
🛑 SL:
Below 89,150
⬇️ SELL SETUPS (SHORT ENTRIES)
1️⃣ Sell breakdown below support
Sell below → 89,700
🎯 TP levels (red arrows)
TP1 → 88,820
TP2 → 86,140
TP3 → 81,950
TP4 → 79,330 (final target)
🛑 SL:
Above 90,200
2️⃣ Pullback Sell
If price breaks below 89,700, then returns to retest:
Sell zone: 89,700 → 90,000
Confirm rejection wick.
🎯 TP:
Same as above
86,140 → 81,950 → 79,330
🛑 SL:
Above 90,300
📌 FINAL SUMMARY TABLE
Setup Entry TP SL
Breakout Buy Above 94,250 96,850 → 99,640 → 100,970 93,700
Pullback Buy 89,700 – 90,000 92,300 → 94,250 89,150
Breakdown Sell Below 89,700 88,820 → 86,140 → 81,950 → 79,330 90,200
Pullback Sell Retest 89,700 – 90,000 Same as above 90,300
No-Trade Zone 91,800 – 92,500

Bitcoin Monthly Support Test — Next Target $58,419 ?Key support sits at $81,933. A clean break and close below this zone could expose Bitcoin to a deeper retracement toward the next major support around $58,419.
However, $81,933 is also a strong monthly support level, so the market’s reaction here is critical.
Keep an eye on whether this level holds or fails — it will likely dictate the next major move.
Share your view in the comments: Do you think BTC will defend this monthly support, or are we heading lower?

MARKET CONTEXT BTC H1 I NOV.221. Market Overview
Main Trend: BTC is currently in a correction phase following the drop from the highs (92,000+ area). Price is moving sideways within a wide range defined by the Volume Profile.
Current Position: Price is trading around $83,959, positioned just below the POC (Point of Control) and below the Daily Open ($85,054). The fact that price is below the daily open suggests that selling pressure is slightly dominant in today's session.
Trendline Structure: There is a descending trendline (dashed black line) connecting lower highs. The price attempted a breakout above this line but is currently showing signs of a retest or potentially a weakness (fakeout).
2. Price Action Analysis
Key Resistance Zones:
POC Zone (84,250 - 85,054): This is the area with the highest traded volume. Price is currently stuck right below this zone. Specifically, the $85,054 (Daily Open) level is a critical barrier. If BTC fails to reclaim this, the short-term bearish trend will continue.
VAH Zone (87,764 - 87,983): This is the extended target if the Bulls manage to regain control (Value Area High).
Key Support Zones:
Descending Trendline: Price is retesting this breakout line (around the 83,000 - 83,500 area).
VAL Zone (81,329 - 81,441): This is the Value Area Low. This serves as the final line of defense for buyers before prices potentially drop deeper.
3. Price Scenarios & Signals
Given the price location relative to the POC and Trendline, there are two main scenarios for today:
Scenario 1: Bearish Rejection (High Probability)
Since the price is below the Daily Open and struggling at the POC, bears are trying to push the price lower.
Development: Price rallies slightly to the 84,200 - 84,500 area but gets rejected, leaving long upper wicks or large bearish candles. Price then slips back below the descending trendline.
Signal: A 1H candle close below 83,500.
Targets:
TP1: 82,500
TP2: 81,441 (VAL Zone). If this level breaks, price will look for lower liquidity (79k-80k).
Scenario 2: Bullish Reclaim
For this scenario to play out, strong buying power (Volume) is needed to break the current indecision.
Development: Price bounces strongly from the current trendline, piercing through the POC zone and closing firmly above the Daily Open.
Signal: A decisive 1H candle close above 85,100 (clearing both Daily Open and POC).
Targets:
TP1: 86,500
TP2: 87,764 - 87,983 (VAH Zone).
4. Summary
The current status of BTC is Neutral leaning Bearish (Bearish Bias) in the short term (intraday) because the price is trading below the key equilibrium zone (POC) and the Daily Open.
"Kill Zone" (Watch Area): 84,000 - 85,000. This zone will decide the trend for the day.
Recommended Action:
Short: Look for reversal/rejection signals around 84,500 or if the price breaks back down below the trendline at 83,500. Stop loss above 85,200.
Long: Only enter if the price confirms a breakout above 85,100 (Reclaim POC) or wait to buy the dip at the hard support of 81,441 (VAL) if a reversal signal appears there. Avoid Longing in the current "middle of nowhere" zone.
Disclaimer: The analysis and information provided above are for educational and informational purposes only and do not constitute financial investment advice. Please do your own research (DYOR) and take full responsibility for your trading decisions.

BTC # Bitcoin Free fall still pending....Here as per critical box range trading btc bitcoin can free fall if it breaks below . And ot will try to sweep stoplosses of previous weekly low. As marked in chart you can notice this easily that how btc can free fall to hunt more stop losses.
So trade accordingly to see weather it only hunts stop losses and reverses or it will take a continuous fall.

Bitcoin is in a clean daily downtrend right nowBitcoin is in a clean daily downtrend right now – every bounce is just providing fuel for the next leg until the structure says otherwise.
Good evening traders, Brian here with a higher-timeframe look at BTCUSD.
Fundamental analysis
Bitcoin has been under sustained pressure even as some funds continue to accumulate spot positions. A few key points:
Macro uncertainty and tighter dollar liquidity are weighing on high-beta assets. While gold has held up relatively well, the performance gap between BTC and XAU has been widening in recent weeks, highlighting a clear risk-off tone towards crypto.
On-chain and fund flows suggest that a number of crypto investors are actually de-risking and pulling capital out, which reduces market depth and makes downside moves more violent when liquidity is thin.
Narrative is still mixed: long-term holders and some institutions are happy to buy lower, but in the short term the order flow is dominated by forced selling, deleveraging and risk reduction.
Bottom line: the macro backdrop does not yet justify an aggressive “buy the dip” approach on BTC. Trend-following shorts remain safer than trying to call the bottom.
Technical analysis
Daily structure is clearly bearish:
We have a confirmed market structure shift on the left of the chart, with the prior higher-low support broken and a series of decisive lower lows since then.
The main bullish trendline from earlier in the year has given way, and price is now travelling within a steep descending leg.
BTC recently tagged the 1.618 Fibonacci extension of the last major swing, aligning with a prior liquidity pocket. That produced a sharp intraday bounce, but so far it looks like a reaction inside a downtrend, not a full reversal.
Around 75.4k we have an important daily support zone. If this level is broken and accepted below, it opens the door to a deeper flush towards the next large support band lower on the chart.
Overhead, there is a clean imbalance/FVG and prior distribution area around 108k, with an intermediate resistance block around 96–97k and a nearer supply zone around 88k. These are prime locations to look for fresh shorts if price retraces.
For now my bias is simple: look to sell rallies into premium levels; any longs are tactical, short-term trades off key support only.
Key levels
Resistance / short zones:
88,000 – first reaction zone, “pay attention to the reaction”
96,500–97,200 – main short entry area for medium-term positions
108,000 – higher FVG / major daily supply
Support / long-only intraday zones:
75,400 – key support + 1.618 Fib/liquidity zone
74,000–72,000 – deeper support if 75.4k fails
Trade scenarios (for reference, not financial advice)
1. Short the first meaningful pullback – 88k area
Entry: 88,000
Stop: 90,000 (above local structure)
Targets: 82,000 → 78,000 → 75,500
Idea: treat 88k as the first supply zone in a downtrend. If price bounces from current levels and stalls here, I’m looking for rejection (wick rejections, failed break, or a clear shift in intraday structure) to join the trend. Once price moves in favour, I would look to pull the stop to breakeven and let the position run.
2. Core swing short – 96.5k–97.2k zone
Entry: 96,500–97,200
Stop: 99,000
Targets: 88,000 → 82,000 → 75,500
This is my preferred “medium-term” sell area. It aligns with a more significant daily supply block and offers better risk–reward if the larger bearish leg continues. Any squeeze into this region after a series of lower lows is, in my view, a controlled opportunity to reload shorts.
3. Tactical long only at deep support
Entry: 75,400–74,800
Stop: 73,800
Targets: 82,000 → 88,000
Here I would only consider a short-term long if we see a clean liquidity sweep into the 1.618 extension and strong rejection (long lower wicks, aggressive buy-back). The idea is simply to trade the bounce back into resistance, not to fight the higher-timeframe downtrend.
If BTC loses 75.4k and starts closing below it on the daily, I would become much more cautious on any long exposure and focus almost entirely on short setups towards the lower “important support” zone on the chart.
Trade with the trend, respect your risk, and don’t get trapped trying to be a hero at the bottom of a falling market.
If this BTC breakdown adds value to your plan, make sure you follow Brian for more daily BTC and gold analysis, and share your own view in the comments so we can compare scenarios.

Bitcoin Turn Bearish In Monthly Time frameWhat’s going on
Bitcoin slipped significantly this week, dropping into the US$90,000–96,000 range, marking roughly a 10% decline for the week.
The decline has pushed BTC to trade around 20-25% below its all-time high of US$126,200.
On-chain data shows that long-term holders (those who typically hold and not sell) have sold ~815,000 BTC in the past 30 days—the highest such volume since Jan 2024. That suggests weakening conviction among “Holders”.
What’s working against Bitcoin
Recently, Bitcoin dropped below ~US$90k marking its lowest levels in months.
The monthly technical structure shows signs of weakness.
Macro risks are elevated: policy uncertainty (e.g., interest rates) could dampen demand for risk assets.
Key Levels & Scenario
Support Level 1: ~$85,250–$80,704 marked on the chart in weekly time frame, there could be a sharper drop. till Support -1 in monthly time frame ~$70,825–$57,750
Close below $85,000 in weekly and monthly time frames opens up more downside risk.
Given the mixed signals, I'm slightly cautious/bearish for next week, expecting consolidation in the weekly time frame and downside rather than a strong rally.
If the macro/risk environment improves, upside is possible, but as of now, the risk of further decline is stronger than upside.
Disclaimer
High Risk Investment
Trading or investing in assets like crypto, equity, or commodities carries high risk and may not suit all investors.
Analysis on this channel uses recent technical data and market sentiment from web sources for informational and educational purposes only, not financial advice. Trading involves high risks, and past performance does not guarantee future results. Always conduct your own research or consult a SEBI-registered advisor before investing or trading.
This channel, Render With Me, is not responsible for any financial loss arising directly or indirectly from using or relying on this information.

BTC/USD: Sell Pressure Building AgainBTC/USD: Sell Pressure Building Again
Market Summary
BTC/USD continues to operate within a declining market environment where sell-side pressure remains dominant. The recent recovery attempt has shown limited strength, forming only a temporary corrective phase within a broader downward cycle. Current conditions indicate that the market is preparing for another bearish continuation as liquidity builds on the upper side.
Market Behavior
The chart highlights a consistent pattern of declining impulses followed by shallow recoveries. Each upward phase has been met with swift rejection, reinforcing the dominance of bearish sentiment. The mid-range compression visible in the current structure reflects a controlled environment where market participants are redistributing positions rather than initiating larger upward transitions.
Momentum remains weak on the upside, and overall flow continues to align with the prevailing sell-side direction. Repeated structure shifts earlier in the sequence indicate that sellers are maintaining control of directional movement.
Current Setup
BTC/USD is now approaching a zone historically associated with short-term manipulation and liquidity grabs. Price appears to be forming a tight consolidation while climbing into this region. Such behavior often precedes a sell-side continuation, especially when rallies fail to show progressive expansion.
The chart projection suggests a likely formation of a distribution-style sequence before a renewed downward movement. This scenario aligns with the market’s broader behavior over recent sessions

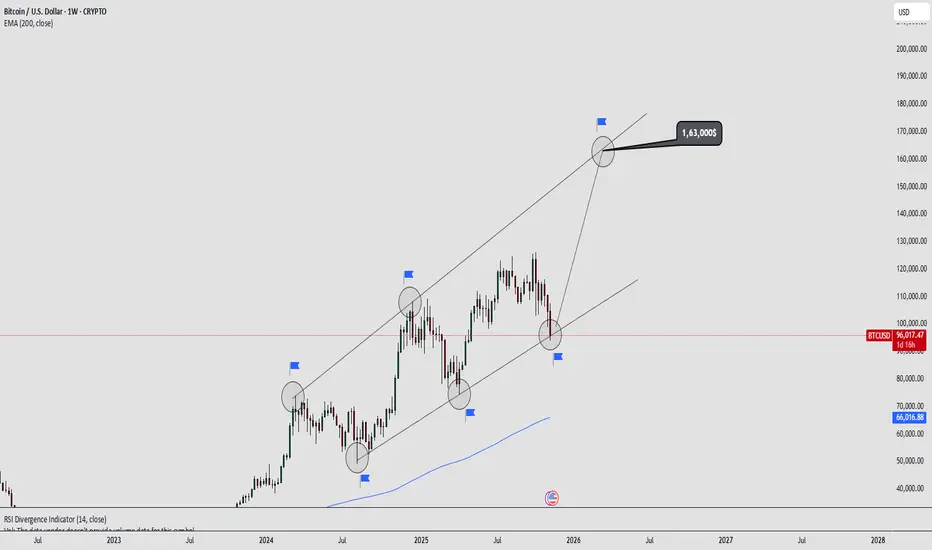
Bitcoin Long-Term Channel Analysis | BTCUSD to $163K Target |Bitcoin is currently respecting a multi-year ascending channel on the weekly chart. The price recently touched the lower trendline support, suggesting that the long-term structure is still intact.
This setup highlights a classic “higher highs and higher lows” pattern within the parallel channel, showing that BTC continues to follow its historical rhythm of expansion and correction phases.
Observations :
• Channel support: around $90,000 – $95,000 zone
• Channel resistance: projected near $160,000 – $165,000
• 200 EMA on the weekly chart near $66,000 providing long-term trend support
• RSI showing signs of recovery from the mid-zone
Technical Outlook:
If Bitcoin maintains the current channel support and forms a bullish reversal candle on the weekly close, the next leg of the rally could target $160K+ within the same channel structure.
Invalidation occurs on a confirmed weekly close below $90K, which would signal a potential trend shift.
Market Sentiment : Bullish (Long-Term)
Timeframe: Weekly
Style: Positional / Long-Term Analysis
Disclaimer: This is a personal technical view for educational purposes, not financial advice.