Bitcoin Bearish Reversal Setup: Rising Wedge Breakdown Targeting1. Entry Point:
Marked around $86,853, this is where a potential short (sell) trade might have been initiated.
2. Stop Loss:
Placed above $88,783, protecting the trade in case the market goes against the position.
3. Target Point (Take Profit):
Aiming down toward $74,443.76, suggesting a large bearish move is anticipated.
4. EMA Indicators:
30 EMA (Red Line) at ~$84,271: Indicates short-term trend.
200 EMA (Blue Line) at ~$83,496: Indicates long-term trend.
Price is currently trading above the 200 EMA but slightly below the 30 EMA, showing mixed short-term momentum.
Btcupdate

BTC/USD Short Setup – Triple Top Reversal with EMA Confirmation Entry Point (Sell): Around $85,699.52
Stop Loss: $86,741.44 (above resistance zone)
Target (Take Profit): $82,982.09
This provides a Risk-Reward Ratio of approximately 1:2, a commonly acceptable ratio in trading.
📈 Indicators:
EMA 30 (Red) is currently above the EMA 200 (Blue), indicating bullish momentum—but this setup anticipates a trend reversal.
If price breaks below the EMAs, that would confirm bearish strength.
🧠 Conclusion:
This setup is based on:
A strong resistance zone,
Bearish reversal pattern (triple top),
Risk management via stop loss and take profit levels.
If you're trading this:
Wait for confirmation with a bearish candlestick below the EMAs or a break of recent support.
Manage position size based on stop distance and your account risk tolerance.

BTC/USD) breakout up trand analysis Read The ChaptianMr SMC Trading point update
bullish analysis of Bitcoin (BTC/USD) on the 4-hour timeframe, showing a potential breakout and rally scenario. breakdown:
---
1. Market Structure:
Downtrend Channel: Price has been moving within a falling channel.
Double Bottom Pattern: Marked by two green arrows — a bullish reversal signal.
Breakout Attempt: Price is testing the upper trendline and 200 EMA (~$83,952), suggesting possible breakout.
---
2. Key Zones:
FVG (Fair Value Gap): Around $78,678 — a demand zone where price could retest before moving higher.
Breakout Confirmation Zone: ~$85,130 — breaking above this with volume signals strength.
Target Point: $95,206 — an upside target projecting ~31.77% gain from the breakout.
---
3. Indicators:
200 EMA: Currently acting as resistance. Break above it confirms bullish momentum.
RSI: Around 60 — pointing upward with bullish divergence from recent lows, showing increasing buying pressure.
---
4. Scenarios:
Scenario 1 (Bullish Continuation):
Breaks above trendline and 200 EMA.
Retest (optional) and then heads toward $95,206 target.
Scenario 2 (Retest First):
Price dips into the FVG/demand zone.
Finds support and launches upwards, confirming a strong base.
Mr SMC Trading point
---
Summary of the Idea:
This is a buy setup on breakout or on pullback:
Aggressive Entry: Break and close above $85,130.
Safe Entry: Pullback into $78,678 area (FVG).
Target: $95,206
Risk Zone: Below $78,000 (invalidates bullish structure).
Pales support boost 🚀 analysis follow)

"BTC/USD Short Setup: Supply Zone Rejection & 5% Drop Target!"BTC/USD 15-Min Chart Analysis
Trade Setup by EA_GOLD_MAN_COPY_TRADE
---
🔼 SUPPLY ZONE (Resistance)
🟣 Price Area: $83,427.80 – $84,313.06
This is where sellers might step in
Price is expected to reverse or slow down here
🔽 ENTRY POINT
🔵 Sell Entry: $83,427.80
Entering short trade just below the supply zone
Aiming to catch a reversal move down
⛔ STOP LOSS
🔴 Stop: $84,313.06
Placed above the supply zone
Limits risk in case of breakout upward
❗ Protects the trade from loss beyond this point
🎯 TARGET / TAKE PROFIT
🟣 Target: $79,071.05
Major support zone / demand area
Potential Drop: -$4,434.27 (-5.31%)
Big reward zone if price dumps from supply
📈 Trendline & Moving Averages
🔵 Blue = Likely 50 EMA
🔴 Red = Likely 200 EMA
Bullish momentum leading into the supply zone
Trendline supports the prior uptrend, now testing reversal
💡 Conclusion
✅ Trade Bias: Bearish (short)
⚖️ Risk-to-Reward: ~1:5 (Great!)
If price reacts at supply, this setup could pay big
But if it breaks up, stop loss keeps you safe

Bitcoin Trade Setup: Bullish Breakout Targeting $87K!🔹 Key Levels Identified:
📌 Target Point: 87,008.21 USD 🏁🔵
👉 Expected price move (+9.07%) 🚀
📌 Entry Point: 79,719.00 USD ✅
👉 Suggested buying level in demand zone 🏦
📌 Stop Loss: 78,213.25 USD ❌🔻
👉 Risk management level 📉
📊 Technical Analysis:
📈 Trendline Support:
🔵 The price bounced off the trendline 📊, confirming an uptrend 📈
🔵 Demand Zone:
🟦 Marked blue area = Buyer interest 📊
💰 Expected reversal zone if price retests
📊 Moving Average (DEMA 9):
🔸 82,343.85 USD (current level)
🔺 Price slightly below DEMA ➝ possible bullish reversal 🚀
⚡ Trade Setup:
✔️ Risk-to-Reward Ratio:
🟢 Potential profit: +7,220.76 USD
🔴 Risk: -1,500 USD
📊 Favorable trade setup with high reward vs low risk ✅
✔️ Momentum Confirmation:
🟢 Above 79,719 USD = 🚀 Bullish breakout
🔴 Below 78,213.25 USD = ❌ Stop Loss triggered
🔮 Conclusion:
🔥 Bullish setup if price holds demand zone!
🚀 Target: 87,008 USD
⚠️ Manage risk with stop loss! 📉

Bitcoin (BTC/USD) Technical Analysis – Bullish Setup🔵 Key Levels:
🎯 Target Point: 87,050.22 (🔼 Expected upward move)
🔵 Support Zone: 79,833.82 (🛡️ Strong demand area)
🔴 Current Price: 82,254.27
📊 Analysis:
🔵 RBS + RBR Zone (🔄 Role Reversal Support & Rally Base Rally) - Possible entry point for a long position.
🟠 Stop Loss: Below 79,833.82 (🚨 Risk Management)
🟣 Resistance Zone: Near 83,000 (🔄 Possible short-term pullback)
📈 Strategy:
1️⃣ Price might retrace to the blue zone (support) before continuing upward.
2️⃣ If it holds, 🚀 potential rally towards 87,050.22 🎯
3️⃣ If it breaks below support, ⚠️ possible downside risk.
✅ Conclusion:
A bullish setup with a 7.45% profit target 📊
Risk managed with a stop loss below support ⚠️

BITCOIN BULLISH POTENTIALPrice has entered the discount zone near a weak low, signaling a potential reversal as smart money may be accumulating after a liquidity sweep. This area often serves as a launchpad for bullish moves, especially when sell-side liquidity has been taken.
Short-term sentiment is shifting bullish, suggesting momentum could be building for a move upward. With key bearish targets already met, the downward pressure may be fading, setting the stage for a corrective move or full reversal.
If bullish structure forms—such as a break of structure or a bullish order block holding—price could begin climbing toward equilibrium and possibly into premium territory. Look for confirmation through price action and volume shifts.

Bitcoin Technical Analysis Bear/Bull Market- Bitcoin is currently trading at $74,452, down 32% from its ATH.
- Bitcoin is facing a significant sell-off along with major world indices due to the tariff war between the US and China and other powerhouses.
- This widespread selling will stabilize once it leads to the absorption of all bears, and eventually, we will see sideways action followed by an upward expansion.
- The important areas to monitor are the highlighted circles; the first one marks the origin of the move, while the second contains a fair value gap that has not yet been mitigated.
- From a Spot buyer perspective I would like to see either of the two paths playing out
- Manage risk until then
- Buying Zones: 60-63,000$ & 67,000-71,000$

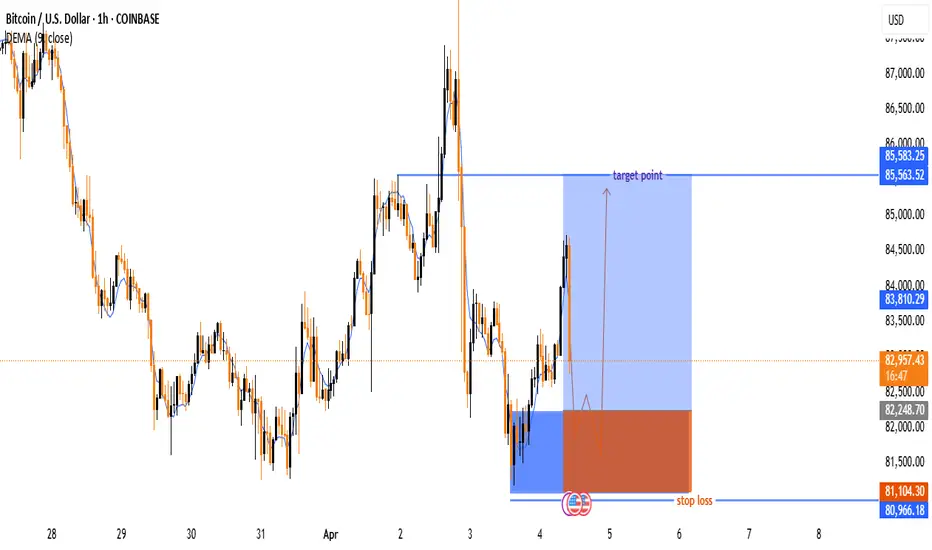
Bitcoin (BTC/USD) Trade Setup & Analysis🔹 Trend Analysis:
📉 The chart shows a downtrend followed by a reversal attempt.
📈 The price bounced off a support zone and is moving upwards.
🔹 Indicators:
📊 The 9-period DEMA (83,805.38) is slightly above the current price, acting as a resistance level.
🔹 Trade Setup:
🟢 Entry Zone: Around 82,943 (Current Price)
🔴 Stop-Loss: 81,183.22 ❌ (Below support level)
🎯 Target Point: 85,563.52 ✅ (Upper resistance level)
🔵 Strategy: The trade anticipates a price dip before
Bitcoin (BTC/USD) Price Analysis: Bearish Breakdown Ahead?🔥 Bitcoin (BTC/USD) 1-Hour Chart Analysis 🔥
🔹 Trend Analysis:
🟡 Price was moving in an ascending channel 📈 but has broken below the trendline.
🟠 A retest of the broken trendline is happening, suggesting a potential drop 📉.
🔹 Trade Setup:
🔽 Short Entry: Expected rejection from the trendline.
❌ Stop Loss: $85,671 - $85,710 (Above resistance).
✅ Take Profit Target: $81,386 - $81,347 (Bearish target 🎯).
🔹 Indicators & Confirmation:
📊 EMA (9) at $84,254 → Acting as resistance 🚧.
🔄 Break & Retest Pattern → Typical for a bearish continuation 🛑📉.
🔹 Conclusion:
⚠️ Bearish Bias: If the price rejects the trendline, it could drop towards $81,386 🎯.
🚨 Invalidation: If the price breaks above $85,710, the short setup is canceled ❌.

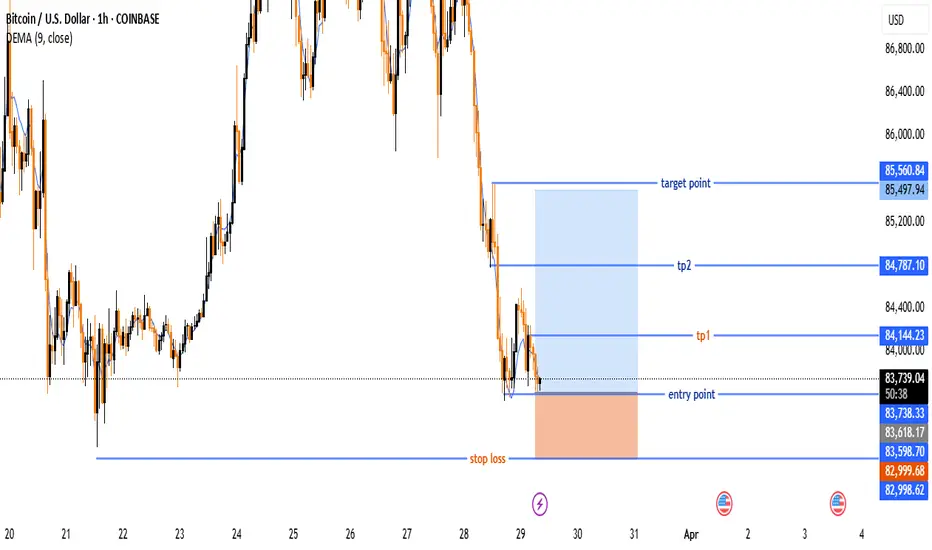
Bitcoin (BTC/USD) Trade Setup – Potential Reversal &Target Leves🔵 Entry Point:
🔹 Around $83,678.04 – The suggested buying zone.
🛑 Stop Loss:
🔻 $82,998.62 – The price level where the trade will be exited if it moves against the plan.
🎯 Target Points:
✅ TP1: $84,144.23 – First profit target.
✅ TP2: $84,787.10 – Second profit target.
🏆 Final Target: $85,560.84 – The ultimate goal for the trade.
📈 Technical Overview:
🔹 The price is at a support level, with a potential reversal to the upside.
🔹 Risk-Reward Ratio is favorable, with a clear uptrend target.
🔹 DEMA (9) at $83,776.52 indicates a possible trend shift.
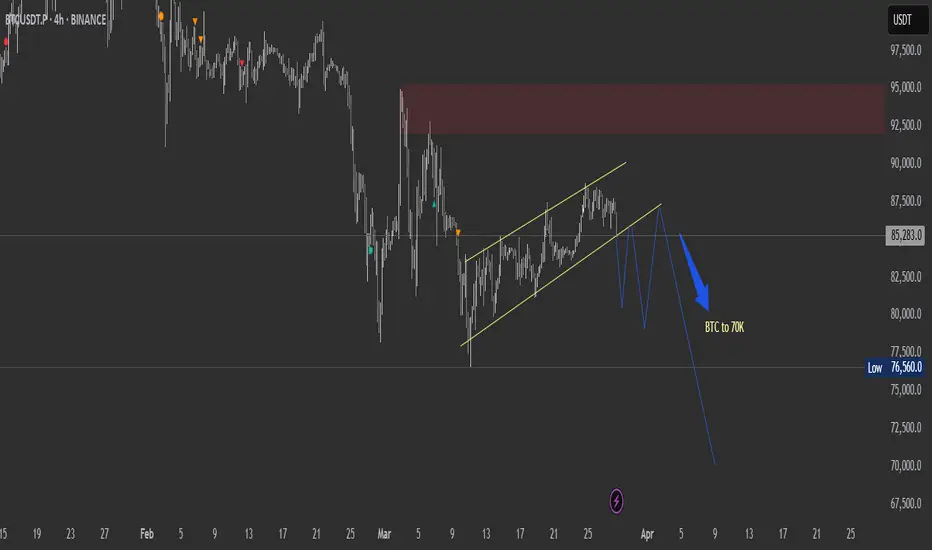
BTC to touch 70K if it breaksdown from this zoneTechnical analysis on the 4-hour chart suggests forming a bearish flag pattern—a continuation pattern that typically indicates a pause before the prevailing downtrend resumes.
If the current bearish flag pattern breaks down, Bitcoin's price could potentially decline to around $70,000. Such projections are based on technical analyses that consider factors like weak support levels and historical price movements.
Bitcoin (BTC/USD) 4H Chart Analysis: Bullish Breakout Ahead?📈 Ascending Channel:
🔹 The price is moving upward within a parallel trend channel.
🔹 Blue arrows (🔵) indicate resistance points where the price struggled.
🔹 Red circles (🔴) highlight support areas where the price bounced.
🟦 Fair Value Gap (FVG) Zone:
🔸 The blue-shaded area (FVG zone) suggests a possible retracement before a bullish move.
🔸 If the price dips into this zone, it may find liquidity and bounce back up.
📊 Projected Price Movement:
⚡ Expected pullback → into FVG zone (🔽), then a bullish push (🚀) towards $90,686.72 🎯.
🟡 Yellow arrow shows the anticipated price path.
📉 Support & Resistance Levels:
✅ Support: Around $86,000 - $86,500 (FVG zone).
🚀 Target: $90,686.72 (next major resistance).
📌 Exponential Moving Average (DEMA - 9):
🔹 The blue line (DEMA 9) at $87,414.57 is acting as dynamic resistance.
🔹 A break above this could confirm further upside movement.
💡 Conclusion:
🔸 Bullish bias remains strong 📈.
🔸 Watch for a dip into the FVG zone before a potential rally 🚀.
🔸 If Bitcoin holds support, it may reach $90K+ soon 🎯🔥.

Bitcoin (BTC/USD) 4H Analysis: Bullish Breakout or Pullback? 🔍 Key Observations:
🔹 📈 Trendline Breakout: The descending trendline (white) has been broken, signaling a potential uptrend.
🔹 📍 Support & Resistance Zones:
🟢 Strong Support (~$80,349 - $82,000): 📉 If price drops, this zone could act as a bounce area. 🛑 Stop-loss is placed below.
🟡 Resistance (~$86,000 - $88,000): 🔄 Currently testing this level—either a breakout or a rejection could follow.
🔵 Next Target (~$94,000): 🚀 If Bitcoin pushes above resistance, this could be the next stop.
📊 Possible Price Action Scenarios:
✅ Bullish Path:
🟢 Breaks Above $86,000 → Targets $94,000 🚀
🔄 Small retest of support before continuing up 📈
❌ Bearish Path:
❌ Rejected at $86,000 → Pullback to $82,000 🔽
📉 If support fails, price may drop further
🎯 Conclusion:
🔥 Bullish Bias: 🟢 A breakout above $86,000 increases the chance of hitting $94,000+.
⚠️ Watch for retests! 🔄 A pullback before an upward move is possible.
🚀 Final Thought: If BTC **

When to Buy This Bitcoin Dip - My Technical Take on current PAOn BTC ,Yesterday's bounce is worth noting, but I'm approaching it with caution. The recently broken support trendline (now visible as a diagonal resistance) will likely act as resistance in the 89-91K zone, also we have a Horizontal resistance at 83-85K which is previous support now becomes resistance .
For potential entries, I'm watching two key scenarios:
Bullish Case 1: If BTC can reclaim and close above the broken trendline (89-91K), it would suggest the breakdown was a fakeout. This could set up a potential move back toward previous highs.
Bullish Case 2: If price continues lower to the 73K major support zone (marked by the green rectangle), this could provide an excellent buying opportunity with a favorable risk/reward ratio. A strong bounce from this level could signal the end of the correction and the start of a new uptrend.

BTCUSDTBINANCE:BTCUSDT
As you can see in BTCUSDT was consolidation upto 1day so either side breakout we can take a trade and expect up to 5% movement. Takr retest entries to avoid falls breakouts and plan your trade accordingly.

BTC broke down the important trendlineBTC broke from the important trendline and headed to $78k.
Momentum looks good and might pick up. Present 4hr candle should be considered

You need to be a simple invstorThe most effective way to find the dip is...following my updates for long term view. I told you guys to f*king bought the dip in 2022, but you did not listen. NOW you come back and ask me is it ok to buy now at 100k range? THAT'S SO REDICULOUS!

BTC LONG SETUPBTC will fill FVG at 85,500 before it pumps to the 98K zone.
Also, the Friday White House Crypto Summit on Friday is even slightly positive.
Buckle up for LONG!

Bitcoin : Easy to follow hype, Hard to hodl through dropsThe recent price action shows a sharp spike followed by a pullback, with a notable gap between approximately 81XXX and 84XXX. This gap suggests a rapid move that wasn’t fully filled, which could act as support in current correction phase.
The overall trajectory from 2023 to early 2025 shows that Bitcoin is in a strong bull market, potentially driven by macroeconomic factors (e.g., inflation concerns, institutional adoption, Trump Government) or halving cycles (the last one was in 2024). The break above 100K validate this sentiment.
Potential Scenarios:
Continuation: If the pullback holds above the 81XXX–85XXX (Daily or weekly TF) gap or around 73XXX-74XXX support(A test to last breakout zone ,considering worst case scenario), Bitcoin could retest 110,000 and push toward 120,000–150,000 in the mid-to-long term (2025–2026), assuming bullish momentum persists.
I lean toward a optimistic view/Bullish View when everyone is fear right now, expecting a low very soon within current to next week (Early March) which can provide buying opportunities (As marked on chart) and considering my target around 120K to 150K for long term.

This is the most possible scenario of BTC in Long TermFirst,
It will go in the First Spot zone
Second,
It will fill the CME gap
Third,
Retest and Breakout
Fourth,
Bull Run
Let's see

Bitcoin Technical Analysis - Monthly#Elliottwave analysis for #Bitcoin ( CRYPTOCAP:BTC ) provides a framework to understand potential price movements based on past patterns. However, given the #Crypto market's unique characteristics, it should be used in conjunction with other analytical tools. The current analyses suggests optimism for continued growth, but with caution for potential corrections or consolidations before reaching new highs.
Hear is a Char for your reference

BTC in clear down TrendBTC making lower highs and lower lows shows in clear down trend for last few days
