BTC/USDT 4H Analysis – Bullish Cup Formation 📈 BTC/USDT 4H Analysis – Bullish Cup Formation ☕🚀
🔍 Chart Overview:
The 4-hour chart of Bitcoin against USDT on Binance displays a clear "Cup" pattern, suggesting a strong bullish continuation setup. The price action reflects a rounded bottom forming after hitting a solid support zone.
🟣 Key Zones:
🔻 Support Zone: ~$101,000–$103,000
Strong buying interest was observed here with a sharp wick rejection, forming the bottom of the cup.
🔺 Resistance Zone: ~$110,000–$112,000
This area has acted as a historical rejection zone and now stands as the next major target for bulls.
📊 Technical Insights:
The price is gradually curving upward, respecting the rounded cup pattern, often a precursor to a breakout.
A clean break above the resistance zone may trigger continuation toward new highs, possibly above $112,000.
The price is currently at ~$107,700 and gaining momentum with higher lows forming consistently.
🎯 Price Projection:
📌 Target: $111,500–$112,000
📉 Invalidation: Break below the $103,000 support
💡 Conclusion:
If the bullish momentum continues and breaks past resistance, we can expect a powerful upside breakout. Traders should watch for volume confirmation near the resistance zone for potential entry or breakout trades.
📍Pattern in Play: Cup Formation
⚠️Watch for pullbacks before breakout attempts.
Btcusdbuy

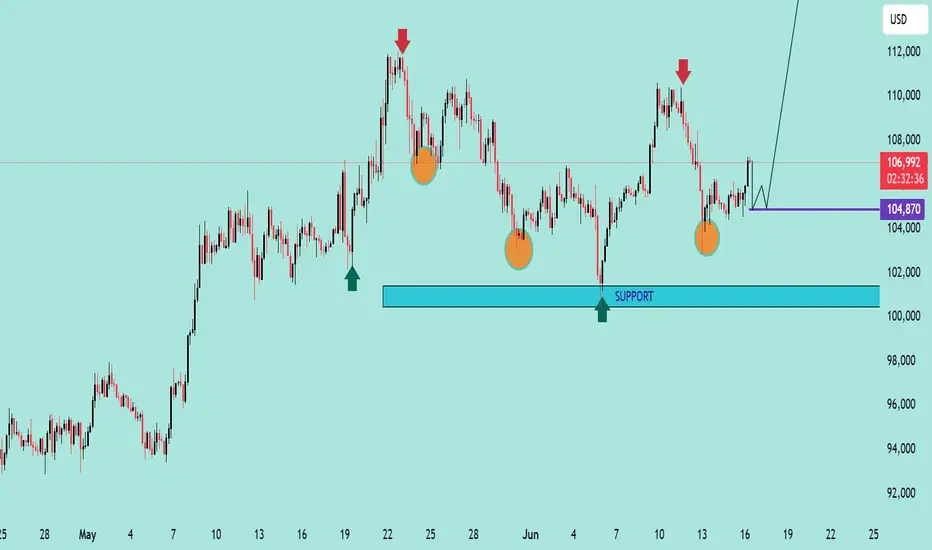
BTC/USD Potential Reversal & Bullish Breakout SetupBTC/USD Potential Reversal & Bullish Breakout Setup 🔄🚀
Technical Analysis Overview:
🔹 Pattern Formation:
The chart displays a potential Triple Bottom pattern (🟠), a classic reversal signal forming at the $104,870–$100,000 support zone 🛡️. This structure suggests a strong base is being established for a potential upside move.
🔹 Support Zone:
📉 The price has consistently bounced off the major support area around $100,000–$104,870, indicating strong buying interest.
🔹 Resistance Zone:
📊 The key resistance level lies around the $114,000–$115,000 range 🔵, which has been tested multiple times in the past (🔴 arrows) and could act as a future profit target.
🔹 Price Action & Projection:
Currently, price is trading near $107,025 and is showing signs of bullish continuation after forming a higher low. If the price consolidates above the $104,870 zone and holds support, we could see a potential breakout targeting the $114,000 resistance 📈.
📌 Key Takeaways:
✅ Triple Bottom formation signals trend reversal.
🔄 Bullish structure confirmed above $104,870.
🎯 Next target: $114,000 if breakout holds.
⚠️ Watch for potential consolidation before continuation.
Bitcoin Bounce & Breakout PlayChart Analysis:
🔹 Support Holding Strong:
BTC is respecting a key support area (~$105,600), which previously acted as resistance (marked by recent ATH).
🔹 EMA 70 (Blue Line):
Price is hovering above the EMA, adding bullish confirmation.
🔹 Bullish Projection Path:
The chart shows a projected bullish move toward the sell zone near $113,200 – $113,300, representing a potential 4.4% gain from the breakout.
🔹 Key Zones:
Support Zone: $105,600
Supply Zone: $100,500
Sell Zone (TP Zone): $113,200+
📌 Outlook:
If BTC breaks and holds above the resistance (~$107,000), a strong upward rally could follow.
Entry near support or on breakout, with tight risk management, offers a favorable risk/reward.
✅ Entry Options:
Breakout Entry:
Trigger: Break and close above $107,200
Confirmation: Retest and hold above the breakout zone
Entry: $107,300 – $107,500
Support Bounce Entry:
Trigger: Pullback to support zone (~$105,600) with bullish reversal candle
Entry: $105,600 – $105,800
🎯 Target Zones (TP):
TP1: $110,400 (minor resistance)
TP2: $113,200 – $113,300 (major sell zone)
TP3 (aggressive): $114,000+
🔻 Stop Loss (SL):
For breakout entry: SL below $106,200
For bounce entry: SL below $105,200 or $104,800 (structure break)
📈 Risk–Reward Ratio:
Approx. 1:2.5 to 1:3+ depending on entry and target
🧠 Trade Management:
Move SL to breakeven after hitting TP1
Partial profit booking at TP1
Trail remaining with manual or dynamic SL (e.g., below EMA or recent low)
⚠️ Risk Notes:
Avoid chasing price without breakout confirmation
Watch for fakeouts and heavy selling near TP zones
Adjust position size based on your risk tolerance

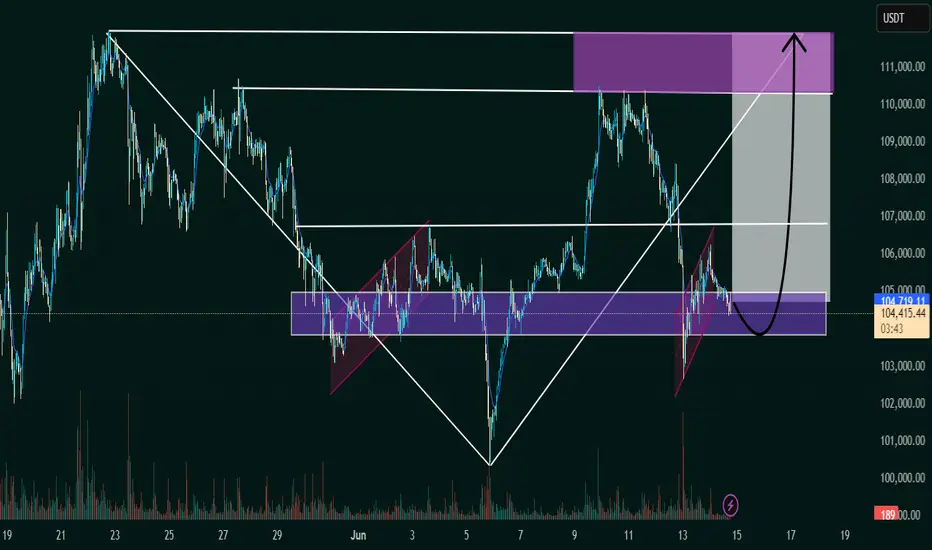
BTC/USDT Bullish Reversal Zone AnalysisSupport Zone:
The horizontal purple box (~104,000 USDT area) has acted as a strong support/resistance flip zone multiple times.
Falling Wedge Breakout:
The price action broke out of a falling wedge pattern earlier, confirming bullish momentum.
Flag Formation (Current):
A smaller bullish flag/pennant appears to be forming, and a breakout above could trigger a strong upward move.
Projected Move:
The black arrow indicates a potential bounce from this support zone, with the price targeting the 111,000–112,000 USDT zone (highlighted in the top purple box).
Volume Spike:
Notable volume spike near the bottom supports the idea of accumulation and possible reversal.
📈 Conclusion:
If the support zone holds and price breaks above the minor flag, a bullish continuation is likely toward the 111,000–112,000 resistance area. Traders should watch for confirmation of a breakout and volume increase for validation.
BTC/USD 4H Trade Setup – Demand Zone Reversal Play🔵 1. Demand Zone 🧲💎
📍 Range: 100,418.83 – 102,253.51
🟦 Strong support zone
💡 This is where buyers are expected to step in
📉 Price is currently testing this zone — potential reversal area
🚀 2. Entry Point 🎯
📍 Zone: 102,232.52 – 102,264.33
✅ Just above demand zone for safe entry
🧘♂️ Wait for bullish confirmation (wick rejections, engulfing candles)
🛑 3. Stop Loss 🔻
📍 Zone: 100,498.77 – 100,538.74
🔒 Below demand zone — protects you from false breakouts
⛔ Invalidates setup if price breaks below this level
🎯 4. Target Point 💰
📍 Target: 108,800.00
🧱 Major resistance zone
📈 Offers a solid Risk/Reward setup (approx. 1:4)
🪜 Possible take-profit scaling around 108,656.78 – 109,256.50
🔁 5. CHoCH – Change of Character 🔄
📍 Confirmed structural break above a lower high
🕵️♂️ Indicates shift from bearish to bullish
🔁 Needs confirmation with higher low near demand zone
📏 6. EMA 70 (Exponential Moving Average) 📉
📍 Level: 106,849.30
🔴 Price is currently below EMA = short-term bearish
🧗♂️ Reclaiming the EMA will strengthen the bullish bias
✅ Quick Summary with Emojis
📌 Plan:
🔵 Buy near: 102,250
🛑 Stop Loss: 100,500
🎯 Take Profit: 108,800
📊 Trend:
🔻 Bearish short-term (below EMA)
🔁 Potential reversal from demand zone
⚠️ Watch For:
🔍 Bullish confirmation at demand zone
🔄 Reclaim of EMA (106.8k)
🧱 Resistance near 108.8k

Bitcoin (BTC/USDT) 2-hour chart, focused on the buy side only!📊 Chart Overview
The chart shows BTC/USDT on the 2-hour timeframe, featuring clear levels of resistance, mini-resistance, and target zones. Let’s break down the buy idea:
🚀 Key Zones & Levels
💜 Resistance Zone (Purple Box):
Historical price ceiling.
Price dropped from this area several times.
🟦 Target Zone (Blue Line):
106,691 - 106,683 USDT.
Target for the next bullish move!
🟧 Mini Resistance (Yellow Box):
Around 102,000 USDT.
Acting as support (buy zone!) now.
💰 Buy Setup & Entry Area
✅ Buy Zone:
Just below 103,000 USDT, aligning with the mini resistance / support box (yellow).
✅ Entry Level:
Between 102,000 - 103,000 USDT.
Best if price consolidates or forms a reversal candle here.
🟢 Target:
First target: 106,000 USDT
Next major target: 106,683 - 106,691 USDT.
📉 Stop Loss:
Below 101,000 USDT for protection.
🎯 Trading Plan
1️⃣ Wait for a bullish reversal candlestick at the mini resistance box (~102,000 - 103,000 USDT).
2️⃣ Enter long (buy) position.
3️⃣ Target profit at 106,000 and 106,691 USDT.
4️⃣ Stop below 101,000 to manage risk.
⚡️ Summary
🟢 Buy: At mini resistance (~102,000 - 103,000).
🎯 Targets: 106,000 - 106,691.
❌ Stop: 101,000.
🚀 Let's ride the bullish wave! 💹📈🟢

BTCUSDT Trade Analysis📊 BTCUSDT Trade Analysis
Previous Move (Sell)
✅ Sell executed successfully – target reached (🎯).
📈 New Trade Setup (Buy)
💡 Current Plan:
Switching to buy now as the market has reached the previous sell target.
New Target:
Next major resistance area near 111,025 – 111,072 USDT range (🟩 target box at the top).
📍 Key Levels:
Entry Zone: Above 105,000 USDT mini-resistance area (🟧 mini-resistance box).
Support: Around 102,999 USDT (blue support line).
Current Target (Buy):
Target zone: 111,025 – 111,072 USDT.
📌 Trade Plan Summary
Entry: Above 105,000 mini-resistance area break.
Target Point: 111,025 – 111,072 USDT 🟩.
Stop Loss: Suggested below 102,999 USDT to limit downside (🔴 red zone).
🎯 Conclusion:
🔵 Target for the buy move is well-defined and positioned above current resistance levels.
🟢 Awaiting price action above mini-resistance area for a safe entry for the next bullish leg!

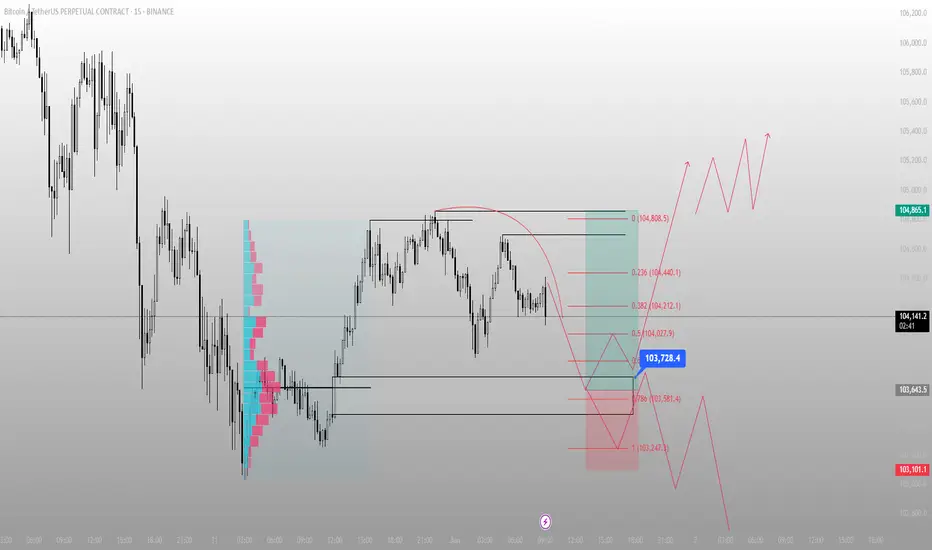
Price is coiling. But I already know where it wants to go.15-minute chart, but the logic is macro.
We just printed a double top above 104,800 — but Smart Money didn’t take that high for fun. That was a clean liquidity raid followed by immediate rejection. The reaction wasn’t retail panic. It was engineered.
What followed was a controlled pullback into a micro-dealing range. I’m expecting one more sweep — a stab into the 103,728.4 zone. Why?
Because that’s where the 0.5 retracement meets the upper bound of a low-volume node. If price wants to rebalance, it’ll do it there — not randomly in mid-air.
If price respects that level and prints bullish structure, I’ll step in. First objective? 104,865. That’s the true inefficiency gap above the raid high — and the last unfilled void in this leg.
Execution logic:
🔑 Anticipated long trigger: 103,728.4
🧠 Deep discount final bid: 103,581–103,247 sweep (last grab)
🎯 Immediate TP: 104,865
❌ Invalidation: Full body break below 103,101
I don’t need candles to line up perfectly.
I just need price to return to value.
I trade what price must do — not what it might do.
BTC/USD Technical OutlookTechnical Analysis Summary:
1. Support & Resistance Zones:
Support Zone: ~$102,600–$103,500
✅ Price recently tested and bounced from this zone, supported by the 200 EMA (blue line).
Resistance Zone: ~$110,500–$112,000
🔼 This is the next major target area for bulls.
Mid-level Supply: ~$106,500–$107,500
⚠️ Price may face short-term resistance here (near the 50 EMA in red).
🔄 Moving Averages:
200 EMA (blue) at $102,648: Acts as strong dynamic support. Price bounce reinforces bullish sentiment.
50 EMA (red) at $106,798: Currently acting as dynamic resistance. A breakout above it would strengthen bullish continuation.
🕯️ Candlestick Behavior:
Multiple rejection wicks from the support zone indicate buyer strength.
Recent candle shows a bullish reaction, potentially forming a reversal pattern.
📈 Price Projection (as per the chart path):
Short-term pullback may lead into the $106,500–$107,500 zone.
If bulls maintain momentum and break above, we can expect a push toward $111K–$112K resistance.
✅ Conclusion:
Bias: Bullish
Trigger: Confirmed bounce from support + price reclaiming 50 EMA
Invalidation: Break below $102,600 with high volume would invalidate the bullish scenario.

BTC/USD Rebound in Play! | Key Support Holding, Eyes on $112K 📊 BTC/USD Technical Analysis
🗓️ Chart Date: May 25, 2025
🔍 Key Levels:
🔵 Support Zone: $106,800 – $107,300
Notably, price bounced twice in this region, indicating strong buying interest.
This area aligns closely with the 200 EMA (currently at $107,213.51), adding further confluence as dynamic support.
🔴 Resistance Zone: $111,800 – $112,300
Previous highs and consolidation make this a significant area where sellers may re-enter the market.
📈 Indicators:
🔵 EMA 200 (Blue): $107,213.51
Acts as a strong dynamic support; price bounced off it recently.
🔴 EMA 50 (Red): $108,182.91
Price is currently below the 50 EMA, suggesting short-term bearish pressure remains until this level is reclaimed.
🧠 Market Structure & Price Action:
After a sharp drop from the resistance zone, price found solid footing at the support zone.
Recent candles show rejection wicks from the downside, hinting at potential bullish reversal.
A breakout above minor consolidation and 50 EMA could trigger a bullish continuation toward the resistance.
📌 Forecast:
✅ If the price holds above the support zone and breaks above $108,200, we can expect a bullish move toward $112,000.
⚠️ However, a failure to break above the 50 EMA could lead to a retest of the support zone.
🧭 Trade Idea (Not Financial Advice):
📥 Long Bias:
Entry: On confirmed breakout above $108,200
SL: Below $107,000
TP: $111,800 – $112,300
📌 Conclusion:
The chart setup suggests a potential bullish reversal 📈 from a key support zone, supported by EMA 200. Watch for a break above the 50 EMA for momentum confirmation.
🧠 Always confirm with volume and wait for confirmation before entering a position.

Bitcoin 4H Technical Analysis Bullish Continuation Toward $111kCurrent Price Context:
BTC/USD: $103,696.63
EMA (70): $96,211.07
Trend: Bullish 📈
---
Key Zones & Analysis:
1. RBR Zone (Demand Zone) 💙
Price Range: $95,435.39 – $97,986.81
This area is a bullish support zone where price previously consolidated before the breakout.
Potential entry/buy zone 📍
If price pulls back: Bounce expected here 🔁
🟦 RBR Zone:
🔵 97,986.81
🔵 96,211.07 (EMA support)
🔵 95,435.39
---
2. Resistance / Short-Term Supply 🟥
Small blue box above current price
May cause a minor rejection before a breakout
Keep an eye out for price action signals here 👀
🟥 Resistance:
🟥 ~103,700 – 105,000
---
3. Target Zone 🎯
Main Target Point: $111,415.32
Target Range: $111,281.04 – $112,959.60
If price breaks above resistance, this is the next major target
Take profit zone 💰
🎯 Target Area:
🔵 111,281.04
🔵 111,415.32
🔵 112,959.60
---
Possible Price Path:
1. 🔼 Break above current resistance
2. 🔁 Or pull back to RBR zone
3. 🎯 Final move toward target zone

(BTC/USD) 1H Trade Setup – Key Entry, Stop Loss & Dual TargetEntry Point: 95,431
Stop Loss: 95,264
Target Points:
Upside (Target 1): 100,674 (Potential gain: +5.36%)
Downside (Target 2): 86,614 (Potential loss: -7.57%)
Trade Setup:
Risk-Reward Ratio:
Approx. 1:0.7 (Not ideal; the reward is smaller than the potential loss)
Support Zones:
Highlighted in purple beneath the entry zone — this indicates a historically strong support area.
Resistance Zones:
The upper purple zone marks the next significant resistance around 100,000–100,795.
Technical Indicators:
50 EMA (Blue Line): Indicates mid-term trend support, currently holding price action.
Price Action: BTC appears to be retracing toward support after a bullish rally.
Interpretation:
The setup implies a long (buy) position with a very tight stop loss.
The price is nearing a support zone, and if it holds, there's potential for an upward move to the target at 100,674.
However, if price breaks below 95,264, a sharp drop to 86,614 is anticipated.

BTC/USD) bullish trend analysis Read The ChaptianSMC Trading point update
Technical(BTC/USDT) analysis outlines a bullish outlook with key technical levels and scenarios. Here's a breakdown of the idea:
Key Observations:
1. Trend Break and CHoCH (Change of Character):
The chart shows a clear break of the downtrend, confirmed by the CHoCH label — a common Smart Money Concept (SMC) signal indicating a potential trend reversal from bearish to bullish.
2. Key Zones Highlighted:
EVC-Buying Zone: Around 86,000 – 88,000 (aligned with EMA 200), marked as a strong accumulation area.
New Support Level: Around 92,000 – 93,000, potentially forming a bullish support after the recent rally.
Resistance Levels: Two major resistance zones near:
99,600 (intermediate resistance and target)
106,400 (final target)
3. RSI Indicator:
RSI is near 64, indicating strong momentum but not yet overbought — a potential sign of further upside.
4. Two Bullish Scenarios:
Scenario 1 (Aggressive Bullish): BTC continues upward from the current level and breaks above resistance toward the 106,447 target.
Scenario 2 (Retracement Bullish): BTC dips to the new support or even into the buying zone (86–88k), then rebounds to reach the same targets.
Mr SMC Trading point
---
Idea Summary:
The chart suggests bullish continuation, with potential pullbacks into strong demand zones. It supports both breakout and retracement entries, with targets at 99,632 and 106,447. If price holds above EMA 200 and RSI remains supportive, the upside thesis remains valid.
Pales support boost 🚀 analysis follow)

BTC/USD 4H Chart Setup – Bullish Breakout Targeting $104K1. Trend Direction
⬆️ Uptrend Detected
* Price is forming higher highs and higher lows
* Trading inside a bullish channel
* Breakout potential above the top trendline.
2. Key Zones
🟦 Support Zone: $95,252.31
* Labeled as RBS + RBR ZONE
* Strong buy area → previous resistance turned support
* Perfect area to catch a bounce
📏 Support Line & Trendline
* Trendline keeps price supported along the climb
* Acts as a launch pad for the next move.
3. EMA 70 (📉 Red Line)
* Current value: $93,636.88
* Price is above EMA, showing strong bullish pressure
* EMA acts as dynamic support.
4. Trade Setup
🎯 Target Point: $104,000
🟦 Target Zone: $103,918.60 – $104,747.91
🔥 Entry Zone: $95,252.31 (marked blue box)
⚠️ Stop Loss: $94,091.28
* Positioned safely below support
* Good Risk/Reward Ratio.
5. Extra Cues
📅 Economic event icons near May 3–6 → Potential volatility ahead
⚡ Pullback in progress → May offer a buying opportunity.
Conclusion
🚀 Bullish Setup!
* Watch for a bounce from the blue demand zone
* Targeting $104K breakout
* Strong support + momentum = solid long opportunity.

(BTC/USD)1H Chart Analysis–Bullish Breakout Setup Toward$98,000Technical Breakdown:
🔹 EMA 9
📉 Orange line (EMA 9 close): $93,233.68
➡️ Price is above EMA, showing bullish strength.
📦 RBR Zone (Rally-Base-Rally)
🔵 Zone: ~$92,000 - $93,000
🛡️ Acts as a support area — price could bounce here if it dips.
🚧 Resistance Zone
📍 Just above current price
📈 A breakout above this zone may trigger a bullish run.
🎯 Target Point: $98,000
🚀 Potential gain: +7.09%
📊 Strong upside target if breakout holds.
🛑 Stop Loss: $90,314.13
⚠️ Placed just below the RBR zone to minimize risk.
Trade Idea Summary:
🔽 Entry: On breakout above resistance
🎯 Target: $98,000
🛑 Stop Loss: $90,314.13
📈 R:R Ratio looks favorable

Bitcoin Trade Setup: Bullish Breakout Targeting $87K!🔹 Key Levels Identified:
📌 Target Point: 87,008.21 USD 🏁🔵
👉 Expected price move (+9.07%) 🚀
📌 Entry Point: 79,719.00 USD ✅
👉 Suggested buying level in demand zone 🏦
📌 Stop Loss: 78,213.25 USD ❌🔻
👉 Risk management level 📉
📊 Technical Analysis:
📈 Trendline Support:
🔵 The price bounced off the trendline 📊, confirming an uptrend 📈
🔵 Demand Zone:
🟦 Marked blue area = Buyer interest 📊
💰 Expected reversal zone if price retests
📊 Moving Average (DEMA 9):
🔸 82,343.85 USD (current level)
🔺 Price slightly below DEMA ➝ possible bullish reversal 🚀
⚡ Trade Setup:
✔️ Risk-to-Reward Ratio:
🟢 Potential profit: +7,220.76 USD
🔴 Risk: -1,500 USD
📊 Favorable trade setup with high reward vs low risk ✅
✔️ Momentum Confirmation:
🟢 Above 79,719 USD = 🚀 Bullish breakout
🔴 Below 78,213.25 USD = ❌ Stop Loss triggered
🔮 Conclusion:
🔥 Bullish setup if price holds demand zone!
🚀 Target: 87,008 USD
⚠️ Manage risk with stop loss! 📉

Bitcoin (BTC/USD) Long Trade Setup –with Target 88,573,60Current Price: $80,724.28
Entry Point: $80,671.23 (just above current price)
Stop Loss: $78,052.44
Target Point: $88,573.60
Resistance Point: $82,260.90
📈 Trend & Moving Averages
EMA 30 (red): $80,220.87 — Short-term trend.
EMA 200 (blue): $80,788.61 — Long-term trend.
The price is currently between the EMAs, indicating potential indecision or a shift in trend. A break above both EMAs with momentum would confirm bullish strength.
🔑 Trade Setup Summary
Element Level
Entry 80,671.23
Stop Loss 78,052.44
Target (TP) 88,573.60
Resistance 82,260.90
Risk-Reward ~1:2.7 (approx)
📊 Analysis & Expectations
Bullish Bias: The chart suggests a long trade with a breakout strategy.
Volume and momentum confirmation will be key above resistance.
Resistance at 82,260.90 may cause a brief pullback before continuation to the target.
The stop loss is well-placed below a support zone and the most recent swing low.
✅ What to Watch For
Break and close above EMA 200 and resistance at 82.2K.
Bullish volume increase on breakout.
Price action around the entry zone (wait for confirmation candle if unsure).

Bitcoin (BTC/USD) Technical Analysis – Bullish Setup🔵 Key Levels:
🎯 Target Point: 87,050.22 (🔼 Expected upward move)
🔵 Support Zone: 79,833.82 (🛡️ Strong demand area)
🔴 Current Price: 82,254.27
📊 Analysis:
🔵 RBS + RBR Zone (🔄 Role Reversal Support & Rally Base Rally) - Possible entry point for a long position.
🟠 Stop Loss: Below 79,833.82 (🚨 Risk Management)
🟣 Resistance Zone: Near 83,000 (🔄 Possible short-term pullback)
📈 Strategy:
1️⃣ Price might retrace to the blue zone (support) before continuing upward.
2️⃣ If it holds, 🚀 potential rally towards 87,050.22 🎯
3️⃣ If it breaks below support, ⚠️ possible downside risk.
✅ Conclusion:
A bullish setup with a 7.45% profit target 📊
Risk managed with a stop loss below support ⚠️

BTC/USD Bullish Breakout Setup – Targeting $85,477 with 5.62% UpThe price has recently surged above both the 30 EMA (red) and 200 EMA (blue), signaling a strong bullish move.
The EMAs are beginning to turn upward, particularly the 30 EMA, suggesting short-term bullish momentum.
Key Levels Identified
Entry Zone (Purple Support Zone):
Around $80,105 – a potential buy zone after a pullback.
Labeled with STOP LOSS, indicating the invalidation level if price drops below this zone.
Target Zone (Purple Resistance Zone):
Around $85,477 – this is the target level, marked as “EA TARGET POINT”.
Offers a potential move of +5.62% or 4,551.83 points.
Price Action
Price broke above a previous resistance (now support) and has pulled back slightly.
The projected move suggests a bullish continuation after a minor pullback and consolidation.
Risk-Reward
Good risk-reward ratio implied with the large gap between the stop loss and target.
Stop loss is tight, just below the purple support zone (~$80,105).
Projection
The blue lines and annotations suggest a bullish play, with an expected upward movement after retesting the support.
✅ Possible Trade Idea
Buy Zone: ~$80,105 (on a confirmed retest)
Stop Loss: Slightly below $80,105
Target: ~$85,477
Expected Move: +5.62%
🔍 Additional Notes
Keep an eye on price behavior around the support zone—confirmation (e.g., bullish candle pattern or rejection wick) strengthens the entry.
The strong move leading to the breakout suggests high momentum, which could mean limited pullback.
News or macro developments could invalidate technicals—be aware of external factors.

BTC/USD 1H Chart Analysis – Bearish Setup with SBR Rejection🔵 Key Zones & Levels:
🔷 SBR Zone (Support ➡ Resistance):
Price Range: ~$81,000–$83,000
🛑 Stop Loss: $83,002.31 (Just above resistance)
Expecting sellers to step in here if price retests this level
🟠 Mid-Range Zone:
Current price is consolidating just below SBR zone
Could form a lower high before dropping
🟦 Target Zone (Support Area):
🎯 Target Price: ~$75,000
Previous demand area – price bounced hard from here before
🔁 Trade Plan:
📉 Bias: Bearish
📍 Entry: Near current price or after retest of SBR zone
🛑 Stop Loss: $83,002.31
🎯 Target: $75,000 (approx -8.33%)
✅ Summary:
Risk-Reward: Appears solid (R:R > 2:1)
🕵️♂️ Watch for: Fakeouts or rejections in the SBR zone
🔻 Potential Move: -6,804 points if plan plays out

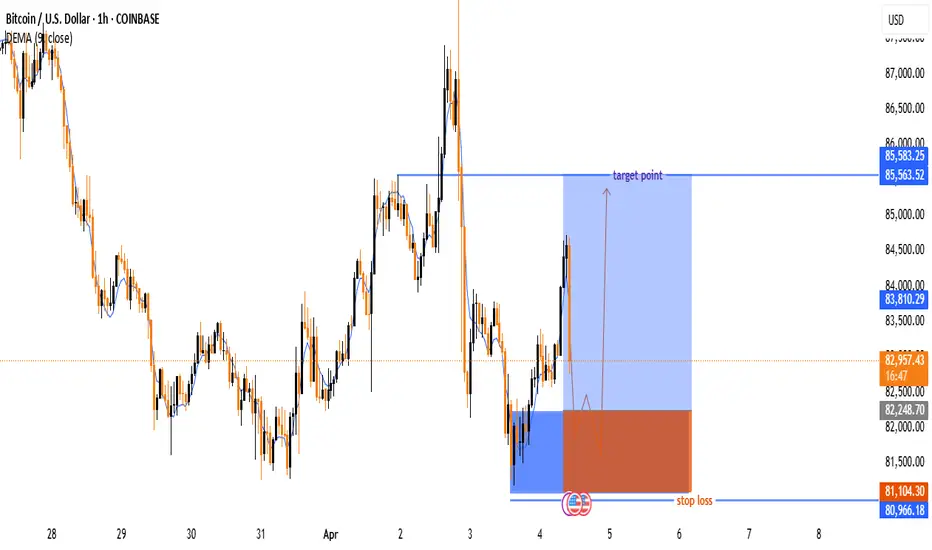
Bitcoin (BTC/USD) Trade Setup & Analysis🔹 Trend Analysis:
📉 The chart shows a downtrend followed by a reversal attempt.
📈 The price bounced off a support zone and is moving upwards.
🔹 Indicators:
📊 The 9-period DEMA (83,805.38) is slightly above the current price, acting as a resistance level.
🔹 Trade Setup:
🟢 Entry Zone: Around 82,943 (Current Price)
🔴 Stop-Loss: 81,183.22 ❌ (Below support level)
🎯 Target Point: 85,563.52 ✅ (Upper resistance level)
🔵 Strategy: The trade anticipates a price dip before
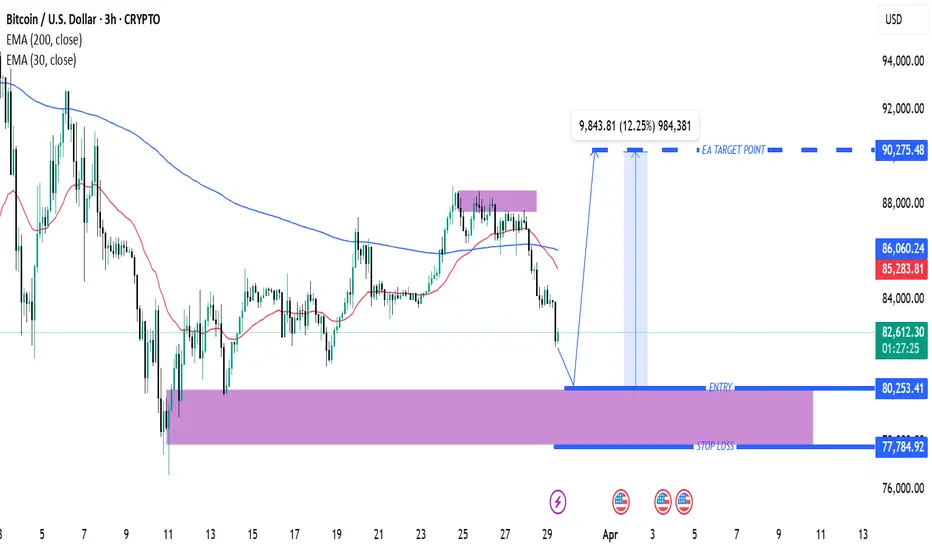
Bitcoin (BTC/USD) 3H Analysis: Key Support & Potential 12% UpsidSupport and Entry Zone (Purple Area at ~$80,253.41)
A significant support zone is marked in purple, indicating a potential area for entry.
This is an area where buying interest is expected.
Stop Loss (~$77,784.92)
A stop loss level is defined below the support zone, which is a risk management strategy.
Target Price (~$90,275.48)
The chart suggests a bullish move if the price bounces from the support.
The expected price increase is around 12.25% from the entry level.
Exponential Moving Averages (EMA)
30 EMA (Red Line, $85,290.12): Short-term trend indicator.
200 EMA (Blue Line, $86,061.21): Long-term trend indicator.
The price is currently below both EMAs, suggesting a bearish trend in the short term.
Market Outlook
The price has recently rejected resistance (purple zone above).
If it holds support at ~$80,253.41, a reversal to the upside is expected.
If the support breaks, further downside could follow.
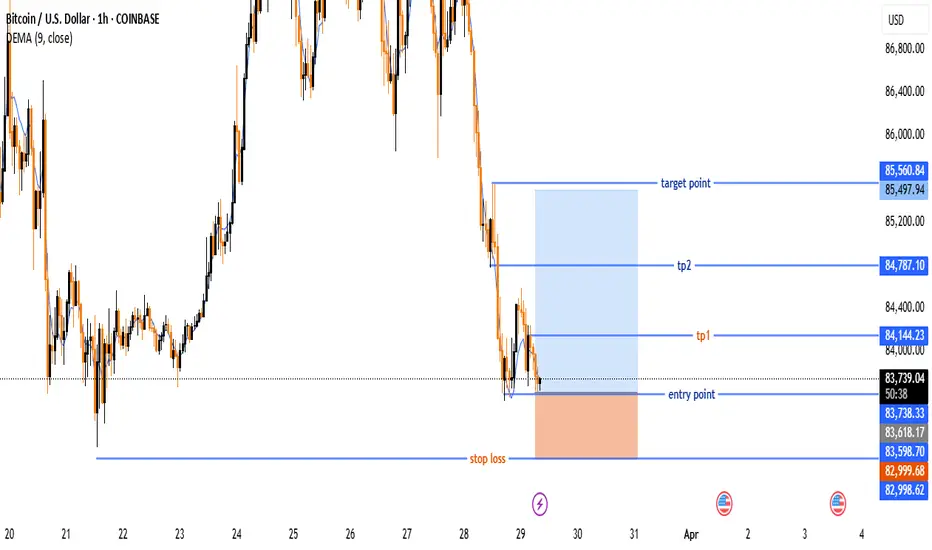
Bitcoin (BTC/USD) Trade Setup – Potential Reversal &Target Leves🔵 Entry Point:
🔹 Around $83,678.04 – The suggested buying zone.
🛑 Stop Loss:
🔻 $82,998.62 – The price level where the trade will be exited if it moves against the plan.
🎯 Target Points:
✅ TP1: $84,144.23 – First profit target.
✅ TP2: $84,787.10 – Second profit target.
🏆 Final Target: $85,560.84 – The ultimate goal for the trade.
📈 Technical Overview:
🔹 The price is at a support level, with a potential reversal to the upside.
🔹 Risk-Reward Ratio is favorable, with a clear uptrend target.
🔹 DEMA (9) at $83,776.52 indicates a possible trend shift.