Bitcoin Long-Term Monthly Chart: Parabolic Advance Meets DistribMacro Trend
Bitcoin is still in a long-term bullish structure. Each cycle shows higher highs and higher lows since inception.
The move from ~20k to ~90k happened in very few monthly candles, which signals a parabolic phase rather than healthy trend growth.
2. Current Candle Structure
The most recent candles show:
Large bullish impulse followed by
Strong rejection wicks and consecutive red monthly candles
This usually indicates profit-taking and distribution, not immediate trend continuation.
3. Volatility & Momentum
The current red candle (~-10%) after a blow-off green candle suggests:
Momentum is cooling
Buyers are no longer in full control
Historically, after similar structures (2013, 2017, 2021), BTC entered extended consolidation or deep pullbacks.
4. Volume Insight
Volume peaked during the explosive green candles and is now declining, which often means:
Smart money already positioned
Late buyers are absorbing supply
5. Key Levels to Watch
78k–80k: Current support (short-term)
60k–65k: Strong macro support (prior cycle top zone)
45k–50k: Extreme but historically reasonable retracement in bull cycles
6. Probable Scenarios
Base Case (Most Likely):
Sideways to downward consolidation over several months (range expansion).
Bull Continuation:
Needs a strong monthly close above prior highs with increasing volume.
Bearish Extension:
Loss of 60k opens the door for a deeper macro correction.
BTCUSDC


BTCUSD – Key Level Rejection with Potential Liquidity Sweep TowaChart Analysis
1. Price Context
BTCUSD is trading around $90,675.
The chart shows price rejecting the Key Level and failing to hold above the Daily CLS (daily close level).
Recent candles indicate loss of bullish momentum with a series of lower highs forming.
2. Key Zones on Your Chart
🔴 Daily CLS (Resistance)
Marked in red.
Price tried to break and hold above this level but rejected, showing it is acting as strong overhead resistance.
The shaded gray area above looks like the stop-loss zone for shorts, suggesting a bearish setup.
🟢 Key Level
Marked slightly below the Daily CLS.
Price broke above it earlier but is now retesting from the top, failing to reclaim.
This retest-rejection pattern signals a shift from bullish to bearish sentiment.
3. Trade Bias Indicated by the Chart
Your marked zone suggests a short position setup:
Entry around current price or just under the Key Level.
Stop-loss in the gray shaded box above the Daily CLS.
Take Profit 1 at 50% CLS TP1, a midpoint liquidity target.
Final TP near the green support at the bottom.
This structure reflects a liquidity-based short setup, expecting:
A sweep of local highs → rejection → push down to fill inefficiencies or revisit liquidity pools below.
4. Market Structure
Price printed a strong move up earlier, leaving inefficiency below.
Now forming lower highs and lower lows on the lower timeframe.
Hold below Key Level suggests continuation downward.
5. Bearish Confirmation Signals
✔ Failure to hold above Daily CLS
✔ Break of Key Level and retest as resistance
✔ Weak bullish follow-through
✔ Liquidity target below at 50% CLS

BTC Levels. Bull Case. 2026Look out for ATH after over 78k range in the long run.
The Red levels are mostly as SL in Bull case scenarios and the light ones are (confidence level colored) targets. Green are entry. If I can I'll update later.
Thank you.
You are encouraged to comment your opinions as well :)

BTC/USD Bullish Reversal Breakout Pattern BTC/USD Bullish Reversal Breakout Pattern 🚀
Technical Analysis:
🔹 Trend Reversal: The chart shows a clear inverse head and shoulders pattern highlighted with orange circles — a strong bullish reversal signal after a downtrend.
🔹 Breakout Zone: The neckline resistance around 108,000 USD has turned into support (marked as “SU00QT” due to a typo, assumed to be “SUPPORT”). Price action is consolidating just above this zone.
🔹 Trendline Support: The upward blue trendline confirms bullish structure, with price forming higher lows. Recent price action is bouncing off this trendline, showing strength.
🔹 Bullish Confirmation: Green arrows indicate strong bullish rejections from key levels, aligning with breakout retests.
🔹 Target Projection: The measured move from the inverse head and shoulders pattern projects a target towards the 114,000 USD resistance zone 📦 highlighted above, suggesting a potential 5-6% upside move 📊.
Conclusion: As long as price holds above the 108,000 support zone and the ascending trendline, BTC/USD remains bullish with potential continuation towards 114,000 USD. A breakout above minor consolidation could trigger a strong bullish rally 💥.
🛑 Invalidation: A sustained break below 106,000 USD would invalidate the bullish structure and may lead to further downside.

BTC/USD Potential Reversal & Bullish Breakout SetupBTC/USD Potential Reversal & Bullish Breakout Setup 🔄🚀
Technical Analysis Overview:
🔹 Pattern Formation:
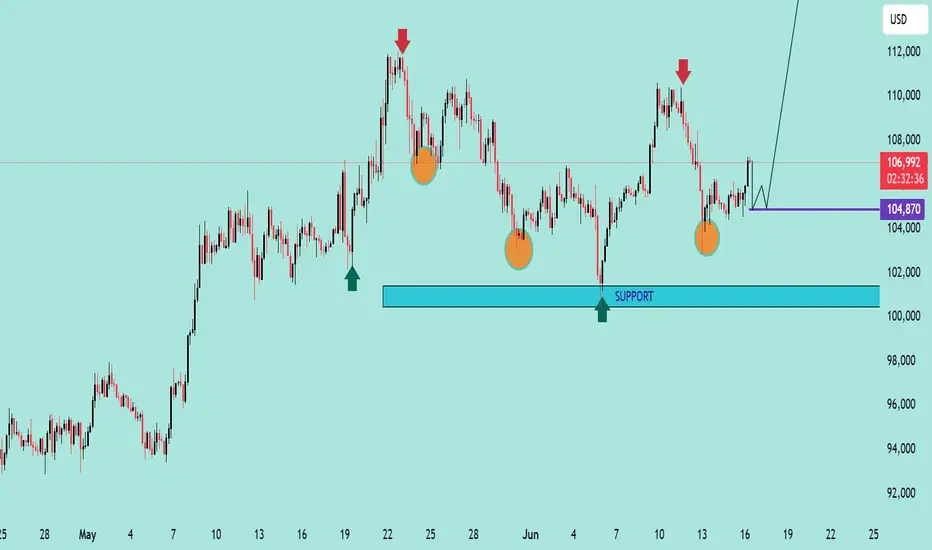
The chart displays a potential Triple Bottom pattern (🟠), a classic reversal signal forming at the $104,870–$100,000 support zone 🛡️. This structure suggests a strong base is being established for a potential upside move.
🔹 Support Zone:
📉 The price has consistently bounced off the major support area around $100,000–$104,870, indicating strong buying interest.
🔹 Resistance Zone:
📊 The key resistance level lies around the $114,000–$115,000 range 🔵, which has been tested multiple times in the past (🔴 arrows) and could act as a future profit target.
🔹 Price Action & Projection:
Currently, price is trading near $107,025 and is showing signs of bullish continuation after forming a higher low. If the price consolidates above the $104,870 zone and holds support, we could see a potential breakout targeting the $114,000 resistance 📈.
📌 Key Takeaways:
✅ Triple Bottom formation signals trend reversal.
🔄 Bullish structure confirmed above $104,870.
🎯 Next target: $114,000 if breakout holds.
⚠️ Watch for potential consolidation before continuation.
BTC/USD Rebound in Play! | Key Support Holding, Eyes on $112K 📊 BTC/USD Technical Analysis
🗓️ Chart Date: May 25, 2025
🔍 Key Levels:
🔵 Support Zone: $106,800 – $107,300
Notably, price bounced twice in this region, indicating strong buying interest.
This area aligns closely with the 200 EMA (currently at $107,213.51), adding further confluence as dynamic support.
🔴 Resistance Zone: $111,800 – $112,300
Previous highs and consolidation make this a significant area where sellers may re-enter the market.
📈 Indicators:
🔵 EMA 200 (Blue): $107,213.51
Acts as a strong dynamic support; price bounced off it recently.
🔴 EMA 50 (Red): $108,182.91
Price is currently below the 50 EMA, suggesting short-term bearish pressure remains until this level is reclaimed.
🧠 Market Structure & Price Action:
After a sharp drop from the resistance zone, price found solid footing at the support zone.
Recent candles show rejection wicks from the downside, hinting at potential bullish reversal.
A breakout above minor consolidation and 50 EMA could trigger a bullish continuation toward the resistance.
📌 Forecast:
✅ If the price holds above the support zone and breaks above $108,200, we can expect a bullish move toward $112,000.
⚠️ However, a failure to break above the 50 EMA could lead to a retest of the support zone.
🧭 Trade Idea (Not Financial Advice):
📥 Long Bias:
Entry: On confirmed breakout above $108,200
SL: Below $107,000
TP: $111,800 – $112,300
📌 Conclusion:
The chart setup suggests a potential bullish reversal 📈 from a key support zone, supported by EMA 200. Watch for a break above the 50 EMA for momentum confirmation.
🧠 Always confirm with volume and wait for confirmation before entering a position.

BTC/USD) Short Setup: Triple Top Formation Targeting 86,023 USD You’re seeing a potential Head and Shoulders structure (or at least a triple top) — with the orange circles marking failure to break higher around $95K.
The neckline (support) is slightly diagonal down toward the $94K region.
A breakdown is anticipated once the neckline fails.
2. EMAs Interaction:
30 EMA (red) is currently flattening, showing weakening momentum.
200 EMA (blue) is far below, around 88,181 USD, acting as a major support zone — and it aligns with the projected EA TARGET POINT.
EMA compression usually precedes a strong move.
3. Zones and Key Price Levels:
Entry Point: ~95,145.60 USD → high-probability short sell.
Stop Loss: ~96,000–96,957 USD → protects against unexpected breakout.
Target: ~86,023 USD → aligns with past accumulation zone and EMA200.
4. Risk/Reward Ratio:
Potential reward is about 9–10%.
Risk (from entry to stop) is about 1–2%.
Excellent Risk/Reward (>4:1).
5. Momentum and Volume (implied, not shown):
Given the topping pattern and lack of higher highs, buying momentum is weakening.
If volume increases on a breakdown, confirmation will be strong.
📊 Strategic Points:
Aspect Analysis
Trend Still bullish, but topping signs visible
EMA Behavior Short-term EMA flattening, long-term EMA rising slowly
Pattern Formed Triple Top / Head and Shoulders
Risk/Reward Very good (>4:1)
Recommendation Short bias around entry level, with strict stop-loss
⚡ Quick Trading Plan:
Entry: Short at ~$95,145
Stop Loss: ~$96,000–96,957
Target: ~$86,023

Bitcoin (BTC/USD) 2H Analysis: Potential Bullish Continuation or30 EMA (Red, 86,440): Indicates short-term momentum.
200 EMA (Blue, 85,153): Represents long-term trend support.
Support and Resistance Zones
Support Zone (Purple Box - ~86,271 to 85,153): Price is likely to bounce from here.
Resistance Zone (~87,149 and above): Breakout above this could push price higher.
Trade Setup
Entry Consideration: The price is currently testing a demand zone (purple) after a pullback.
Target (Take Profit - 90,118): Expecting a bullish move.
Stop Loss (~86,658 or lower): To manage risk.
Potential Price Action
If Bitcoin holds above the purple demand zone and 30 EMA, it could rally to 90,118.
A breakdown below 86,271 could push it toward 84,366 or lower.
Conclusion
Bullish Bias: If price holds above the support level.
Bearish Risk: If it breaks below the purple zone.
Recommendation: Monitor support at 86,271 and 85,153, as a bounce from these areas could confirm an uptrend.

**Scenario for BTC**1️⃣ **Fundamental analysis:**
📊 Nonfarm data last weekend was good for the USD and impacted the interest rate cut policy. It is likely that we will have to wait until June for the next interest rate cut.
📉 Current market sentiment is affected by this information, plus the recent sharp increase in BTC price has made many people doubt the momentum to continue to increase to a higher price range. Therefore, the increase has temporarily slowed down.
2️⃣ **Technical analysis:**
🔹 **Week frame:** Last week closed not very optimistically when the price reacted badly at the resistance zone of 101k~104k.
🔹 **Frame D:** The price structure is also not good when there are 2 peaks with the latter peak lower than the previous peak. The price is approaching the support zone but there is no clear reaction, it is likely to adjust to a lower support zone.
🔹 **H4 frame:** Based on the Zigzag line, we can see the classic head-and-shoulders pattern. At this time, we should not catch the bottom when the price has created a lower peak, showing that the market sentiment is no longer interested in the possibility of BTC's price increase.
3️⃣ **Trading plan:**
✅ If you have a **SELL** order in a good position, congratulations! 🎉 You can absolutely wait for a better profit when BTC is likely to break the current support zone to reach the next support zone of 85~86xxx.
⛔ **Absolutely do not BUY** at the present time, when the price structure shows a short-term downtrend.
💪 **Wish you successful trading!** 🚀

BTC All time high new target revealedHello Friends as you know I'm following and writing good articles on BTC While I am also doing my btc live trading.
So I just found btc short term target with good probability if click as planned using cup and handle pattern.
As this is just my only personal view.
You can trade according to your money management and also with proper risk reward.
To learn more stay tune follow me subscribe and comment your opinion.
Lets discuss traders.

"BTCUSD Sell Setup: Precise Entry with Multiple Target Levels"This is a selling trade with the entry at 67,597.76, marked in white on the chart. The yellow levels below represent your target points:
First Target: 67,261.29
Second Target: 66,972.07
Final Target: 66,653.81

BTC's Epic Move! This BTC trade, which I shared with you on October 26, didn’t show much movement initially. But yesterday, BTC finally took off and has given over 1.4k+ points in profit so far! 🎯🔥
If you've booked your profits, that's awesome! 👏 Due to TradingView's new update, the post option wasn’t visible on mobile, so I couldn’t give you timely updates.
To everyone who took this trade, share your profits and let me know how you found this setup! Let’s see some epic comments! 🚀📈

BTCUSD/BITCOIN DAY BUY PROJECTION 16.10.24Reason for Bitcoin Bullish
As a result, BTCUSD is the most popular crypto-to-fiat pair, and it serves as the de facto gold standard for the cryptocurrency market; providing the price direction cue for virtually the entire crypto market. In the BTCUSD pair, Bitcoin is the base currency, while the US dollar is the quote currency.

BTC LONG SETUP BTC is likely to give some relief rally in short term. Targets are 63800, 65400, 66000.
Stoploss should be 59600.

BTC BEARISH IDEABTC has entered in bearish zone again after ethereum etf went live on US market, BTC may visit 60k zone in few days. Trade carefully.

BITCOIN SETUP TRADE WIH 1:5 RISK REWARDBITCOIN SETUP TRADE WIH 1:5 RISK REWARD
A good selling setup detected on BTCUSD
It's showing a BULL MOVE due to these reason
1. It's following THE 60 M trendline here
2. It's ready to break the neckline
3. In day chat it's showing the heavy bullish pressure
Just grab out will your own risk
With a small amount
Stay connected
Stay happy
Bande mataram
BITCOIN SETUP TRADE WIH 1:5 RISK REWARD
A good selling setup detected on BTCUSD
It's showing a BULL MOVE due to these reason
1. It's following THE 60 M trendline here
2. It's ready to break the neckline
3. In day chat it's showing the heavy bullish pressure
Just grab out will your own risk
With a small amount
Stay connected
Stay happy
Bande mataram

BITCOIN SETUP TRADE WIH 1:5 RISK REWARD FALL TILL 52500.BITCOIN SETUP TRADE WIH 1:5 RISK REWARD
A good selling setup detected on BTCUSD
It's showing a BEAR MOVE due to these reason
there is so support beetween these
two lable so it will easily fall
till 52000 lable
1. It's BREAKING THE SUPPORT LABLE HERE
2. It's ready to break the neckline
3. In day chat it's showing the heavy bearish pressure
Just grab out will your own risk
With a small amount
Stay connected
Stay happy
Bande mataram
A good selling setup detected on BTCUSD
It's showing a BEAR MOVE due to these reason
1. It's BREAKING THE SUPPORT LABLE HERE
2. It's ready to break the neckline
3. In day chat it's showing the heavy bearish pressure
Just grab out will your own risk
there is so support beetween these
two lable so it will easily fall
till 52000 lable
With a small amount
Stay connected
Stay happy
Bande mataram

BITCOIN SETUP TRADE WIH 1:5 RISK REWARDBITCOIN SETUP TRADE WIH 1:5 RISK REWARD
A good Buying detected on BTCUSD
It's showing a BULL MOVE due to these reason
1. It's following THE 60 M trendline here
2. It's ready to break the neckline
3. In day chat it's showing the heavy bullish pressure
Just grab out will your own risk
With a small amount
Stay connected
Stay happy
Bande mataram
BITCOIN SETUP TRADE WIH 1:5 RISK REWARD
A good Buying detected on BTCUSD
It's showing a BULL MOVE due to these reason
1. It's following THE 60 M trendline here
2. It's ready to break the neckline
3. In day chat it's showing the heavy bullish pressure
Just grab out will your own risk
With a small amount
Stay connected
Stay happy
Bande mataram

BITCOIN LONG IDEABTC seems to go for long to take liquidity,
Entry 63500 - 64000
Targets 67000, 70000, 73000
Stop 62500

BITCOIN PRICE ANALYSIS Bitcoin, the maiden cryptocurrency, is hanging and swinging in level from 62k to 72k for more than 50 days. The geopolitical tension has made steep decline in entire crypto market. Currently there is no clear sign of any direction, viz. Up or Down. So it is better to wait and then take any decision for trade in BTC.
ALTS can be traded according to effect of BTC & its dominance in lower time frame.

BTC will return back to 70k in upcoming 2 - 3 daysBTC is ready to flip as halving is nearing, BTC will again shock by liquidating shorts in upcoming days. Hold on spots or low Leveraged longs are expected by the traders.
