$BTC Daily Update$BTC Testing $20,338 resistance area, last 4h close with bearish pin bar, current support at $19,894. Needs to close today's daily above $20,338 to avoid bearish pin on daily.
Btcusdlong


BTC DAY TRADING | TRADE#15BTC is holding above this support right now market is pretty unstable, trade carefully, hitting stoploss is most probable case so trade accordingly,
We have 2 TP in this case so use those according to your risks
DYOR

Btc More Crash Soon in 4hrs time frame we can see a Adam – Eve pattern so we can expect a retest and crash again

BTC Day Trading | Trade#13BTC long entry zone, Use stoploss mandatory
take entry carefully, market is unstable

BTC Day Trading | Trade#11Long BTC in this level its maintaining the support, thats a good buying zone, and maintain stoploss

BTC Day Trading | Trade#8This is a 30Day trading challenge in which I'm gonna perform series of trades

BTC Day Trading | Trade#6In this series we are going to trade a series of trades to see the result and at the end I'm going to share the results to stay tuned

BTC Day Trading | Trade#5In this series we are going to test our strategy on a series of trades to see the results

$BTC Daily update$BTC $20,338 support came in effect breaking $20,812, 1D close with bearish pin bar. Last 4H close with bullish doji. Expecting range of $20,338-$20,812 here for today.


$BTC Daily update$BTC #BTC Broke $21,299 with reattempt at $21,791 which resisted and held strong. 2 Attempts in last 6 days to break $21,791, 1W time-frame seems to be settling down slowly from the bearish turn. Continue watching $20,812 support which remains key for now.

What 1-hour chart says?
Fundamental Development:-
'Brutal and unrelentingly hard': Singapore regulator's clampdown on crypto
Singapore’s financial regulator and central bank has pledged to be “brutal and unrelentingly hard” on any “bad behavior” from the cryptocurrency industry.The comments come from Monetary Authority of Singapore (MAS)’s chief fintech officer Sopnendu Mohanty, explaining in an interview that “if somebody has done a bad thing, we are brutal and unrelentingly hard.”He also hit back at the rhetoric of certain crypto market participants who have criticized the regulator for not being friendly enough to crypto, and instead questioned the legitimacy of the market, saying:.
Short Term Technical View: On daily time frame BTC is trading below 200&50 simple moving averages and trading between $20,800-$21,100 ranges.BTC is made low 19,700 and now consolidating within a range. Yesterday it made high near $21,200 and then it continue to decline from 200 simple moving averages. Bitcoin is struggling to gain momentum above $21,300.
Alternative Scenario: If Bitcoin fails to clear the $21,300 resistance zone, it could start another decline. An immediate support on the downside is near the $19,700 level.
What 1-hour chart says?
Fundamental Development:-
China warns Bitcoin is heading to zero but BoE looks on the bright side
The Chinese government has capitalized on the violent downturn in the crypto market by warning crypto investors that Bitcoin prices are “heading to zero.” The South China Morning Post reported on June 22 that Chinese national news media agency Economic Daily had issued the warning about the largest cryptocurrency by market cap to further dissuade citizens from adopting the use of crypto. The Economic Daily report says the west is to blame for creating a highly-leveraged market that is “full of manipulation and pseudo-technology concepts” which it said was an “important external factor” which contributes to Bitcoin’s volatility..
Short Term Technical View:-
Bitcoin is trading below 200& 50 simple moving average. The price is now above the $20,000 level. Bitcoin price failed to gain pace above $21,500 and corrected gains. However, the bulls were active above the $20,000 and $19,300 support levels. An immediate resistance on the upside is near the $21,550 level..
Alternative Scenario: If Bitcoin fails to clear the $21,550 resistance zone, it could start another decline. An immediate support on the downside is near the $19,level.

What 1-hour chart says?
Fundamental Development:-
Central Bank of Jamaica Warns About Bitcoin and Defends Its CBDC
crypto winter that has evaporated most of the value of cryptocurrencies, central banks and governments from almost all over the world that have CBDCs or work on the development of state digital currency projects, are warning about the risks of using and investing in private virtual money. The Central Bank of Jamaica (BOJ) has joined that choir led by the International Monetary Fund (IMF), which seeks to discourage the trade of cryptocurrencies and other digital assets among its population. Instead, issuers are encouraging the use of central bank digital currencies, which they see as safer and more secure. The governor of the financial entity, Richard Byles, warned Jamaicans about the volatility of the price of Bitcoin (BTC) and other cryptocurrencies during the Jamaican Diaspora Conference held last week, where the issue of digital assets was addressed.
Short Term Technical View: On daily time frame BTC is trading below 200&50 simple moving averages and trading between $19,000-$20,000 ranges. BTC is made low 20,233 and now consolidating within a range. Yesterday it made high near $20,693 and then it continue to declin from 200 simple moving averages. Bitcoin is struggling to gain momentum above $21,700.
Alternative Scenario: If Bitcoin fails to clear the $21,700 resistance zone, it could start another decline. An immediate support on the downside is near the $18,000 level.

$BTC Daily update$BTC Given range remains in effect with $20,812 resistance holding. $19,894 showing some good support for last few hours, Last 1D candle closed with Doji could prove as confirmation to 1D bullish engulfing from 19 June. Good chance to break $20,812 here, Continue watching given resistance and support areas on the chart.

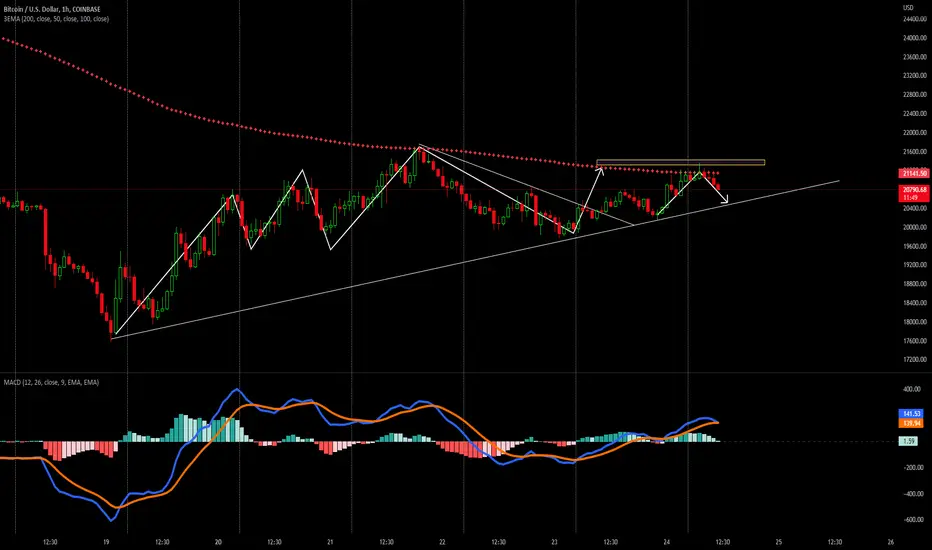
BTCUSDT pullback(exhaustion) or beginning of an uptrend with ATHReasons to short BTCUSDT -->
1) Downtrend's pullback, build up of bearish flag pattern
2) Multiple resistance to clear
3) bounce from resistance with no clear signs of follow up buying
Reasons to long BTCUSDT -->
1) Price showed bounce from support with morning star doji in 4H timeframe
if you are willing to short wait for confirmations like:
--> candle close below support + bearish candlestick patterns + follow up selling
if you are willing to long wait for:
--> candle closing above black trendline with multiple confirmations
take profits are in the chart for both positions
(Do your own analysis)
(NOT A financial advice)
(High chances of loss if you follow my idea)

$BTC Daily updateLast Friday Warned you about the possible drop that happened Saturday, $BTC Tested and broke $19,535 last Saturday, Given key support $17,999 tested and held. $20,812 resistance in effect with support at $19,535 currently. Last 1D close with bullish engulfing and 4H close with bearish engulfing expecting it to range $20,812-$19,003 today.

What 1-hour chart says? Fundamental Development:- 126% return for stock market short-sellers who smelled blood in crypto waters
Short-sellers have made a killing on various sectors of the U.S. stock market this year, but no other sector "held a candle” to the block chain industry, with crypto company short-sellers profits up 126% in 2022, according new data., technology and data analytics firm S3 Partners published a video summarizing its recent report, which found that overall, U.S. equity short-sellers are up on average more than 30% for the year.
Short Term Technical View: On daily time frame BTC is trading below 200&50 simple moving averages and trading between $21,000-$20,200 ranges.BTC is made low 20,180 and now consolidating within a range. Yesterday it made high near $22,950 and then it continue to decline. Bitcoin is struggling to gain momentum above $21,000
Alternative Scenario: If Bitcoin fails to clear the $21,000 resistance zone, it could start another decline. An immediate support on the downside is near the $20,200 level.
$BTC Daily update$BTC Given $19,894 support held, $19,894-$19,535 support area remains in effect here. $23,197 acting initial resistance as expected. Possible sideways range forming $19,894-$23,197. $21,299 current support. Gave your $19,894-$19,535 support area to watch over a month ago on May 10th😎.

ETHUSD LONG POSITIONHello traders,
Here in ETHUSD prices are now almost at it's support lvl around 800-1000 USD here we can enter for the short term entry with target of 1500-2000$. from the technical analysis it near at 200 DMA which is strong support zone for ethusd @800-1000 USD.
Enter in the trade after today's fed interest rate declared at 23:30 IST.
BUY ETHUSD @800-1000 USD
TARGET 1=> 1300
2=> 1500
3=> 1800
4=> 2000
5=> 3500-4000 USD
SL:- THERE IS NO STOPLOSS IN THIS TRADE AS ETHERIUM IS TRADING AT IT'S LOWEST LVL SINCE 2020 ONLY TAKE THIS TRADE WHO HAVE PATIENCE TO WAIT THIS IS 100% CHANCE OF PRICE REBOUND AS IT'S OLD CRYPTO CURRENCY SAME SCENARIO IN BTCUSD FOR BTCUSD BUY PRICE IS AT 18000-20000 USD AND CAN BE HOLD TILL 30000-50000 USD IN SHORT TERM WITH IN 3-6 MONTHS. Wish you best of luck follow for more updates 😘 Happy investing & successful trading to all.

What 1-hour chart says?
Fundamental Development:- Cryptocurrency lending firm Celsius Network will pause withdrawals and transfers between accounts due to "extreme market conditions", the company said on Monday, in the latest sign of pressure in the crypto industry.Bitcoin extended earlier declines after Celsius's announcement, falling more than 6% to as low as $24,888, an 18-month low. Ether, the world's second-largest cryptocurrency, dropped more than 8% to $1,303, its lowest since March 2021."We are taking this necessary action . in order to stabilize liquidity and operations while we take steps to preserve and protect assets. ."Furthermore, customers will continue to accrue rewards during the pause in line with our commitment to our customers."Celsius Network, which raised $750 million in funding late last year, is a significant player in crypto lending. It offers interest-bearing products to customers who deposit their cryptocurrencies with the company.
Short Term Technical View: On daily time frame BTC is trading below 200&50 simple moving averages and trading between $25,200-$25,900 ranges. MACD indicator also indicating negative biased for BTCUSD. BTC is made low 24,900 and now consolidating within a range. Yesterday it made high near $28,500 and then it continue to declined. Bitcoin is struggling to gain momentum above $28,300 .
Alternative Scenario: If Bitcoin fails to clear the $26700 resistance zone, it could start another decline. An immediate support on the downside is near the $25,000 level.

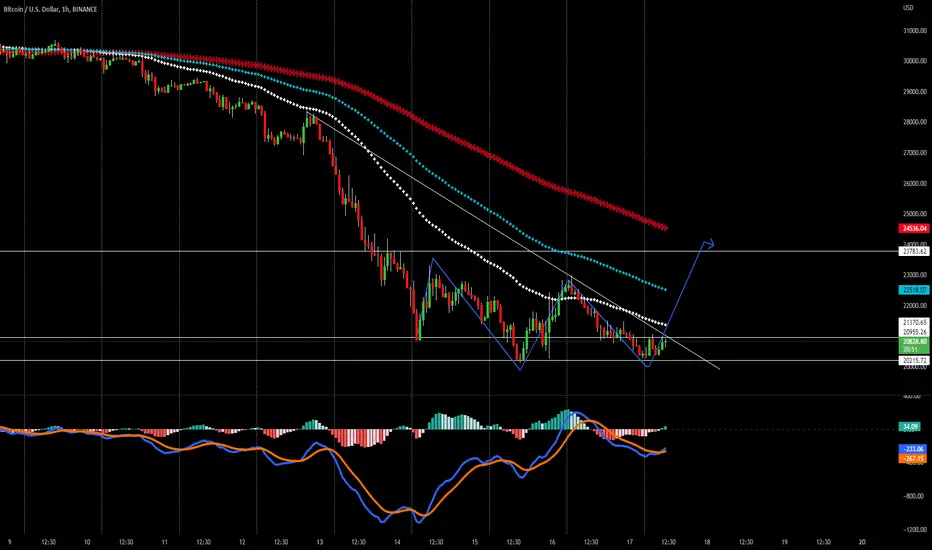
BTCUSD Trading Plan - 12/Jun/2022Hello Traders,
Hope you all are doing good!!
I expect BTCUSD to go UP if it corrects here.
Look for your BUY setups.
*This BUY is risky and I am biased only for short term upside, if you dont know how to manage your trade, dont take the risk now and wait for it to break the last low for HPB.
Please follow me and like if you agree or this idea helps you out in your trading plan.
Disclaimer: This is just an idea. Please do your own analysis before opening a position. Always use SL & proper risk management.
Market can evolve anytime, hence, always do your analysis and learn trade management before following any idea
