Bitcoin (BTC/USD) Long Trade Setup –with Target 88,573,60Current Price: $80,724.28
Entry Point: $80,671.23 (just above current price)
Stop Loss: $78,052.44
Target Point: $88,573.60
Resistance Point: $82,260.90
📈 Trend & Moving Averages
EMA 30 (red): $80,220.87 — Short-term trend.
EMA 200 (blue): $80,788.61 — Long-term trend.
The price is currently between the EMAs, indicating potential indecision or a shift in trend. A break above both EMAs with momentum would confirm bullish strength.
🔑 Trade Setup Summary
Element Level
Entry 80,671.23
Stop Loss 78,052.44
Target (TP) 88,573.60
Resistance 82,260.90
Risk-Reward ~1:2.7 (approx)
📊 Analysis & Expectations
Bullish Bias: The chart suggests a long trade with a breakout strategy.
Volume and momentum confirmation will be key above resistance.
Resistance at 82,260.90 may cause a brief pullback before continuation to the target.
The stop loss is well-placed below a support zone and the most recent swing low.
✅ What to Watch For
Break and close above EMA 200 and resistance at 82.2K.
Bullish volume increase on breakout.
Price action around the entry zone (wait for confirmation candle if unsure).
Btcusdsignals

BTC/USD Bullish Breakout Setup – Targeting $85,477 with 5.62% UpThe price has recently surged above both the 30 EMA (red) and 200 EMA (blue), signaling a strong bullish move.
The EMAs are beginning to turn upward, particularly the 30 EMA, suggesting short-term bullish momentum.
Key Levels Identified
Entry Zone (Purple Support Zone):
Around $80,105 – a potential buy zone after a pullback.
Labeled with STOP LOSS, indicating the invalidation level if price drops below this zone.
Target Zone (Purple Resistance Zone):
Around $85,477 – this is the target level, marked as “EA TARGET POINT”.
Offers a potential move of +5.62% or 4,551.83 points.
Price Action
Price broke above a previous resistance (now support) and has pulled back slightly.
The projected move suggests a bullish continuation after a minor pullback and consolidation.
Risk-Reward
Good risk-reward ratio implied with the large gap between the stop loss and target.
Stop loss is tight, just below the purple support zone (~$80,105).
Projection
The blue lines and annotations suggest a bullish play, with an expected upward movement after retesting the support.
✅ Possible Trade Idea
Buy Zone: ~$80,105 (on a confirmed retest)
Stop Loss: Slightly below $80,105
Target: ~$85,477
Expected Move: +5.62%
🔍 Additional Notes
Keep an eye on price behavior around the support zone—confirmation (e.g., bullish candle pattern or rejection wick) strengthens the entry.
The strong move leading to the breakout suggests high momentum, which could mean limited pullback.
News or macro developments could invalidate technicals—be aware of external factors.

BTC/USD) Bullish reversal analysis Read The ChaptianSMC Trading point update
This is a bullish reversal analysis on BTC/USD (Bitcoin to USD) on the 4-hour chart, suggesting a potential long opportunity after a sharp corrective move.
---
Key Breakdown of the Chart:
1. Strong Downward Move with Potential Reversal:
Bitcoin experienced a sharp drop from the 88k region to ~74,387.50, now hitting a key demand zone (marked as "Orderblock").
2. Bullish Reaction Expected:
From the Orderblock support zone, a bullish reversal is anticipated.
The projected move aims to fill the imbalance and test the target zone between 87,152.94 and 88,557.14.
3. RSI Oversold:
RSI is around 32.27, indicating oversold conditions and adding confluence for a potential bounce.
4. EMA (200):
The 200 EMA lies around 85,153.85, which may act as dynamic resistance on the way up.
Mr SMC Trading point
5. Price Target:
The expected upside move is approximately +13,722.85 points (+18.75%), aiming for the supply zone above 87k.
---
Conclusion / Trade Idea:
Entry Zone: Near 74,387.50, the orderblock/demand area.
Target Zone: 87,152.94 – 88,557.14
Bias: Bullish short- to mid-term reversal.
Confluences: Oversold RSI, clean support zone, potential trendline bounce, and price inefficiency above.
---
Pales support boost 🚀 analysis follow)

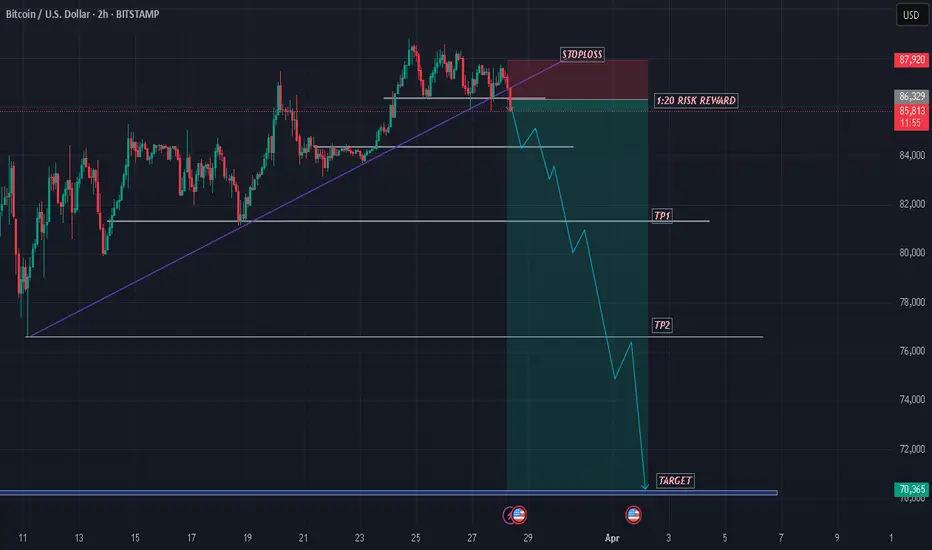
Bullish Reversal Trade Setup for BTC/USD – 4H Chart AnalysisZone: Around 76,094 USD
This zone aligns with a demand/support area, highlighted by the purple rectangle.
Price has sharply dropped into this zone, suggesting a potential reversal or bounce opportunity.
⛔ Stop Loss
Level: Around 73,312 USD
Placed below the support zone to allow some volatility wiggle room.
A break below this could invalidate the bullish setup.
🎯 Target Point (Take Profit)
Level: 87,271 USD
Risk-to-reward ratio is approximately 1:3+, offering solid trade potential.
This level corresponds to a previously established resistance zone or supply area.
📊 Indicators
EMA 50 (red): ~82,106 USD
EMA 200 (blue): ~85,250 USD
Current price is below both EMAs, suggesting short-term bearish momentum, but this setup banks on a mean reversion or swing back up.
📈 Trade Idea Summary
Parameter Value
Entry 76,094 USD
Stop Loss 73,312 USD
Take Profit 87,271 USD
Risk/Reward ~1:3
Setup Type Bullish Reversal
🧠 Extra Notes
Wait for confirmation (candle reversal pattern) in the demand zone before entering.
Be cautious of fake-outs or breakdowns below support, especially with broader market weakness.

BTCUSD SHOWING A GOOD DOWN MOVE WITH 1:10 RISK REWARD BTCUSD SHOWING A GOOD DOWN MOVE WITH 1:5 RISK REWARD
DUE TO THESE REASON
A. its following a rectangle pattern that stocked the market
which preventing the market to move any one direction now it trying to break the strong resistant lable
B. after the break of this rectangle it will boost the market potential for break
C. also its resisting from a strong neckline the neckline also got weeker ald the price is ready to break in the outer region
all of these reason are indicating the same thing its ready for breakout BREAKOUT trading are follws good risk reward
please dont use more than one percentage of your capitalfollow risk reward and tradeing rules
that will help you to to become a bettertrader
thank you

BTCUSD READY TO FLY 1450 POINTS UPSIDE POSSIBLEBTCUSD strong zone above only 82940
There is no resistance upto 84400...
wait for active zone
Buy above 82940
Stoploss 82700...........240 points
Target1.............83200.....260 points
Target2..............83400.....460 points
Target3.... Risk...84400.......1460 points
Disclaimer - This level only for education and papertrade purpose. Do ur own analysis

Bitcoin (BTC/USD) Technical Analysis: Breakout or Rejection at K200 EMA (Blue Line): 84,124 – This is a long-term trend indicator.
30 EMA (Red Line): 83,925 – A short-term trend indicator.
Key Levels
Resistance Point: Around 83,925 (marked in blue).
Support Zone: Around 82,184 (Stop Loss zone).
Target Point: 88,197, indicating a potential 6.34% upside.
Potential Trade Setup
Scenario 1 (Bullish Case):
If price breaks above resistance (83,925) and EMA 200, then a move towards 88,197 is expected.
A breakout confirmation might lead to an uptrend continuation.
Scenario 2 (Bearish Case):
If price rejects at resistance (83,925) and falls back below the support zone (82,184), a downward move could happen.
Pattern Analysis:
The chart suggests a potential accumulation phase before a breakout.
Possible retest of resistance before a rally.
Conclusion
Bullish above 83,925, targeting 88,197.
Bearish below 82,184, with potential downside.
Price action near the 200 EMA is crucial for the next move.

Bitcoin (BTC/USD) Short Trade Setup: Resistance Rejection & TargThis chart is a Bitcoin (BTC/USD) 15-minute price chart from TradingView, showing a potential short trade setup based on technical analysis. Here’s a breakdown of the key elements:
1. Resistance Zone & Short Setup
The purple highlighted area represents a resistance level around $85,358.
Price is consolidating within this resistance zone, suggesting a potential reversal.
The expected scenario involves a price rejection from this resistance, leading to a downward move.
2. Moving Averages
EMA (200, blue line) at $83,433: A long-term trend indicator suggesting a strong support zone.
EMA (30, red line) at $84,657: A short-term trend indicator, currently above the price, indicating a potential bearish setup if the price moves below it.
3. Target & Stop-Loss Le

BTCUSD READY TO FLY 1400 POINTS ..ONESIDE UP CHANCE Btcusd strong zone above 82400
strong above 82400 there is no resistance upto 83800
wait for active mode
Buy above 82400
Stoploss.......81950....450 points
Target1........83000....600 points
Target2........83800.....1400 points
Disclaimer- This level only for educational purpose only . Do ur own analysis

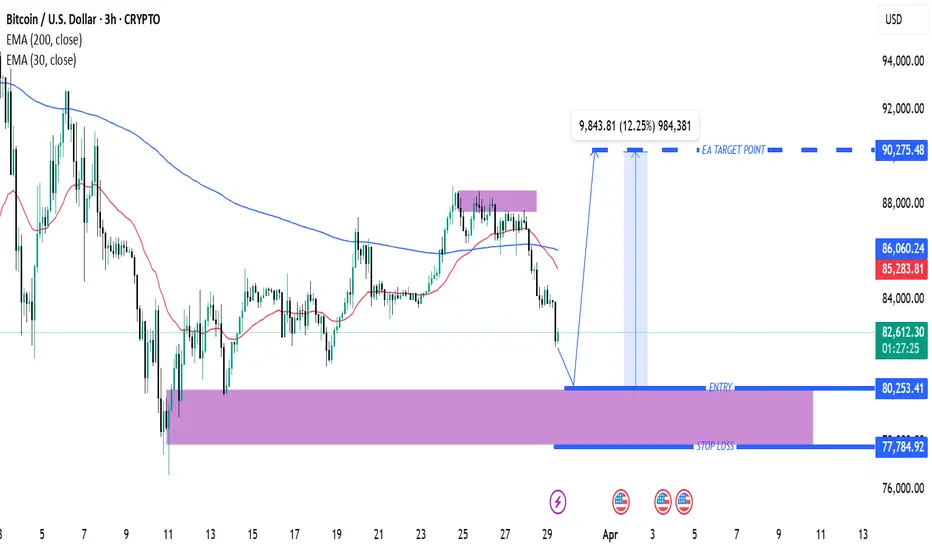
Bitcoin (BTC/USD) 3H Analysis: Key Support & Potential 12% UpsidSupport and Entry Zone (Purple Area at ~$80,253.41)
A significant support zone is marked in purple, indicating a potential area for entry.
This is an area where buying interest is expected.
Stop Loss (~$77,784.92)
A stop loss level is defined below the support zone, which is a risk management strategy.
Target Price (~$90,275.48)
The chart suggests a bullish move if the price bounces from the support.
The expected price increase is around 12.25% from the entry level.
Exponential Moving Averages (EMA)
30 EMA (Red Line, $85,290.12): Short-term trend indicator.
200 EMA (Blue Line, $86,061.21): Long-term trend indicator.
The price is currently below both EMAs, suggesting a bearish trend in the short term.
Market Outlook
The price has recently rejected resistance (purple zone above).
If it holds support at ~$80,253.41, a reversal to the upside is expected.
If the support breaks, further downside could follow.
BTCUSD SHOWING A GOOD DOWN MOVE WITH 1:20 RISK REWARD BTCUSD SHOWING A GOOD DOWN MOVE WITH 1:20 RISK REWARD
DUE TO THESE REASON
A. its following a rectangle pattern that stocked the market
which preventing the market to move any one direction now it trying to break the strong resistant lable
B. after the break of this rectangle it will boost the market potential for break
C. also its resisting from a strong neckline the neckline also got weeker ald the price is ready to break in the outer region
all of these reason are indicating the same thing its ready for breakout BREAKOUT trading are follws good risk reward
please dont use more than one percentage of your capitalfollow risk reward and tradeing rules
that will help you to to become a bettertrader
thank you
Bitcoin (BTC/USD) 2H Analysis: Potential Bullish Continuation or30 EMA (Red, 86,440): Indicates short-term momentum.
200 EMA (Blue, 85,153): Represents long-term trend support.
Support and Resistance Zones
Support Zone (Purple Box - ~86,271 to 85,153): Price is likely to bounce from here.
Resistance Zone (~87,149 and above): Breakout above this could push price higher.
Trade Setup
Entry Consideration: The price is currently testing a demand zone (purple) after a pullback.
Target (Take Profit - 90,118): Expecting a bullish move.
Stop Loss (~86,658 or lower): To manage risk.
Potential Price Action
If Bitcoin holds above the purple demand zone and 30 EMA, it could rally to 90,118.
A breakdown below 86,271 could push it toward 84,366 or lower.
Conclusion
Bullish Bias: If price holds above the support level.
Bearish Risk: If it breaks below the purple zone.
Recommendation: Monitor support at 86,271 and 85,153, as a bounce from these areas could confirm an uptrend.

Bitcoin (BTC/USD) Supply & Demand Zone Analysis – Potential BearThis chart represents a Bitcoin (BTC/USD) price analysis on a 30-minute timeframe. Here’s a breakdown of the key elements:
Supply Zone (Resistance) at ~$85,599
The price has approached this supply zone, which could act as a resistance level.
The expectation is that the price may struggle to break above this level and could reverse downward.
Demand Zone (Support) at ~$81,500 - $81,755
This is labeled as the "diamond zone," which could act as a strong support area where buying interest may emerge.
The price is anticipated to decline towards this level.
Projected Price Movement
The blue arrows suggest a bearish scenario.
The price might initially react to the supply zone, then break below the trendline, confirming a downtrend.
The target for this downward move is the demand zone around $81,500.
Trendline Break
A rising trendline is drawn, which currently acts as support.
If the price breaks below it, it would confirm a bearish momentum shift.
Conclusion
This chart suggests a short-selling opportunity near the supply zone, targeting the demand zone. However, traders should watch for confirmations such as a rejection from resistance and a break below the trendline before entering a trade.

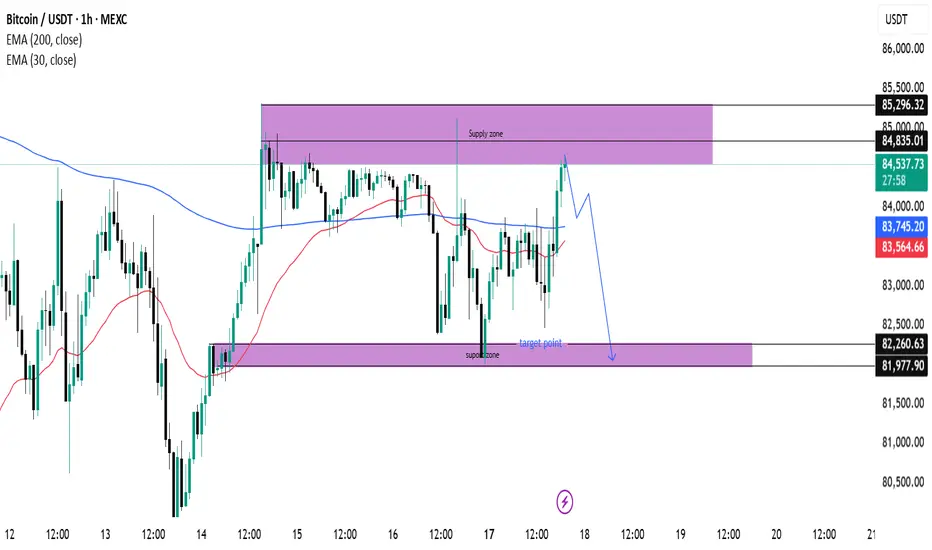
(BTC/USDT) Analysis: Supply Zone Rejection & Potential Drop Key Technical Levels:
Supply Zone (~85,296 - 84,835):
The price has reached a supply zone, which is acting as resistance. A rejection from this area could push BTC down.
Support Zone (~82,260 - 81,977):
This is a demand area where buyers might step in if the price declines.
Indicators:
EMA 30 (Red Line - 83,553.82): Short-term trend indicator.
EMA 200 (Blue Line - 83,743.52): Long-term trend indicator, currently above the price, indicating potential resistance.
Price Action & Prediction:
The price has touched the supply zone and is showing signs of rejection.
The blue projected path suggests a potential pullback followed by a drop toward the support zone (~82,260).
If price breaks below the support zone, further downside could be expected.
Potential Trade Idea:
Short Setup: If rejection at the supply zone continues, a short position could target the 82,260 support zone.
Long Setup: If price reaches the support zone and shows bullish reactions, a long position could aim for a rebound toward resistance.
Bitcoin (BTC/USD) 30-Min Analysis: Bullish Breakout Towards $87This chart represents a 30-minute timeframe of Bitcoin (BTC/USD) on the BITSTAMP exchange. Here's a breakdown of the analysis:
Key Observations:
Support and Resistance Zones:
A Fair Value Gap (FVG) support zone is marked in purple around 82,343 - 83,498, indicating potential demand.
Another resistance zone is identified near 85,000, where price might react before moving further.
The final target point is near 87,947, suggesting a potential breakout.
Exponential Moving Averages (EMAs):
The 200 EMA (blue, 83,498) is acting as a dynamic support.
The 30 EMA (red, 83,654) is closer to the current price, indicating short-term momentum.
Trend Analysis:
An ascending trendline supports the uptrend.
The price bounced from the FVG support zone and surged, signaling bullish momentum.
Projec ted Move:
The blue arrow suggests an expected bullish breakout after a retest of the resistance zone near 85,000.
A potential 6.76% gain is anticipated, targeting 87,947.
Conclusion:
Bullish Bias: The chart suggests an upward trajectory.
Key Confirmation: A clean break above 85,000 would validate the target.
Potential Risks: A drop below the FVG support may invalidate the bullish setup.

Bitcoin (BTC/USDT) Short Trade Setup | 30-Min Chart AnalysisThis chart is a Bitcoin (BTC/USDT) 30-minute timeframe trading setup from Binance on TradingView, showing a short (sell) trade setup with a stop loss, entry, and multiple take profit (TP) levels.
Key Observations:
Indicators Used:
200 EMA (blue line at 83,177.82 USDT) – Long-term trend indicator.
30 EMA (red line at 84,064.45 USDT) – Short-term trend indicator.
Trade Setup:
Entry: 84,423.01 USDT
Stop Loss: 85,315.76 - 85,330.89 USDT (Above the recent high)
Take Profit Levels:
TP1: 84,064.45 USDT
TP2: 83,953.94 USDT
TP3: 83,439.48 USDT
Final Target: 81,850.69 USDT
Market Context:
Price recently tested the 30 EMA and is potentially rejecting it.
Bearish outlook: If price fails to break higher, it may drop to TP levels.
Risk-to-Reward Ratio (RRR): Favorable

BTCUSD SHOWING A GOOD DOWN MOVE WITH 1:30 RISK REWARD BTCUSD SHOWING A GOOD DOWN MOVE WITH 1:30 RISK REWARD
DUE TO THESE REASON
A. its following a rectangle pattern that stocked the market
which preventing the market to move any one direction now it trying to break the strong resistant lable
B. after the break of this rectangle it will boost the market potential for break
C. also its resisting from a strong neckline the neckline also got weeker ald the price is ready to break in the outer region
all of these reason are indicating the same thing its ready for breakout BREAKOUT trading are follws good risk reward
please dont use more than one percentage of your capitalfollow risk reward and tradeing rules
that will help you to to become a bettertrader
thank you

BTCUSD SHOWING A GOOD DOWN MOVE WITH 1:10 RISK REWARD BTCUSD SHOWING A GOOD DOWN MOVE WITH 1:10 RISK REWARD
DUE TO THESE REASON
A. its following a rectangle pattern that stocked the market
which preventing the market to move any one direction now it trying to break the strong resistant lable
B. after the break of this rectangle it will boost the market potential for break
C. also its resisting from a strong neckline the neckline also got weeker ald the price is ready to break in the outer region
all of these reason are indicating the same thing its ready for breakout BREAKOUT trading are follws good risk reward
please dont use more than one percentage of your capitalfollow risk reward and tradeing rules
that will help you to to become a bettertrader
thank you

BTCUSD SHOWING A GOOD UP MOVE WITH 1:7 RISK REWARD BTCUSD SHOWING A GOOD UP MOVE WITH 1:7 RISK REWARD
DUE TO THESE REASON
A. its following a rectangle pattern that stocked the market
which preventing the market to move any one direction now it trying to break the strong resistant lable
B. after the break of this rectangle it will boost the market potential for break
C. also its resisting from a strong neckline the neckline also got weeker ald the price is ready to break in the outer region
all of these reason are indicating the same thing its ready for breakout BREAKOUT trading are follws good risk reward
please dont use more than one percentage of your capitalfollow risk reward and tradeing rules
that will help you to to become a bettertrader
thank you

BTCUSDT TRDAING POINT UPDATE > READ THE CHAPTIAN Buddy'S dear friend 👋
SMC Trading Signals Update 🗾🗺️ crypto Traders SMC-Trading Point update you on New technical analysis setup for crypto BTC USDT crypto currency 💲 crypto Traders BTC
USD ready for. A New. ATH that month Technical patterns support and Resistance level 🎚️ Look good bullish trend 📈 114k don't dare qt Hit but soon 🔜😁
Key Resistance level 106k + 107k + 109k + 114k
Key Support level 97222 - 94219 - 92105 - 89219
Mr SMC Trading point
Pales support boost 🚀 analysis follow)

BTCUSD TRADING POINT UPDATE > READ THE CHAPTIANBuddy'S dear friend 👋
SMC Trading Signals Update 🗺🗾 Cryptocurrency Traders SMC-Trading Point update you on BTC USD Trading Signals BTC USD still holding it down trand 107k 3 Time rejected oderbolk ) 105k) rejected again Short Trade now 3H Time Frame 🖼️ target point 99k)
Key resistance level 107k) 109k)
Kye support level 102k) 101k ) 99k)
Mr SMC Trading point
Support💫 My hard analysis Setup like and following me 🤝 that star ✨ game 🎮

BTCUSD TRADING POINT UPDATE READ >THE CAPTAINBuddy'S dear friend 👋
BTC USD Trading Signals 🗺️🗾 Update crypto trader BTC list week already take a break support level 91k back up trand list week post signals 🚀 analysis Done ✅ for target 🎯 point ☝️ now post again for New analysis technical patterns looks again buying zone right now 108k target 🎯💯
Analysis target we'll see 108k
Resistance level 108k
Support ✨ 99k
Mr SMC Trading point
Support 💫 My hard analysis Setup like And Following 🤝 me that star ✨ game 🎮
