$BTC | 1H: Short-term Plan:
Hong Kong's approval of a BINANCE:BTCUSDT Spot ETF and the anticipation of a new all-time high ($75k) above the previous point of interest at 68.5k.
The recent dip caused by tensions between Iran and Israel has led to the liquidation of long positions, Now time to liquidate shorts. Let's go for it!
BTCUSDT

BTC will return back to 70k in upcoming 2 - 3 daysBTC is ready to flip as halving is nearing, BTC will again shock by liquidating shorts in upcoming days. Hold on spots or low Leveraged longs are expected by the traders.

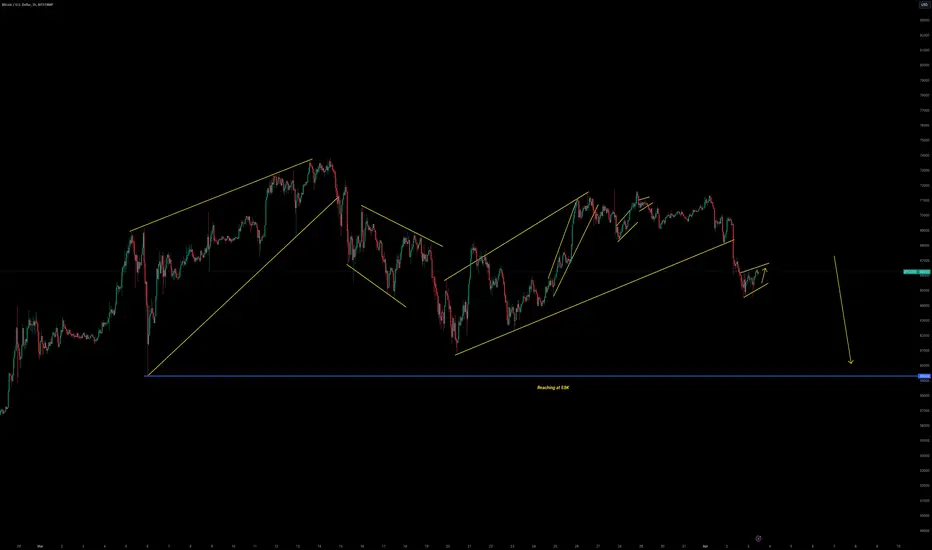
BITCOIN BEARISH MODE SO READY FOR $50,000 ?#BITCOIN BEARISH ALERT
Market Status: Bearish
Key Observations:
Pattern Breakdown: Bullish Pennant formation has been compromised.
Trend Line Status: Currently trading below the key trend line.
Targets: $50,000
Condition:
This target is set under the condition that #BTCUSDT remains below $65,500.
Keep a close eye on the price movement. A sustained position below $65,500 could confirm the bearish momentum towards our target.
Stay tuned for further updates!
CRYPTOCAP:BTC #Cryptocrash

1 $APT = 1 Apartment
Looking to add some Aptos around $12.0. The noticeable Massive Rounding Bottom pattern on the weekly chart signals a bullish market trend, indicating a big pump in the upcoming months, potentially reaching $50.
- Parallel execution of transactions
- AptosBFT consensus mechanism
- Scalability, security, and reliability
As the alt season is on the horizon, it could be the right opportunity to put your money in AMEX:APT . Let's stride ahead!

$BTC | 1H: Game plan:We will be looking to enter a long after the Monday low swept with POI and 200 EMA confluence.
It seems that spot buyers are showing strength while shorts are shorting, which could potentially send CRYPTOCAP:BTC higher.
Our targets for this week are as follows:
1. 72k Liquidation✅
2. 73k Sell order 🔄
3. 75k New ATH 🔄

btc consolidatind and side ways what next ``btc is consolidationg since 2 days in small range of 1000 point
if its break then we can expact a one sided move from hear from any of this side if i fine any tread i will update

BTC BTC BTC BTC, to even crash more or a recovery from here.so we recently witnessed a great closing from BTC above its previous all time high in weekly and monthly closing that is a very strong signal that market is perfectly bullish, but what is it currently happening.
so BTC in order give a perfect breakout from its all time high will ofcourse require to accumulate as much volume as possible thats what is currently happening in the market.
BTC is currently being traded at 65896, and I am expecting a dip up to 57k in 56956k to 60821 area.. there is a good chance BTC recovers from that area very quickly and less chance that it takes a spike up to 52k in 50539 to 53072 area. in either case market is still bullish until it breaks downwards from 47k but it wont reach there.
so trade accordingly and have a very good day.

BTC LongOld Short-Trade Update and Long-Term Plan:
The CME Gap is anticipated to be filled at 64,210. I have closed 80% of my short position at 65,551 and am now planning to initiate buying orders. Key levels to monitor include 64,210, 63,411, and 61,051. As for the stop-loss, it remains undetermined at this stage, and I will provide updates upon closing my positions. While this move is expected, there is a possibility of further downside, so it's crucial to trade cautiously and at your own risk.
Riskier Short Trade:
There's a chance it will descend from 68,400. I will be looking for one final short trade from that level. However, it's important to note that this trade carries higher risk, and only experienced traders should consider attempting it.

Movement to the downsideBTCUSD is forming a corrective formation for a movement to the downside & reaching to reach at 59K
BITCOIN below 60K😱? I mean 57650$.As I share my previous analysis yesterday, bears takes control
Price will reach 59k maybe 57650.i just share my view.i think institutions won't buy
BITCOIN for one or two weeks because of gold.i think we may see lots of manipulation.
Try to learn to analysis by yourself.
Comment your thoughts.

Bitcoin: Mid-Term Price OutlookBitcoin Technical Analysis update
Bitcoin is forming a triangle pattern on the 4h chart. Currently, the price is trading within the triangle just above the 200EMA. We can expect sideways movement around the 65.5k level before a potential breakout. If the price fails to hold above the 200EMA, it could test support at the triangle's bottom line around 63k.
Regards
Hexa

BTC LongI was shorting BTC from 70k. You can check my previous posts. Now, we might see a change in trend.
The CME Gap will be filled at 64210, where I plan to close 80% of the short position and initiate buying orders. The levels to watch include 64210, 63411, and 61051. As for the stop-loss, it's undetermined at this stage, and I'll provide updates upon closing my positions. While this move is expected, there's a possibility of further downside, so trade cautiously and at your own risk.

$BTC | 4H: Short-term game plan:It is currently in a choppy zone on the 4-hour chart, but the higher time frame for #Bitcoin is still showing a bullish trend. This suggests a potential surge in price after a higher low.
The targets before the CRYPTOCAP:BTC halving are:
1. 72k Liquidation🔄
2. 73k Sell order 🔄
3. 75k New ATH 🔄
Previous Day:
VAH: $71182
POC: $70520
VAL : $70216
Date: 1 Apr 2024


#BITCOIN WEEKLY CANDLE ALERT #BITCOIN WEEKLY CANDLE ALERT
In just 7 hours, #BTCUSDT is on the brink of making history.
Aiming for its highest weekly/monthly close EVER, and the first ever above previous cycle's peak!
Previous Highest Weekly Close : $68,951
Need to Close above $69,000
Will #BTC make Highest Weekly/Monthly Candle ?
CRYPTOCAP:BTC

VIRTUAL VERSION IS READY TO FLY As from past few months coin has been consolidated very strongly between 0.005 to 0.01 $ and gann fan has crossed 1/1 means coins is ready to fly in comming days my target of 50% spot will be sold @ 0.08 and rest upto end of the bull run

When Hifi follow RWA hype ?Hifi BYBIT:HIFIUSDT.P
This is one of RWA coin and consolidate since longer time and it can pump and follow RWA hype anytime IMO
Keep an eye on this

👑Bitcoin Analysis: Trading Amid Price Correction📉🔍Today is Tuesday, and it's a favorable day for trading. The cryptocurrency I'm analyzing today is Bitcoin. In the initial candle of the day, Bitcoin experienced a downward movement of around 6%, reaching a support level of $63,054. We need to observe its behavior in the subsequent candles around this support level.
🌊From a Elliott Wave Theory perspective, we've seen a reversal in the lower wave cycle on the 4-hour chart, indicating a minor downturn. However, in the higher wave cycle, Bitcoin remains predominantly bullish, and this correction appears to be a minor adjustment necessary for subsequent upward movements.It's important to note that these corrections on higher time frame charts can shape long-term trends, potentially providing profitable opportunities on lower time frame charts like the 4-hour.
💪The latest key level where price bounced back is around $68,100, forming a strong Potential Reversal Zone (PRZ). This zone coincides with the Point of Control (POC) indicator of the fixed range volume profile, the 0.38 Fibonacci retracement level of the downward wave, and the resistance line of the Elliott Wave Theory. Additionally, the golden cross of the SMA7, 25, and 99 further strengthens this zone.
📊The volume of red candles confirms the short-term downward trend but currently doesn't show any weakness. We need to monitor how the volume behaves in case of a correction.
✅For traders holding short positions, consider taking profits if the price finds support at $63,054. Otherwise, exercise patience and wait for a potential drop to $60,849. If the price sharply rises, take pleasure in your profits. For risk management, set your stop-loss if the sharp upward movement occurs, as it could happen easily due to the overall bullish trend.
📉If you don't currently have a position, wait for the market to establish a new structure before taking any action. If you're unable to wait for a new structure to form, consider opening a short position when the RSI enters oversold territory. However, be aware that this is a risky move. By considering these factors, traders can identify potential trading opportunities amidst Bitcoin's price correction.
🧠💼It's important to acknowledge the inherent risks in futures trading, with the potential for margin calls if risk management is neglected. Always adhere to strict capital management principles and utilize stop-loss orders, ensuring that the initial target offers a risk-to-reward ratio of 2

Looking for short!BTCUSD is looking for short after forming ascending channel & expecting a movement to the downside at 59K

BTC DEEP ANALYSIS Accumulation phase has finished.
Read the chart and study it how they Manipulate market after breaking out of range for the long time. After accumulation it always do fake BREAKOUT.
Manipulation phase has started
Currently hunting sell side liquidity
People will be shorting it for 20k target but they will be rekt soon.
When it start pump and cross above the red box, people will be long on BTC and it will be dumped back below box and suddenly we will see huge green candles that we can't even catch the trade😅
Don't trade futures till btc enters accumulation zone again...go for spot entries for now.
Boost 🚀 if you liked this content which never been talked about.

Charting the Future: $BTC HTF Analysis (2024-2026)Bitcoin recently hit a new ATH of around $74k and is now showing signs of forming a local top before a potential correction. There is a significant amount of liquidation expected below $50,700.
The next $Bitcoin halving is predicted to occur on April 21, 2024. The first support level is at 60k, followed by support around 40k. A correction to 50k is expected before potentially reaching 100k.
Buying below 60k could be a good opportunity. Sell after the second quarter of 2025. In my opinion, do your own research before making any decisions. Good Luck! CRYPTOCAP:BTC

Btc short term setupAs btc is in clear uptrend and it did a break of structure that i have marked BOS on chart.And as bos done there is a demand zone which is our poi. There are three liquidity zones that i have marked onto the chart as well. And trendline liquidity is also marked. Perfect entry and exit zones are given on the chart.
What is your idea?

$BTC | 1H: LTF Plan:
1 CRYPTOCAP:BTC = $100,000. Above 70k bitcoin is extremely bullish, with another all-time high reached today.
While some pullback is expected, it's likely to set the stage for another impressive pump. Send it to 75k!
Previous Day:
VAH: $69826
POC: $69418
VAL : $68980
Date: 11 Mar 2024
