ENA/USDT Now 200% up from our EntryMIL:ENA Update: Strong Momentum in Just a Few Days
I shared an early entry below $0.25, and now MIL:ENA is trading above $0.67 that’s nearly 2.8x your capital from our entry.
Both Target 1 and Target 2 have already been hit.
I remain very bullish on MIL:ENA for the long term, with a potential to reach $5. However, keep in mind the risk is higher at this stage, but the reward could be significant if it reaches that level.
If you entered early, consider booking some profits or at least secure your principal and let the rest ride.
Thanks to everyone who trusted my analysis, slow and steady can bring big returns.
NFA & DYOR
BTCUSDT

"BTC’s Liquidity Grab: Is the Bull Ready to Charge?"🧠 Key Observations:
Break of Structure (BOS):
Multiple BOS levels confirm shifts in market structure from bullish to bearish and back.
The latest BOS near the support zone suggests a possible shift from bearish to bullish trend.
Support & Resistance Zones:
Resistance marked near the 120,241 level, which is also the target zone.
Support is clearly respected around the 114,898 level with price reacting strongly near the equal lows.
Liquidity Hunt:
Price swept the sell-side liquidity below the equal lows around 114,000 and bounced.
This indicates smart money might have collected liquidity before pushing the price higher.
Bearish FVG (Fair Value Gap):
A bearish imbalance around the 117,000 zone acted as a resistance during the previous rally.
Price might revisit this area for a mitigation before continuation to the upside.
Volume Profile (left side):
High volume nodes indicate significant trading interest in that region, confirming key price acceptance zones.
🎯 Expected Move:
If price sustains above the support zone and confirms bullish intent with higher highs, we may see a move towards the target at 119,637 – 120,241 zone.
📌 Conclusion:
Market has potentially formed a liquidity grab and BOS, signaling a bullish reversal. If this structure holds, BTCUSD could target the resistance area. However, if the price breaks below 114,000 again, it might invalidate this bullish setup.

BTCUSDT – Ready to Break the Resistance Wall?Bitcoin just made a perfect rebound from the $115,000 support zone and is now gathering momentum toward the $119,097 resistance. While price remains inside the descending channel, price behavior suggests a potential bullish breakout.
Latest news:
Grayscale confirmed an additional $1.2 billion investment into its Bitcoin fund.
The Fed is signaling a possible pause in rate hikes at the upcoming meeting → weakening USD → direct boost for BTC.
Technical outlook:
FVG zones have been filled → selling pressure is fading.
A “bounce – retest – breakout” formation is emerging.
The descending channel is under pressure, and buyers seem to be gaining control.

BTCUSDT – Charging Ahead in an Ascending Channel, Eyes on 120K!Bitcoin is gliding steadily within a rising channel, consistently printing higher highs and higher lows. After tagging the 120K psychological zone, price made a healthy pullback to key support and bounced back swiftly — reaffirming buyer dominance.
Price action reveals sustained bullish momentum, especially with key U.S. economic data on the horizon. If risk-on sentiment holds, BTC is well-positioned to break past psychological resistance and unlock the next leg higher.
This pullback? It’s not weakness — it’s a setup. And the market is gearing up for another breakout move.

Institution Option Trading📈 Institutional Option Trading – Complete Detailed Guide
Institutional Option Trading refers to how big financial institutions, such as banks, hedge funds, and proprietary trading firms, use options strategically in the market to manage risk, maximize profits, and control large positions with precision. This approach is highly systematic, data-driven, and based on volume, volatility, and liquidity analysis — very different from how retail traders trade options.
💡 What is Institutional Option Trading?
Institutions don’t gamble with options — they use options for:
✅ Hedging — Protecting big portfolios from market drops.
✅ Income Generation — Earning regular profits through premium selling.
✅ Directional Bets — Placing large directional trades with minimal risk.
✅ Volatility Trading — Making profits from changes in volatility without caring about market direction.
📚 Key Features of Institutional Option Trading
1. Focus on Liquidity
Institutions trade highly liquid options, usually:
Index Options (NIFTY, BANKNIFTY, SPX)
Blue-Chip Stocks (Apple, Reliance, TCS, Infosys)
Commodity Options (Gold, Crude Oil)
They avoid low-volume contracts and always trade in markets where they can enter and exit positions without slippage.
2. Use of Option Greeks
Institutions are masters of Option Greeks:
Delta for direction,
Theta for time decay profits,
Vega for volatility play,
Gamma for adjusting positions dynamically.
They don’t trade blindly but monitor how their positions react to price, time, and volatility changes.
3. Premium Selling Bias
Most institutional setups involve selling options (not just buying).
✅ Credit Spreads, Iron Condors, and Covered Calls are preferred.
Why? Because time decay works in their favor, giving consistent income.
4. Hedging Big Positions
Institutions always hedge their trades.
✅ Example: They may hold large stock positions and sell Covered Calls or buy Protective Puts to reduce risk.
✅ This creates balanced portfolios, minimizing market shocks.
✅ Institutional Trading Tools
Open Interest Analysis
Option Chain Data
IV (Implied Volatility) charts
Volume Profile & Market Profile
Real-time Greeks exposure tools
Delta-neutral hedging platforms
📝 Example of Institutional Option Trade
Scenario: NIFTY at 22,000, sideways expectation for next week.
✅ Strategy: Sell 22,500 Call, Sell 21,500 Put (Iron Condor).
✅ Buy hedges: 23,000 Call, 21,000 Put.
✅ Profit Range: If NIFTY stays between 21,500-22,500 → Max Profit.
✅ Risk Managed: Losses capped, steady time decay profit.
🚀 Benefits of Learning Institutional Option Trading
✅ Consistent income instead of gambling
✅ Risk protection using proper hedging
✅ Trade size management for scalability
✅ Ability to handle big accounts with steady growth
✅ Professional market understanding

BTCUSDT – Rebounding from Fair Value Zone! Is the Bull Run Back?Bitcoin is building a strong base around the FVG support zone after rejecting the resistance trendline twice in a row. The current price structure is a textbook bullish setup: pullback – retest of liquidity zone – accumulation – and now prepping for a strong breakout.
Fair Value Gaps have been consistently filled and are acting as dynamic support, signaling that buyers are still in full control. RSI remains steady and not overheated – creating perfect conditions for a breakout.
Target: The 125,910 USDT area is the next clear price objective if BTC holds above the 116,082 USDT support zone.
Fundamental Catalyst: The crypto market is regaining strength after BlackRock officially confirmed its plan to expand its crypto ETF products – investor sentiment is back on the bullish side.
BTCUSDT – Breakout confirmed, bullish momentum continuesBTCUSDT has officially broken above a long-standing resistance channel, confirming a breakout and establishing a base around the nearest Fair Value Gap. The price action maintains a clear uptrend structure with consecutive higher lows and higher highs, supported by consistent buying pressure after minor pullbacks.
In terms of news, the U.S. decision to temporarily delay stricter regulations on spot Bitcoin ETFs, along with stable interest rate signals from the Fed, has boosted market sentiment. Capital continues to flow into crypto, especially as altcoins show limited recovery, making BTC the preferred asset.
As long as BTCUSDT holds above the nearest support zone, the pair is likely to advance toward the next psychological resistance. Any pullbacks could offer a buy-on-dip opportunity in line with the current trend.

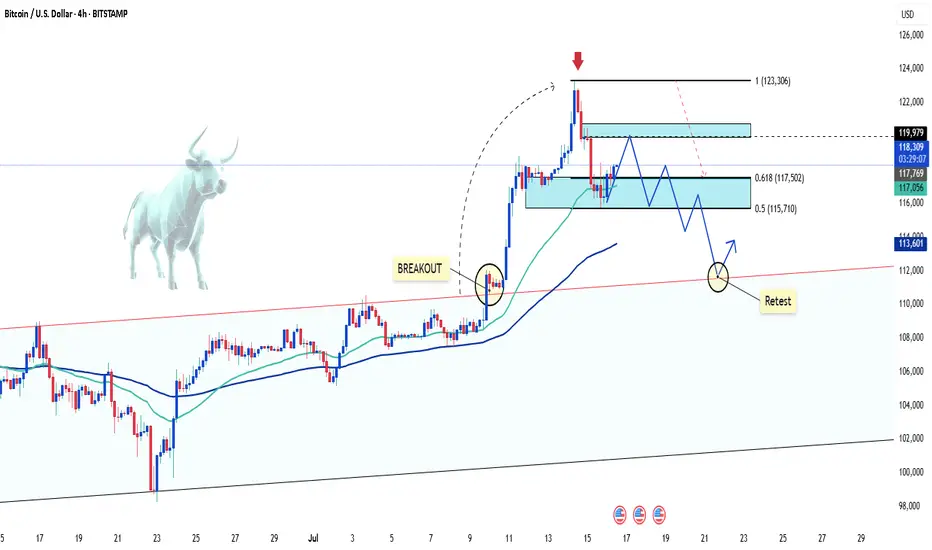
BTC/USD Pullback: What’s Next for Bitcoin?Hello, passionate and wealthy traders! What are your thoughts on BTC/USD?
After a strong surge above the 122,500 USD zone, BTC/USD has started to experience a slight pullback. This is completely normal and necessary for Bitcoin to gain new momentum.
In my personal view, the recent peak of BTC/USD signals that this correction is in play. But where do you think BTC/USD will adjust to? Personally, I believe the 111,500 USD zone is quite reasonable. It’s also the previous breakout level, and this pullback aims to test the uptrend safely.
What about you? Where do you see BTC/USD heading? Looking forward to hearing your thoughts!
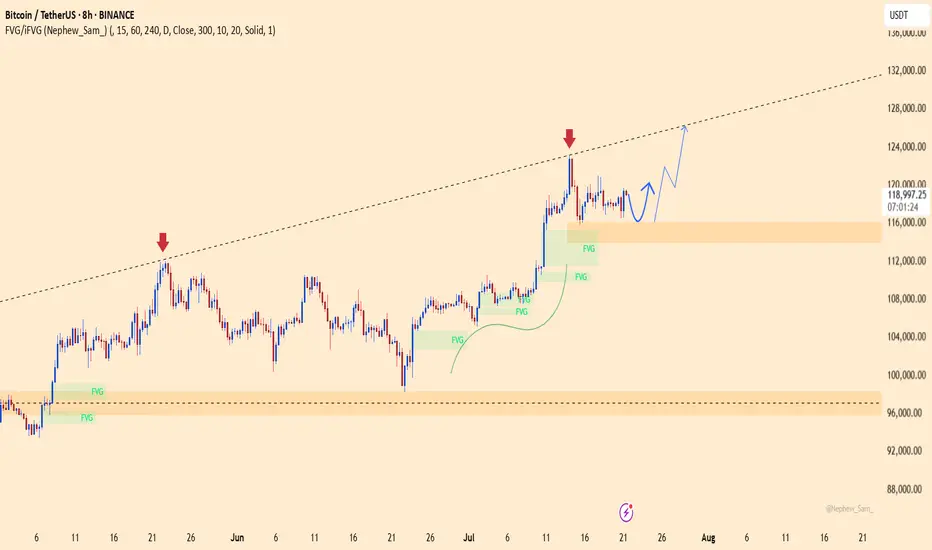
BTCUSDT: Strong Uptrend, Targeting New HighsBTCUSDT is in a very strong uptrend, consistently setting new highs driven by overwhelming buying pressure and green Fair Value Gaps (FVGs).
Currently at $125,144, Bitcoin could reach $134,128 around July 21, 2025. This rally is fueled by ETF approvals, the Halving effect, a favorable macroeconomic environment (safe-haven, inflation hedge), and the expanding crypto ecosystem.
The preferred strategy is to buy on dips or breakout of resistance, always managing risk tightly.

BTC/USD Soars: A Surge That Took the Market by SurpriseBitcoin BITSTAMP:BTCUSD has shocked the market with a massive surge, reaching new highs in recent days. This unexpected jump has taken many traders and analysts by surprise, as BTC breaks through previous resistance levels.
The driving forces behind this surge appear to be increased institutional interest, positive market sentiment, and strong demand from retail investors. As Bitcoin enters new territory, it's essential for traders to stay vigilant and manage their risk, as volatility remains high.
Will Bitcoin continue its rally or face a correction? Keep an eye on the charts for the next move!

Best Possible Elliott Wave Counts: ETHUSDHello friends,
Welcome RK_Chaarts.
Today we're attempting to analyze Ethereum's chart from an Elliott Wave perspective. Looking at the monthly timeframe chart, we can see that from the beginning, around 2015-2016, when data is available, to the top in 2021 we have a Super Cycle degree Wave (I) marked in blue, which has completed.
Next, June 2022 we have a bottom around $874, marking the end of Super Cycle Wave (II) in blue.
We are now unfolding Wave (III), which should have five sub-divisions. Within this, the red Cycle degree Wave I and Wave II have completed, and we have possibly started the third of third wave.
Monthly:
Moving to a lower timeframe (Weekly) where we observed the completion of blue Wave (II) and the start of Wave (III), we notice that within this, the red Cycle degree Wave I and Wave II have completed, and we've possibly started Wave III of cycle degree marked in Red.
Furthermore, friends, within this third wave, we've marked the black Primary degree Waves ((1)) and ((2)), which we've labeled as Rounded ((1)) and Rounded ((2)). We're assuming these are complete, and Wave ((3)) has started, which is our current working hypothesis.
Weekly:
Now, if we move to a lower timeframe, such as the daily chart, we can see that the Cycle degree Wave II, which ended at 1385.70, has been followed by a Primary degree black Wave ((1)) in Black & Wave ((2)) has pulled back, completing Waves ((1)) and ((2)), and now Primary degree Wave ((3)) has started.
Possible wave counts on Daily
Within Wave ((3)), we expect five Intermediate degree waves. We've marked the first Intermediate degree Wave (1) in blue, which is currently unfolding. If we move to an even lower timeframe, such as the 4-hour chart, we can see that within the Intermediate degree blue Wave (1), there are five Minor degree sub-divisions marked in red. Waves 1 and 2 are complete, and Wave 3 is nearing completion.
Possible wave counts on 4 Hours:
Once Wave 3 is complete, we expect Waves 4 and 5 to follow, completing the Intermediate degree blue Wave (1). After that, we may see a dip in the form of Wave (2), followed by a continuation of the bullish trend as blue Wave (3).
Possible wave counts on 60 Min:
Friends, based on our multi-timeframe analysis, the overall wave structure appears bullish. We've provided snapshots of each timeframe, and you can see the nearest invalidation level marked with a red line.
In this study, we're using Elliott Wave theory and structure, which involves multiple possibilities. The scenario we're presenting seems plausible because it's aligned across multiple timeframes and adheres to Elliott Wave principles. However, please remember that this analysis can be wrong, and you should consult with a financial advisor before making any investment decisions.
This post is shared purely for educational purposes, to illustrate possible Elliott Waves.
I am not Sebi registered analyst.
My studies are for educational purpose only.
Please Consult your financial advisor before trading or investing.
I am not responsible for any kinds of your profits and your losses.
Most investors treat trading as a hobby because they have a full-time job doing something else.
However, If you treat trading like a business, it will pay you like a business.
If you treat like a hobby, hobbies don't pay, they cost you...!
Hope this post is helpful to community
Thanks
RK💕
Disclaimer and Risk Warning.
The analysis and discussion provided on in.tradingview.com/u/RK_Chaarts/ is intended for educational purposes only and should not be relied upon for trading decisions. RK_Chaarts is not an investment adviser and the information provided here should not be taken as professional investment advice. Before buying or selling any investments, securities, or precious metals, it is recommended that you conduct your own due diligence. RK_Chaarts does not share in your profits and will not take responsibility for any losses you may incur. So Please Consult your financial advisor before trading or investing.

BTCUSDT – Uptrend intactBitcoin continues to trade within a clear upward trend channel, with multiple Fair Value Gaps acting as strong support zones. After rebounding from the 104,960 area, price successfully retested the ascending trendline and returned to the previous accumulation zone.
Currently, BTC is consolidating near short-term resistance, but bullish momentum remains dominant. As long as price holds above 104,960, a breakout toward the extended resistance zone at 116,971 remains a likely scenario.
Trend: Bullish
Support: 104,960
Resistance: 116,971
Strategy: Favor buying on dips as long as price holds above the trendline and FVG. Nearest target around 116,971.

Bitcoin: Ready to Break Psychological Resistance?BTC is maintaining its bullish structure with strong rebounds from the trendline since April. The price is now approaching the psychological resistance zone at 119,000 – a level that has been rejected three times before.
If support at 104,700 holds and the resistance is broken, BTC could target the 125,000 area. On the other hand, losing this support could interrupt the bullish momentum.
Trade Setup:
Buy around 104,700–106,000
TP: 119,000
SL: below 103,000
Note:
The upcoming NFP report on July 5 may trigger sharp moves if strong data boosts the USD.
Do you expect a breakout or another rejection?

BTCUSDT – Targeting 125,000 if Resistance BreaksBTCUSDT is holding a strong uptrend, with price respecting the ascending trendline and consistently filling fair value gaps. The pair is approaching key resistance around 110,000 and may form a breakout–retest pattern, potentially unlocking a move toward 125,000.
On the news front, institutional inflows are returning, spot ETFs continue to attract capital, and the Fed is keeping rates steady — all supporting bullish momentum. As long as price holds above 101,200, the upside scenario remains in play.

BTCUSDT – Buying Resumes, Bullish Momentum Targets 120,000Bitcoin is flashing strong bullish signals as it continues to hold within a well-defined long-term ascending channel. After a technical bounce from the nearby support zone around 99,614, BTC has regained momentum and is now approaching a key resistance FVG cluster — a potential launchpad for a breakout.
The price structure shows a series of higher lows combined with healthy pullbacks, indicating accumulation and capital rotation back into BTC. A “break–pullback–continuation” pattern is forming, pointing to a likely move toward the psychological resistance level at 120,000 — a target highlighted by many professional traders since the start of the quarter.
Fundamental factors supporting the uptrend:
Large capital inflows are returning to U.S. Bitcoin ETFs, signaling renewed institutional confidence in the bull cycle.
Expectations that the Fed will hold rates steady are weighing on the USD, creating a favorable environment for risk assets like BTC.
Altcoin volatility is fading — often a sign that capital is rotating back into BTC as the market’s leading asset.

BTCUSDT – Is a Breakout Imminent?Bitcoin is once again testing the descending trendline that previously triggered three strong rejections, hovering around the 106,500–106,600 USDT zone. A clear rounded bottom has formed, with strong support holding around 104,200–104,700, fueling the recent rebound.
Price action is now consolidating just below the key resistance, setting the stage for a potential bullish continuation pattern. A clean breakout above this zone could open the door for a rally toward 108,600 and even 110,200 – both previous highs.
However, if the trendline holds again, the highlighted support zone is likely to attract fresh buying interest. The overall market bias leans bullish, but confirmation via breakout is crucial for the next move.
Are you ready to ride the next BTC wave?

Bitcoin is Coiling – Ready to Break Out Toward 112K?On the H8 timeframe, BTCUSDT is forming a clear bullish setup. After a strong rebound from the support zone around 104,489 — which aligns with a previous demand area and Fair Value Gap — price has broken above the descending trendline and is now retesting the resistance near 107,500. This structure is shaping into a broadening triangle pattern, signaling a potential breakout.
If BTC holds the 105,000–106,000 area during the upcoming pullback, there is a high probability of a bullish breakout toward the 112,000 level — a key previous high.
On the news front, market sentiment is improving as U.S.-based Bitcoin ETFs attract fresh inflows, coupled with growing expectations that the Fed will hold interest rates steady amid signs of economic slowdown. These factors are providing strong support for BTC’s medium-term bullish outlook.

USD Index (DXY) Bullish Reversal & Breakout PotentialUSD Index (DXY) Bullish Reversal & Breakout Potential 🚀
The DXY chart displays a strong bullish reversal structure from the support zone near the 99,800–100,200 area. Here’s a professional breakdown of the technical setup:
🔍 Key Observations:
🟢 Bullish Reversal Formation
The price rebounded aggressively from a strong demand zone (support), marked by a green arrow and orange highlight.
Multiple historical reaction zones confirm this level's validity as a reliable support.
📉 Previous Decline & Correction
After reaching the resistance area near 110.400, the price corrected with a bearish channel.
This pullback formed a classic bull flag, a bullish continuation pattern, eventually leading to the current breakout.
🟦 Current Price Action
The market has broken out of the recent downtrend and is forming higher highs and higher lows.
A strong bullish impulse candle confirms renewed buying interest.
🧱 Support & Resistance Levels:
🔵 Resistance Zone (Target): 110.409 — a historically respected area and target for the bullish move.
🟣 Current Support Zone: 105.061 — previously resistance, now likely to act as support after the breakout.
🎯 Bullish Target Projection
If price retests and holds the support at 105.061, the next potential leg can extend towards 110.409, offering a strong risk-to-reward setup.
⚠️ Caution
Watch for a pullback and retest near the support level.
A failure to hold above 105.061 could invalidate the bullish structure.
🧠 Conclusion
The DXY is showing a bullish trend continuation after a breakout from a corrective structure. A successful retest of support could propel price towards the 110.400 target zone 📊.
Bias: ✅ Bullish above 105.061
Invalidation: ❌ Below 105.000

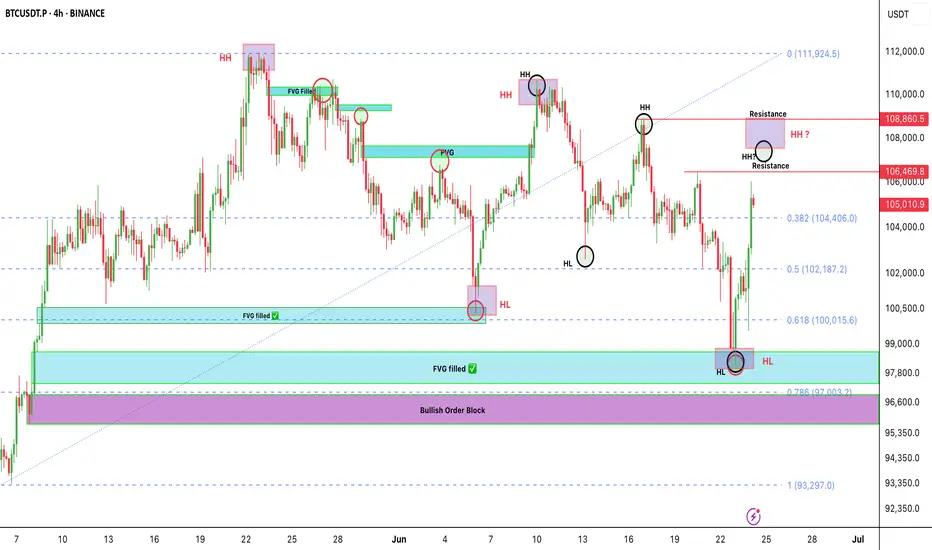
Bitcoin isn’t fully bullish yet — most people are falling for thBitcoin isn’t fully bullish yet — most people are falling for the trap
BTC just bounced beautifully from the $97.8K–$98K demand zone.
It tapped into key confluences:
✅ FVG filled
✅ 0.618-0.786 Fib level
🟪 Bullish Order Block just above 0.786
But let’s be real — we’re not in full bullish mode yet.
This looks more like a short-term pullback, not a trend reversal.
What I'm Watching Closely:
🔹 BTC is forming two HH & HL patterns.
🔹 Super important for us to track both — they’ll guide the next big move.
🟥 LTF last HH = $108,900
🟥 HTF last HH = $110,654
As long as BTC stays below these, the structure is still bearish.
We only flip bullish when candles break and close above them.
If Bullish Breakout happens? We’re eyeing new ATH targets toward $150K 🚀
My Plan Right Now:
🔹 Watching $107K & $109K levels for clean short setups.
Why?
👉 Low-risk entries
👉 Tight SL
👉 Big reward — Targeting around $100K
Stay alert, don’t chase. Let the levels come to us.
Let me know in the comments 👇 Are you flipping bullish, or still cautious?
NFA & DYOR
BTCUSDT – Long-term uptrend intact, target 111,666 USDTBitcoin is maintaining a strong bullish structure on the daily chart, having successfully retested the long-term ascending trendline. The support zone around 93,932 USDT — which aligns with a Fair Value Gap (FVG) and trendline — continues to act as a key rebound level, as seen in late April.
The current chart suggests a “pullback–breakout–consolidation” pattern, with the potential for a higher low if price revisits the trendline and FVG once more. The base case: price consolidates around the 98k–100k zone before targeting the major resistance at 111,666 USDT.
On the news front, investor sentiment is stabilizing after the Fed signaled rate hold. Additionally, BlackRock’s ETF has seen three consecutive days of net inflows — a strong tailwind for the bulls.

$BTC Technical Breakdown – As Predicted!CRYPTOCAP:BTC Technical Breakdown – As Predicted!
I already warned you at $110K to exit or short — and guess what?
We’re now up with 8% profit from that exact call!
#Bitcoin broke structure with a Bearish Divergence, and the trendline is looking weak.
If this war doesn’t stop, I expect further downside below $100K.
Key levels to watch:
🔻 Support 1: $73,500
🔻 Support 2: $48,700
If $100K breaks, don’t be surprised to see $90K → $80K → even $70K.
Don’t say I didn’t alert you.
I clearly told you to short or exit at the top.
Booked profits? Let me know below 👇

BTCUSDT – Holding Support, Bullish Signs EmergingBitcoin remains within a descending channel but continues to defend the strong support area around 101,296 USDT — a level that previously triggered a sharp rebound. On the H4 timeframe, price is consolidating sideways, forming an accumulation range. If this support holds, a bounce toward the 105,356 USDT zone is likely.
As of June 19, Binance holds 41% of global BTC trading market share, providing deep liquidity and tight spreads. This market condition favors a potential short-term recovery in BTC.
A breakout above the key resistance zone at 105,000–106,000 USDT could open the door for a broader upside continuation.

Will Bitcoin Hit $80k Before $171,000 ?Bitcoin is Forming a Inverse Head & Shoulders on the 2D chart...
And if this plays out — we could be looking at a move to $171,000
Here’s what you need to know:
Structure Breakdown:
▪️ Left Shoulder: Completed
▪️ Head: Completed
▪️ Right Shoulder: (in progress)
Neckline: ~$112.5K-$115k
Breakout above neckline = $171K target
That’s a +49% upside move from here.
But here’s the catch...
When too many spot the same pattern — whales love to trap.
Fakeouts, stop hunts, liquidations — you’ve seen it before.
❌ If BTC drops below $100K (Right Shoulder base), this setup flips bearish fast.
Key Support Zones:
▪️ $93,940 (Fib 0.382)
▪️ $80,780 (Fib 0.786)
Trade with confirmation, not emotion.
Respect your invalidation levels and protect capital.
What’s your play if we tap $112K? 👇
NFA & DYOR
